

Abstract
Biochemical and structural studies have shown that the initiation of RNA polymerase II (pol II) transcription proceeds in the following stages: assembly of pol II with general transcription factors (GTFs) and promoter DNA in a “closed” preinitiation complex (PIC)1,2; unwinding about 15 bp of the promoter DNA to form an “open” complex3,4; scanning downstream to a transcription start site; synthesis of a short transcript, believed to be about 10 nucleotides; and promoter escape. We have assembled a 32-protein, 1.5 megadalton PIC5 derived from Saccharomyces cerevisiae and observed subsequent initiation processes in real time with optical tweezers6. Contrary to expectation, scanning driven by transcription factor IIH (TFIIH)7-12 entailed the rapid opening of an extended bubble, averaging 85 bp, accompanied by the synthesis of a transcript up to the entire length of the extended bubble, followed by promoter escape. PICs that failed to achieve promoter escape nevertheless formed open complexes and extended bubbles, which collapsed back to closed or open complexes, resulting in repeated futile scanning.
Optical tweezers have been used in studies of transcript elongation by pol II13-15 with the use of a “dumbbell” configuration, consisting of two beads held in separate optical traps, connected by a segment of DNA. One bead was directly attached to pol II, and the other bead was attached to the opposite end of the template DNA, minimally around 3 kb, for traversing the distance between the traps. For the study of transcription initiation, we adapted a similar approach to the PIC. Pol II, biotinylated for attachment to one bead, was assembled together with transcription factors on DNA and end-labeled with digoxigenin for attachment to the other bead. The transcription factors comprised six GTFs (TBP, TFIIB, TFIIE, TFIIF, TFIIH, and TFIIA) and Sub1 (yeast homolog of human PC4) thought to stabilize the PIC16 (Extended Fig. 1). The DNA contained the SNR20 promoter fused to an additional 2.7 kb length of DNA, sufficient to separate the beads by roughly the wavelength of light. The SNR20 promoter bore a mutation resulting in one, rather than multiple, transcription start sites (TSSs). Two versions of the promoter were used: the otherwise wild-type promoter with the single TSS located 91 bp downstream of the TATA box (SNR20* long), and a deleted version, where the TSS was situated 31 bp downstream (SNR20* short), a distance characteristic of metazoan transcription. Both versions of the promoter have been characterized in bulk transcription experiments17. The PIC, assembled without TFIIK18,19, a peripheral component, was mixed with a 25-fold molar excess of PIC without the additional 2.7 kb DNA, to achieve an overall PIC concentration sufficient to avoid dissociation. A two-fold excess of TFIIK was added, and dumbbells were formed by reaction of the PIC mixture with anti-digoxigenin-coated beads and avidin-coated beads (Extended Fig. 2).
In a dumbbell carrying digoxigenin on the upstream end of the DNA, the tension exerted by the optical trap tends to pull the polymerase downstream, in the same direction as transcription, resulting in an “assisting-load” assay (Fig. 1a). SNR20. Transcription was initiated by the addition of saturating concentrations of all four ribonucleoside triphosphates (rNTPs). Force was maintained during measurements by the use of an optical force clamp as the location of the polymerase on DNA was tracked with sub-nanometer-level precision. Transcription was signaled by movement of the polymerase (Fig. 1b, SNR20* short promoter) at 29 ± 3 bp/s (N = 10, mean ± S.E.M.), consistent with elongation rates observed in previous assays of transcription under similar assisting loads14,15. To confirm the identification of the moving molecules as transcription elongation complexes, we raised the force instantaneously to a value (10–15 pN) that, in our experience, can only be sustained by a stable elongation complex (Fig. 1b, black arrows). Only 2–3% of dumbbells gave rise to transcription elongation complexes, whereas in biochemical assays, about 18% of PICs gave rise to runoff transcripts (Extended Fig. 3a). The lower efficiency of initiation in the single molecule system was likely attributable to the much lower protein concentrations employed (<1 nM, at least 10-fold lower than biochemical assays, Extended Fig. 3b).
Figure 1. Transcription initiation in assisting-load assay.
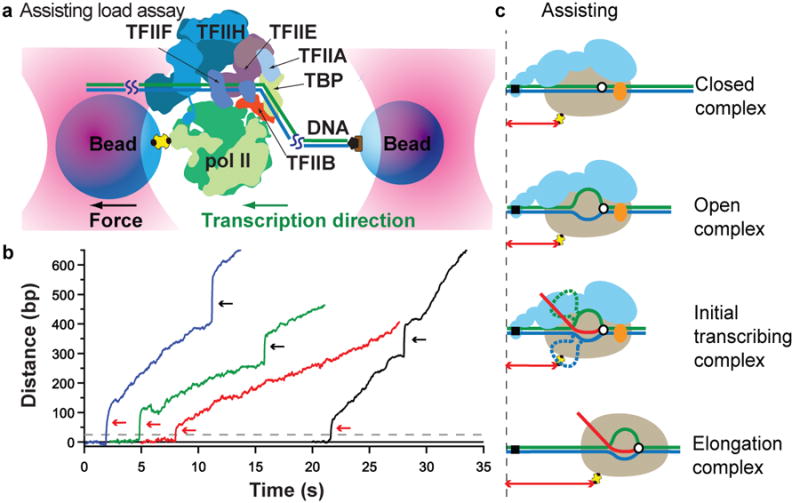
(a) A dumbbell tether (not to scale) is formed between beads (blue) held in separate optical tweezers (pink), with one attached to pol II (green) in the PIC via an avidin-biotin linkage (yellow, black), and the other to upstream DNA via a digoxigenin linkage (brown, black). As transcription proceeds (green arrow indicates direction), the tether extension increases. (b) Representative records of pol II elongation (dashed grey line denotes the TSS location) after promoter escape (red arrows), with the applied force often stepped up after ∼10 s to confirm elongation (black arrows; the associated vertical discontinuity is due to tether stretch). (c) Ssl2 (orange) unwinds the template (blue) and non-template (green) strands of DNA around the active site (white circle, black outline) of pol II (beige) and creates a transcription bubble (OC formation). RNA synthesis while still bound to the promoter results in DNA scrunching at the upstream edge of transcription bubble (ITC), which re-anneals after pol II enters productive elongation (EC). Distances measured by the assays are indicated (double-headed red arrows). Not to scale.
The onset of polymerase movement at a rate characteristic of transcript elongation was preceded by an almost instantaneous jump (Fig. 1b, red arrows), occurring around 15 ± 2 s (N = 10, mean ± S.E.M.) after the addition of rNTPs. An interpretation consistent with all other available information is that the polymerase draws downstream DNA into the active center region to form an extended unwound region, or transcription bubble, and then lurches forward upon DNA rewinding and bubble collapse (Fig. 1c). Because one bead is attached to the upstream end of the DNA and the other bead to the polymerase, there is no change in the distance between them when DNA is drawn in from the downstream side. Only once the polymerase is released from its point of attachment at the upstream edge of the bubble (promoter escape), and DNA rewinds to collapse the bubble, does the distance between the beads change and lengthen (Fig. 1c). The size of the jump at the transition to a transcription elongation complex was 70 ± 13 bp (N = 9, mean ± S.E.M.), with a minimum of 32–34 bp and a maximum of about 140 bp.
The jump upon promoter release, and the corresponding transition to a stable elongation complex, are notable in two further respects. First, the bubble does not collapse completely at the jump, because about 15 bp remain unwound in the pol II active center as a transcription bubble from the time of open complex formation until the end of transcript elongation20. Therefore, the entire length of the unwound region in this initial transcribing complex (ITC) is, on average, approximately 85 bp (70 bp + 15 bp). Second, because this experiment was performed with the SNR20* short promoter (where the TSS is located 31 bp downstream of the TATA box), transcription was initiated within the open complex, and the nascent transcript extended to the downstream end of the unwound region before the jump (Fig. 1c). Evidently, a transcript averaging 70 nucleotides (nt), and as long as about 140 nt, is synthesized before promoter clearance and the transition to a stable elongation complex.
To observe the process occurring before the jump, presumed to involve the drawing of downstream DNA into the pol II active center, we moved the point of attachment of the bead to DNA from the upstream to the downstream end of the template. In this configuration, external forces applied to polymerase tend to pull it upstream, opposite to the direction of transcription, resulting in a “hindering-load” assay (Fig. 2a). Fewer dumbbells (<2%) yielded transcription elongation complexes in this assay, consistent with previous studies showing that hindering loads reduce polymerase processivity. Dumbbells that elongated did so at 17–18 bp/s (Fig. 2b), consistent with previous measurements of pol II transcription under hindering loads14,15. In contrast to the assisting-load assay, there was no jump at the transition to a stable elongation complex, but rather a gradual distance change (Fig. 2b). The distance change was the same size as the jump in the assisting-load assay, and was observed for both forms of the SNR20* promoter. In the case of the SNR20* long promoter, which initiates transcription downstream (dashed line, Fig. 2), the distance change reflects open complex formation and scanning to the TSS; in the case of the SNR20* short promoter, which initiates transcription in the open complex (dashed line, Fig. 2b), the distance change reflects open complex formation, extension of the bubble, and transcription in the ITC (Fig. 2c).
Figure 2. Transcription initiation in hindering-load assay.
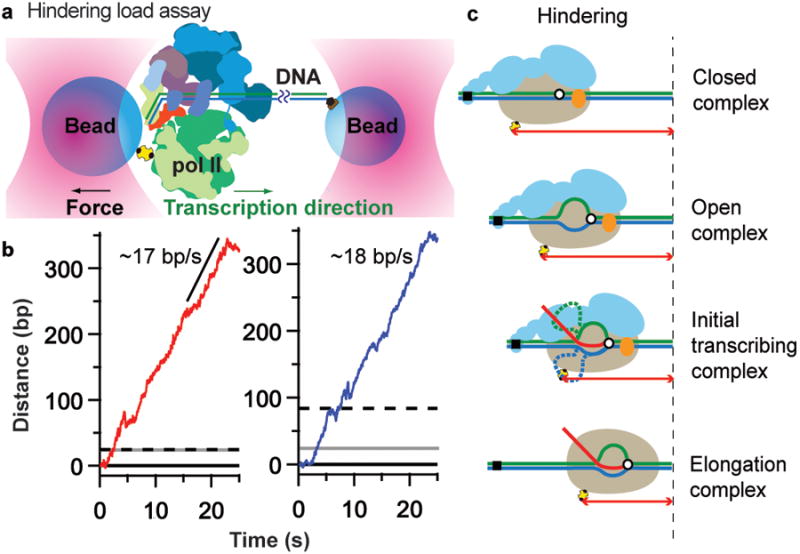
(a) By attaching one bead to downstream DNA, a hindering-load assay was developed (not to scale, Sub1 not shown). Scanning and subsequent transcription events (green arrow indicates transcription direction) resulted in tether-extension decrease. (b) Records illustrating pol II escape and elongation, with a velocity of ∼17–18 bp/s, collected on SNR20* short (red, left panel) and SNR20* long (blue, right panel) in the presence of rNTPs. The dashed black line denotes the TSS at +1; the solid grey line marks position of the predicted ∼24 bp distance change upon OC formation. (c) Distances measured by the assays are indicated (color scheme same as Fig. 1c).
In the single-molecule system, it was possible to investigate not only PICs that initiated transcription, but also those that failed to do so. Approximately 20% of dumbbells showed movement downstream without the initiation of transcription (Fig. 3, Extended Fig. 4). The downstream movement began with an initial distance change of about 24 bp, which was often punctuated, at the temporal resolution of our assay (∼0.1 s), by brief (<2 s) pauses (Fig. 3a,b). After the initial 24 bp, movement continued to a maximum of about 150–200 bp downstream (Fig. 3e), until either the bubble collapsed back to a distance of 24 bp or to 0 bp, or the PIC dissociated, as evidenced by rupture of the dumbbell (Fig. 3b, black arrows). Bubble collapse was often followed by a repetition of the downstream movement.
Figure 3. Records of TFIIH motion for the SNR20* short construct with rNTPs present in hindering-load assay.
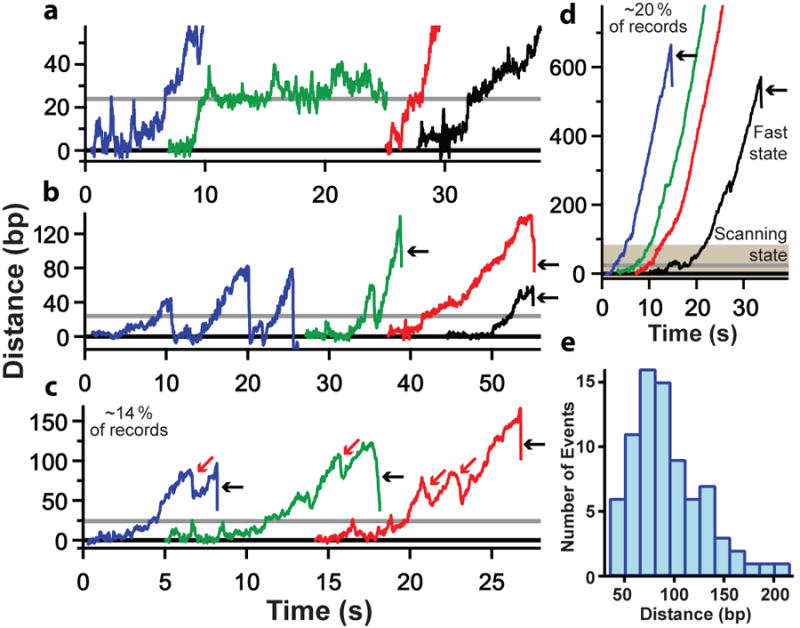
(a) Initial transition from the closed (0 bp) to open complex (∼24 bp predicted distance change, grey line). (b) Scanning behavior, with occasional bubble collapse to the closed complex (blue record) or open complex (green record). (c) Infrequent slips in the records were observed (red arrows) (d) Occasional irreversible transition from scanning (shaded region) to a highly-processive fast state, occurring at a distance of 130 ± 21 bp (N = 9, mean ± S.E.M.). In all records, black arrows mark tether breakage, likely due to PIC dissociation. (e) Histogram of TFIIH processivity, with a peak between 40 bp and 140 bp (N = 78).
The downstream movement was processive, and was observed under all three conditions examined: SNR20* short with rNTPs (N = 40) (Fig. 3a-d); SNR20* long with rNTPs (N = 19) (Extended Fig. 4a); and SNR20* long with dATP (N = 15) (Extended Fig. 4b). There were no significant differences in either processivity or velocity in the three conditions. Combining these data yielded a pause-free velocity for downstream movement of 36 ± 1 bp/s (N = 24). Because the velocity was unchanged when only dATP was present (and no rNTPs), it must have been produced by TFIIH activity, and not by polymerase. The extent of the downstream movement was 94 ± 36 bp (mean ± S.D.) (Fig. 3e). TFIIK, which contains a kinase responsible for phosphorylation of the CTD of pol II18,19, could be omitted without effect. There was no change in the absence of TFIIK in either the distance (92 ± 33 bp, N = 34) or the velocity (36 ± 2 bp/s, N = 4) of downstream movement. In about 20% (N = 15 of 74) of dumbbells that displayed TFIIH activity but failed to initiate transcription, there was a transition to a “fast state,” characterized by a velocity of 61 ± 2 bp/s and downstream movement through hundreds of base pairs (Fig. 3d). The transition to the fast state was irreversible, and must reflect action of the TFIIH helicase subject to little or no restraint by other GTFs or pol II.
Biochemical evidence for movement driven by the TFIIH helicase was obtained by exonuclease III footprinting of the PIC (Extended Fig. 5). Extended regions of unwound DNA were previously revealed by KMnO4 reactivity of yeast and Drosophila promoters in states of transcriptional activity in vivo21-23. The regions were similar in all cases, extending from about 20–60 bp downstream of the TATA box, with the TSSs of the Drosophila promoters near the upstream edge of the unwound region nearest the TATA box, and the TSSs of the yeast promoters near the downstream edge furthest from the TATA box. It had been thought that transcribing polymerases with 15-bp bubbles, at different locations on individual promoters and then revealed collectively in the KMnO4 analysis, gave the appearance of an extended bubble. Our examination of single molecules suggests instead that an extensive unwound region is a characteristic of every individual promoter, rather than some collective property. We obtained similar results for a yeast promoter whose TSS was located near the downstream edge of the unwound region, and for the same promoter whose TSS was moved to the upstream edge, as in Drosophila and other metazoans.
The formation of the unwound region is not a consequence of transcription, but rather of TFIIH action, because it occurs in the presence of dATP without rNTPs, and because it is observed even when the TSS is located at the downstream end of the unwound region. TFIIH must act continuously to maintain the unwound region, consistent with previous biochemical studies showing a requirement of TFIIH to prevent premature arrest of ITCs24,25. It is not known what determines the length of the unwound region, nor where the unwound DNA resides in the complex. In the case of bacterial polymerase transcription, approximately 10 bp of DNA drawn into the active center before the transition to elongation are believed to be accommodated by “scrunching”26,27. The possibility of “scrunching” in eukaryotic transcription has previously been considered28, but no evidence obtained. Because of rotation in the direction of unwinding by TFIIH, there is unlikely to be significant associated torsional strain, as presumed to occur in the bacterial system. The location and the conformational state of the approximately 85 bp of DNA unwound in the pol II PIC thus remain open questions.
Although most PICs (∼80% of PICs in biochemical assay conditions, and 97–98% of PICs under single-molecule assay conditions) fail to yield stable elongation complexes, they are not inert. About 20% of the dumbbells evinced downstream movements of polymerase along DNA in the hindering-load assay. There was often an initial movement of 24 ± 2 bp (mean ± S.D.), which we attribute to the formation of an open complex, on the basis of previous studies of the PIC29 (see Methods).
Following open complex formation, downstream movement continued for a total distance of 94 bp, on average, with bubble collapse back to the open or closed complexes and repetition of downstream movement, before either final dissociation of the PIC or rupture of the dumbbell (Extended Fig. 6). The movement of 94 bp in the hindering-load assay is significant for two reasons. First, it is in excellent agreement with the results of the assisting-load assays, in which a jump of about 70 bp was observed before the onset of transcription elongation. This jump is attributed to collapse of an extended bubble, leaving the original open complex in place, and 70 bp + 24 bp (open complex) = 94 bp. Second, the distance of downstream movement in the hindering-load assay ranged from about 30–150 bp, that is, about 37–157 bp from the TATA box, similar to the distribution of TSSs in yeast, which are located 40–120 bp downstream from the TATA box. Therefore, downstream movements in the hindering-load assay may be attributed to TSS scanning, which precedes the onset of transcription elongation, as observed in the assisting-load assay, and the initiation of transcription in yeast in vivo24,25.
It is commonly noted that TSSs for yeast promoters are spread over a wide region, rather than concentrated near the TATA box, as in metazoans. Nevertheless, as discussed above, our evidence for an extended bubble in the yeast PIC corresponds well with extended bubbles mapped by KMnO4 reactivity in Drosophila21. Moreover, TATA-less promoters, which predominate in metazoans as well as in yeast, have multiple TSSs spread over regions of 50–100 bp in human cells30. Our findings from single-molecule studies of the yeast PIC are therefore likely to hold true for higher eukaryotes, as well.
Online Content
Full Methods and Extended Data display items are available in the online version of the paper; references unique to these sections appear only in the online paper.
Methods
Single-molecule optical-trapping assay
The 29-subunit yeast PIC containing biotinylated pol II was assembled on SNR20* promoter DNA fused to a 2.7 kb DNA “handle”. The DNA handle allowed us to form tethers in both the hindering-load and assisting-load assays by incorporating a digoxigenin tag via PCR at either the downstream or upstream end of the DNA respectively. The constructs containing the handle were mixed in a 1:25 molar ratio with identical PICs assembled on the same promoter DNA, but without the handle, such that the overall concentration of the PIC was 100 nM. PIC complexes assembled on DNA lacking a handle sequence are unable to form tethers, and instead serve to increase the overall concentration of PIC by mass action. The resulting mixture was incubated with two-fold excess of TFIIK18,19,31,32 at room temperature for 20 min to form the complete 32-subunit PIC. This complete PIC was incubated with both anti-digoxigenin-coated 0.9 μm diameter beads and avidin-coated 0.6 μm diameter beads, resulting in tethers being formed with the digoxigenin-containing handle at one end and the biotinylated pol II in the PIC at the other end. On completion of this step, the concentration of PIC was ∼25 nM. In this latter step (and all subsequent steps), the buffer used (50 mM HEPES (pH 7.5), 80 mM KOAc, 5 mM MgSO4, 10 mM DTT, 10% glycerol) was always supplemented with 250 nM TFIIB and 250 nM TFIIE to stabilize and maintain the PIC. The assembled “dumbbell” tethers were flowed into a ∼5 μL flow chamber, and rinsed with ∼10 μL of additional buffer to remove excess beads. Each bead that formed the tether was held in a separate optical trap, allowing controlled load to be applied on the “dumbbell” by using an active force clamp as previously described33. Force uncertainties were estimated at ∼15% due to variations in bead size and systematic calibration errors. The temperature on the trap was estimated to be 26 ± 1 °C34. Single tethers were identified as described34, and held at ∼4 pN constant force for ∼15-20 s, after which transcription buffer (50 mM HEPES (pH 7.5), 80 mM KOAc, 10 mM Mg(OAc)2, 10 mM DTT, 10% glycerol, 1 unit of RNaseOUT (Life Technologies), 250 nM TFIIB and 250 nM TFIIE) containing either 1.6 mM (2×) NTPs or 1.6 mM (2×) dATP was flowed into the flow cell while holding the tether at the same force. In the absence of nucleotides, the dumbbells could be held at about 4 pN without breakage for extended periods. An oxygen-scavenging system [8.3 mg/mL glucose (Sigma), 46 U/mL glucose oxidase (Calbiochem), 94 U/mL catalase (Sigma)] was used to reduce photodamage. Data were collected at 2 kHz sampling frequency, filtered at 1 kHz with an 8-pole Bessel filter (Krohn-Hite) and boxcar averaged over a 20-point window to provide positional feedback to an active force clamp at a rate of 100 Hz. The resulting data was analyzed using Igor Pro (Wavemetrics).
Protein purification
TFIIA, TFIIB and TBP were expressed in bacteria, and TFIIE, TFIIF and TFIIH were isolated from yeast17,29,35,36. Biotinylated pol II was isolated as previously published37. For the expression of recombinant Sub116,38-40, the E. coli Rosetta2 (DE3) strain (Stratagene) was transformed with pCold II vector (Clontech) harboring the TSP1 gene fused to sequence encoding a C-terminal His6-tag. The cells were grown in 2× YT media at 30 °C, and induced with 1 mM isopropyl-1-thio-β-D-galactopyranoside (IPTG) for 16 hours at 15 °C. The cells were then lysed by sonication in a lysis buffer (20 mM Na/K-phosphate buffer (pH 7.5), 500 mM KOAc, 10 mM imidazole, 0.1% Triton X-100, 1 mM DTT, 1 mM benzamidine, 100 μM leupeptin, 10 μM pepstatin A, and 1 mM PMSF), and was eluted by a gradient of 10 to 500 mM imidazole in a buffer containing 20 mM Na/K-phosphate buffer (pH 7.5), 300 mM KOAc, and 5% glycerol. The eluent was further purified using HiTrap Heparin 1 mL (GE healthcare) and CaptoSP ImpRes (GE Healthcare).
DNA constructs for single-molecule experiments
SNR20* short (-62/+96) promoter sequence for hindering-load assay
The sequence of the non-template DNA strand was as follows:
5′-GCCGTTTCCGATGGGCCACTCGGTGAAAACATATAAAAAGGGCTCTACATTCATTTTTTTTAAATGCCCACGAATCTCTTTTCCTTTCGGGTGGATCAAGTGTAGTATCTGTTCTTTTCAGTGTAACAACTGAAATGACCTCAATGAGGCTCATTACC-3′
SNR20* long (-122/+96) promoter sequence for hindering-load assay
The SNR20* long differed from the SNR20* short by containing an additional 60 bp of DNA between the TATA site and the start site. The sequence of non-template strand of the longer promoter is shown, with the bases underlined not present in the shorter promoter:
5′-GCCGTTTCCGATGGGCCACTCGGTGAAAACATATAAAAAGGGCTCTACATTCATTTTTTCATCGATGAGTACTTTACTTGTTATCAGATTTATTCATTTTGTTTCTACTTGTTTTTTTTTTAAATGCCCACGAATCTCTTTTCCTTTCGGGTGGATCAAGTGTAGTATCTGTTCTTTTCAGTGTAACAACTGAAATGACCTCAATGAGGCTCATTACC-3′
SNR20* short (-62/+636) promoter sequence for assisting-load assay
The SNR20* short sequence for the assisting-load assay contained an additional 540 bp of DNA downstream derived from the wild-type SNR20 gene relative to the hindering-load assay, as is shown below:
5′-GCCGTTTCCGATGGGCCACTCGGTGAAAACATATAAAAAGGGCTCTACATTCATTTTTTTTAAATGCCCACGAATCTCTTTTCCTTTCGGGTGGATCAAGTGTAGTATCTGTTCTTTTCAGTGTAACAACTGAAATGACCTCAATGAGGCTCATTACCTTTTAATTTGTTACAATACACATTTTTTGGCACCCAAAATAATAAAATGGACGGGAAGAGACTTTTTAAGCAAGTTGTTTTCCGCTAATGTCAGGTCTCACTACTTTTTGCTGCTATTTTTCTTCGCTCATGGTTTCTTCATAAGGCGTTTTTATGATGGTTTTTCGAAATTGGTTTTTGAGACGACGGAATCACGAATTCTGGATCCTTGCTCAAGGTTATTGTTTTTGTTTTCTTCTGGTTGTTTTCTATTTTCTTTTTTTTAGCTTTCTGTTTCTCCCTTAGTTTGGCTTTTTGCTTCATACTCTTCCCTGTCTTTCCGAGCCGTTTATGTCCAACGCGGGATTTGGTTTTTCTTTATCGATGGGAAGAAATGGTGCTATAGTAGGTTGGGAGATAATATTTATGGTATGGGGTGCTAGTGCGGATGGGGCGCTCTTATTGTTGATTTCTTCGCTCGTCTTCTTTTTCTGGTGGCGCTGCAAGAGGAAGTTTTTCGACTTTGTTATGATTTTTGGTTTGCAAGGAAAGGTGTCTTAC-3′
Generation of DNA templates
A 2.7 kb DNA fragment that served as a “handle” in our single-molecule assay was amplified by PCR from the plasmid pRL702 as previously described33, and was subcloned into the pDrive Cloning Vector (Qiagen). To obtain the three DNA constructs used in this study, three different plasmids were constructed, each containing the handle adjacent to one of the following promoter sequences: SNR20* short (−62/+636), SNR20* short ((−62/+96), and SNR20* long ((−/+96). For the assisting-load assay, the handle was located upstream of the SNR20* short (−62/+636) promoter sequence. For the hindering-load assay, the handle was situated downstream of the SNR20* short (−62/+96) or SNR20* long ((−122/+96) promoter sequence. Regions containing the promoter and the handle were amplified by PCR, using a 5′-digoxigenin labelled primer (IDT) that anneals to the end of the handle, such that PCR products carry a digoxigenin tag on the upstream end of DNA for the assisting-load assay, and on the downstream end of DNA for the hindering-load assay. The generated PCR products were loaded onto TSKgel DEAE-5PW (Tosoh), eluted by a gradient of 0.1-1 M NaCl in a buffer containing 20 mM Tris (pH 7.5) and 2 mM DTT, and concentrated up to 5-10 μM using Vivacon 500 5K MWCO (Vivaproducts), yielding ∼0.15-0.3 nmol from 4-8 mL PCR reaction.
PIC assembly and isolation
The PIC was isolated as previously published35 with minor modifications. 0.15 nmol of SNR20* promoter DNA with or without the 2.7 kb “handle” was separately mixed with 1.5 nmol of TFIIB, 1.5 nmol of TFIIA, 0.8 nmol of TBP, 0.65 nmol of TFIIE, 0.24 nmol of TFIIH-ΔTFIIK, and 0.8 nmol of Sub1 in 90 μL of buffer (500) (20 mM HEPES (pH 7.6), 5 mM DTT, 2 mM MgSO4 and 5% glycerol, with the mM concentration of KOAc in parentheses). The mixture was dialyzed into buffer (300), buffer (220), buffer (150), and then combined with 0.2 nmol of biotinylated pol II-TFIIF complex. The mixture was further dialyzed into buffer (80), and was loaded onto a 10-40% (v/v) glycerol gradient containing 20 mM HEPES (pH 7.6), 5 mM DTT, 2 mM Mg(OAc)2, and 80 mM KOAc, and was ultra-centrifuged for 4 hours at 48,000 rpm (Beckman SW60 Ti rotor). The presence of the 2.7 kb handle did not significantly affect the efficiency of assembly of the PIC.
In vitro transcription assay
Transcription assay was performed as described before35. Briefly, 1.5 pmol of DNA fragment was combined with 3.7 pmol of TFIIB, 3.7 pmol of TFIIA, 1.5 pmol of TBP, 3.7 pmol of TFIIE, 1.5 pmol of TFIIH, 1.5 pmol of pol II, 2.1 pmol of TFIIF, 2.5 pmol of Sub1 in 5 μL of buffer (300) (50 mM HEPES (pH 7.6), 300 mM KOAc, 5 mM DTT, and 5% glycerol), diluted with 5 μL of buffer (10) (20 mM HEPES (pH 7.6), 10 mM KOAc, 5 mM MgSO4, and 5 mM DTT), and incubated for more than 1 hr on ice. The transcription was initiated by adding an equal volume of buffer containing 20 mM HEPES (pH 7.6), 10 mM KOAc, 5 mM MgSO4, 10 mM Mg(OAc)2, 1 unit of RNaseOUT, 5 mM DTT, 1.6 mM ATP, 1.6 mM GTP, 1.6 mM CTP, 40 μM UTP, and 0.83 μM [α-32P] UTP (2.5 μCi). For a titration with KMnO4, HEPES was replaced with 20 mM Na/K-phosphate buffer (pH 7.4), and 4 mM or 40 mM KMnO4 was included in buffer. The reaction was stopped after 15 min by adding 185 μL of stop buffer (300 mM sodium acetate (pH 5.5), 5 mM EDTA, 0.7% SDS, 0.1 mg/mL glycogen, 0.013 mg/mL of proteinase K (Sigma)). Transcripts were precipitated by adding 700 μL of ethanol, dried, and analysed by a denaturing 4-12% acrylamide gel.
Exonuclease footprinting
Exonuclease footprinting was performed as described before35. SNR20* long (-122/+147) was amplified by PCR in 2 mL reaction using 32P-labeled upstream primer (5′-GCCGTTTCCGATGGGCCACTC-3′) and downstream primer (5′-CCATTTTATTATTTT-GGGTGCC-3′), and was purified by electrophoresis in a 2% agarose gel. The labeled DNA (1.5 pmol) was incubated with 3.7 pmol of TFIIB, 3.7 pmol of TFIIA, 2.0 pmol of TBP, 3.7 pmol of TFIIE, 2.0 pmol of TFIIH, 2.0 pmol of pol II-TFIIF complex, and 3.8 pmol of Sub1 in 5 μL of buffer (300) (50 mM HEPES (pH 7.6), 300 mM KOAc, 5 mM DTT, and 5% glycerol), then combined with 5 μL of buffer (30) (50 mM HEPES (pH 7.6), 5 mM MgSO4, 30 mM KOAc, and 5 mM DTT), and incubated for more than 1 hr at 4 °C. The reconstituted PIC was combined with an equal volume of 2× NTP buffer (1.6 Mm NTP(s) or 1.6 mM dATP, 50 mM HEPES pH 7.6, 5 mM MgSO4, 30 mM KOAc, 5 mM DTT, 10 mM Mg(OAc)2, and 5 units of RNaseOUT) and incubated for 4 min at 30 °C. Exonuclease III digestion was performed with 5–10 units of the exonuclease (NEB) for 9 min at 30 °C, and was stopped by adding 185 μL of stop buffer [300 mM sodium acetate pH 5.5, 5 mM EDTA, 0.7% SDS, 0.1 mg/mL glycogen, 0.013 mg/mL of proteinase K (Sigma), 0.5 mg/mL Salmon Sperm DNA (Invitrogen)]. DNAs were precipitated by adding 700 μL of ethanol, dried, and analysed by a denaturing 6% acrylamide gel.
Data analysis of single-molecule records
Transcription in the expected direction resulted in a decrease in extension of the DNA tether in the hindering load assay, and an extension increase the assisting-load assay. In both geometries the change in extension of the DNA tether, which is a function of the applied force, was converted to a distance on the template in bp (∼0.313 nm/bp at ∼4 pN load33). The data acquired was smoothed in software by applying a low-pass filter to it (end of pass band = 0.1 Hz; start of reject band = 50 Hz, number of coefficients = 500). To align the records so that motion was defined to start at 0 bp, the mean value of the region ∼1-2 s of positional data prior to the start of processive motion was set to be the starting (0 bp) distance. The velocities of pol II and TFIIH reported were obtained by dividing the observed change in distance by the time over which the molecule moved. For both pol II and TFIIH, these velocities were calculated over a region of at least 50 bp that was did not contain any resolved pauses (>0.1-0.2 s). As some of the pauses were short lived, especially due to TFIIH motion, we did not have sufficient information to characterize the pause lifetimes or distributions, nor could we reliably use previous techniques33 to get a pause-free velocity. We were likewise unable to determine pause-free velocities from the distributions of instantaneous velocities41, as there was often insufficient data to obtain reliable fits. For the TFIIH records, velocities of the scanning state and fast states, when observed, were occasionally calculated by examining different regions of the molecules that were separated in time by a relatively sharp transition (change within 0.5 s) in velocity. To estimate the processivity of TFIIH during scanning, we only included molecules that traveled at least 30 bp, sufficient to move beyond the noise threshold and extend past the distance of the open complex (24 ± 2 bp).
Calculating Expected Open-Complex Distance
Biochemical studies have shown that the minimal distance of a TSS from the TATA box is about 30 bp, and that transcription begins at this location in the initial open complex4. In the structure of the closed PIC29, this location in the promoter DNA is about 80 Å from the nucleotide addition site of pol II. Open complex formation must bring the TSS to the nucleotide addition site, which therefore requires drawing 80 Å of downstream DNA into the pol II cleft. In the structure of a transcribing complex20, all but 3 bp of downstream DNA are double stranded, and 80 Å corresponds to 24 bp of dsDNA, the same as the initial movement observed in the hindering-load assay.
Extended Data
Extended Figure 1. 29-component PIC assembled on SNR20* short promoter.

(a) PIC excluding the kinase domain (TFIIK) was assembled on SNR20* short (adjacent to the 2.7-kbp downstream handle sequence) and sedimented on a glycerol gradient; fractions were analyzed by SDS-PAGE. (b) The results from fraction 12, annotated in detail, indicate that all PIC components were retained, confirming that the complex reconstituted fully from the component proteins. The subunit(s) of pol II are labeled in black, TFIIF in blue, TFIIE in magenta, TFIIH in orange, TFIIA in cyan, TFIIB in red, TBP in light green, and Sub1 in dark green. TFIIK (3-subunits) was later added to the PIC.
Extended Figure 2. Schematic diagram showing assembly of dumbbells.

PICs were attached to one bead via biotin-avidin linkages (yellow). To form dumbbell tethers, the other end of a small fraction of the PICs (4%) had digoxigenin linkages that could be tethered to anti-digoxigenin-coated beads (black and brown) via a 2.7 kb DNA handle. PICs not involved in tether formation served to increase the local concentration of PIC components.
Extended Figure 3. Run-off transcription under single-molecule assay conditions.

(a) 0.1 pmol of the isolated PIC formed on the SNR20* fragment (−62/+636) fused to the 2.7kbp DNA handle was transcribed in the presence of increasing amount of PICs assembled on the same promoter SNR20* (−62/+96) without handle. The SNR20* fragment fused to the DNA handle failed to support transcription (lane 1), but the transcription activity was restored (red arrow) when PICs without handle were supplemented into the mix (lanes 2–5). Run-off transcription from the SNR20* promoter without handle is indicated (black arrow). We adopted a 25:1 ratio of PICs assembled on SNR20* without handles to PICs assembled on SNR20* with handles for the single-molecule study. (b) 1.5 pmol of PIC formed on the SNR20* fragment (−62/+96) was transcribed at the concentrations indicated above each lane. As the concentration of PIC was reduced from 37 nM to 4.5 nM, the transcription efficiency (run-off band, black) decreased from ∼18% to 2-3%. The extremely low concentrations employed in single-molecule assays (<1 nM) could not be directly examined on such gels, but we expect that transcription efficiencies remained correspondingly low.
Extended Figure 4. Records of TFIIH scanning on SNR20* long with rNTPs or dATP.

Just as for SNR20* short (Fig. 4), the longer promoter shows TFIIH scanning with both rNTPs (a) or dATP only (b), after which either the PIC dissociates (black arrows), or the bubble collapses to the closed (blue and green records) or open complex (grey line) and TFIIH moves again. The dashed line indicates the position of the TSS (+1).
Extended Figure 5. Exonuclease III footprinting assay of the PIC on SNR20* long.

In the absence of nucleotides in vitro, PIC complexes bound to the SNR20* long promoter produced barriers to exonuclease III digestion located ∼50 bp downstream of the TATA box (about −40 nt from the TSS, black arrows). These barriers depended on the presence of TFIIH and also TFIIE, which interacts with TFIIH. Upon the addition of dATP, the barriers disappeared, and the bands at pause positions were intensified between positions −30 and +30 (∼60–120 bp downstream of the TATA box, bracket).
Extended Figure 6. The transcription initiation pathway for SNR20* long (left panel) and SNR20* short promoters (right panel).

A model for the initiation pathway on the SNR20* long promoter. Left panel, with states starting from the top: Pol II (beige) with attached GTFs (blue) and ssl2 (orange) binds in its “closed” form to the promoter element upstream of the TSS (arrow) on the DNA template (green and blue lines). Positions of the enzyme active site (open white circle) and TATA box (closed black square) are indicated. Unwinding by TFIIH produces an open complex (OC) that leads to bubble formation. Arrival of the OC at the TSS due to scanning, driven by TFIIH, leads to the formation of an extended bubble (dashed lines indicate the speculative position of ssDNA. If the complex fails to recognize the TSS, it can be driven beyond it by TFIIH, resulting in a “fast state” that produces no RNA but advances at roughly twice the normal rate (black box; see text). When Pol II recognizes the TSS, it begins transcription of RNA (red line), corresponding to the initial transcription complex (ITC). Formation of the ITC leads to bubble collapse, followed by the loss of GTFs and transition to the elongation complex (EC). Corresponding model for the initiation pathway on the SNR20* short promoter. Right panel, with states starting from the top: Similar states as for SNR20* long. In this case, the OC does not need to scan for the TSS, which is found within its DNA footprint. As a consequence, the ITC can form and begin RNA synthesis once the active site has recognized the TSS. A longer segment of RNA can thereby be produced prior to the transition to the EC.
Acknowledgments
We thank Anirban Chakraborty and Bojan Milic for careful reading of the manuscript, Pierre-Jean Mattei for help with protein purification, and Robert Landick and Jeff Gelles for discussions. This research was supported by NIH grants GM36659 and AI21144 to R.D.K. and GM57035 to S.M.B., and an NSF graduate fellowship to F.M.F.
Footnotes
Author Contributions: F.M.F., C.A.M. and K.M. designed the experiments with input from, and supervision by, S.M.B. and R.D.K. F.M.F. and C.A.M. collected the single-molecule data. K.M. purified and reconstituted the PIC components, and performed the bulk experiments. F.M.F. analyzed the single-molecule data, and C.A.M. and K.M. carried out the modeling. F.M.F., C.A.M., K.M., S.M.B. and R.D.K. wrote the paper.
The authors declare no competing financial interests.
References
- 1.Conaway RC, Conaway JW. General initiation factors for RNA polymerase II. Annu Rev Biochem. 1993;62:161–190. doi: 10.1146/annurev.bi.62.070193.001113. [DOI] [PubMed] [Google Scholar]
- 2.Kornberg RD. The molecular basis of eukaryotic transcription. Proc Natl Acad Sci U S A. 2007;104:12955–12961. doi: 10.1073/pnas.0704138104. [DOI] [PMC free article] [PubMed] [Google Scholar]
- 3.Holstege FC, Fiedler U, Timmers HT. Three transitions in the RNA polymerase II transcription complex during initiation. EMBO J. 1997;16:7468–7480. doi: 10.1093/emboj/16.24.7468. [DOI] [PMC free article] [PubMed] [Google Scholar]
- 4.Pal M, Ponticelli AS, Luse DS. The role of the transcription bubble and TFIIB in promoter clearance by RNA polymerase II. Mol Cell. 2005;19:101–110. doi: 10.1016/j.molcel.2005.05.024. [DOI] [PubMed] [Google Scholar]
- 5.Murakami K, et al. Formation and Fate of a Complete, 31-Protein, RNA polymerase II Transcription Initiation Complex. J Biol Chem. 2013 doi: 10.1074/jbc.M112.433623. [DOI] [PMC free article] [PubMed] [Google Scholar]
- 6.Fazal FM, Block SM. Optical tweezers study life under tension. Nat Photonics. 2011;5:318–321. doi: 10.1038/nphoton.2011.100. [DOI] [PMC free article] [PubMed] [Google Scholar]
- 7.Sawadogo M, Roeder RG. Energy requirement for specific transcription initiation by the human RNA polymerase II system. J Biol Chem. 1984;259:5321–5326. [PubMed] [Google Scholar]
- 8.Schaeffer L, et al. DNA repair helicase: a component of BTF2 (TFIIH) basic transcription factor. Science. 1993;260:58–63. doi: 10.1126/science.8465201. [DOI] [PubMed] [Google Scholar]
- 9.Svejstrup JQ, et al. Different forms of TFIIH for transcription and DNA repair: holo-TFIIH and a nucleotide excision repairosome. Cell. 1995;80:21–28. doi: 10.1016/0092-8674(95)90447-6. [DOI] [PubMed] [Google Scholar]
- 10.Dvir A, et al. A role for ATP and TFIIH in activation of the RNA polymerase II preinitiation complex prior to transcription initiation. J Biol Chem. 1996;271:7245–7248. doi: 10.1074/jbc.271.13.7245. [DOI] [PubMed] [Google Scholar]
- 11.Kim TK, Ebright RH, Reinberg D. Mechanism of ATP-dependent promoter melting by transcription factor IIH. Science. 2000;288:1418–1422. doi: 10.1126/science.288.5470.1418. [DOI] [PubMed] [Google Scholar]
- 12.Grunberg S, Warfield L, Hahn S. Architecture of the RNA polymerase II preinitiation complex and mechanism of ATP-dependent promoter opening. Nat Struct Mol Biol. 2012;19:788–796. doi: 10.1038/nsmb.2334. [DOI] [PMC free article] [PubMed] [Google Scholar]
- 13.Galburt EA, et al. Backtracking determines the force sensitivity of RNAP II in a factor-dependent manner. Nature. 2007;446:820–823. doi: 10.1038/nature05701. [DOI] [PubMed] [Google Scholar]
- 14.Larson MH, et al. Trigger loop dynamics mediate the balance between the transcriptional fidelity and speed of RNA polymerase II. Proc Natl Acad Sci U S A. 2012;109:6555–6560. doi: 10.1073/pnas.1200939109. [DOI] [PMC free article] [PubMed] [Google Scholar]
- 15.Schweikhard V, et al. Transcription factors TFIIF and TFIIS promote transcript elongation by RNA polymerase II by synergistic and independent mechanisms. Proc Natl Acad Sci U S A. 2014;111:6642–6647. doi: 10.1073/pnas.1405181111. [DOI] [PMC free article] [PubMed] [Google Scholar]
- 16.Sikorski TW, et al. Sub1 and RPA associate with RNA polymerase II at different stages of transcription. Mol Cell. 2011;44:397–409. doi: 10.1016/j.molcel.2011.09.013. [DOI] [PMC free article] [PubMed] [Google Scholar]
- 17.Murakami K, et al. Uncoupling Promoter Opening from Start-Site Scanning. Mol Cell. 2015 doi: 10.1016/j.molcel.2015.05.021. [DOI] [PMC free article] [PubMed] [Google Scholar]
- 18.Feaver WJ, Svejstrup JQ, Henry NL, Kornberg RD. Relationship of CDK-activating kinase and RNA polymerase II CTD kinase TFIIH/TFIIK. Cell. 1994;79:1103–1109. doi: 10.1016/0092-8674(94)90040-x. [DOI] [PubMed] [Google Scholar]
- 19.Roy R, et al. The MO15 cell cycle kinase is associated with the TFIIH transcription-DNA repair factor. Cell. 1994;79:1093–1101. doi: 10.1016/0092-8674(94)90039-6. [DOI] [PubMed] [Google Scholar]
- 20.Gnatt AL, Cramer P, Fu J, Bushnell DA, Kornberg RD. Structural basis of transcription: an RNA polymerase II elongation complex at 3.3 A resolution. Science. 2001;292:1876–1882. doi: 10.1126/science.1059495. [DOI] [PubMed] [Google Scholar]
- 21.Giardina C, Perez-Riba M, Lis JT. Promoter melting and TFIID complexes on Drosophila genes in vivo. Genes Dev. 1992;6:2190–2200. doi: 10.1101/gad.6.11.2190. [DOI] [PubMed] [Google Scholar]
- 22.Giardina C, Lis JT. DNA melting on yeast RNA polymerase II promoters. Science. 1993;261:759–762. doi: 10.1126/science.8342041. [DOI] [PubMed] [Google Scholar]
- 23.Giardina C, Lis JT. Dynamic protein-DNA architecture of a yeast heat shock promoter. Mol Cell Biol. 1995;15:2737–2744. doi: 10.1128/mcb.15.5.2737. [DOI] [PMC free article] [PubMed] [Google Scholar]
- 24.Dvir A, Conaway RC, Conaway JW. A role for TFIIH in controlling the activity of early RNA polymerase II elongation complexes. Proc Natl Acad Sci U S A. 1997;94:9006–9010. doi: 10.1073/pnas.94.17.9006. [DOI] [PMC free article] [PubMed] [Google Scholar]
- 25.Spangler L, Wang X, Conaway JW, Conaway RC, Dvir A. TFIIH action in transcription initiation and promoter escape requires distinct regions of downstream promoter DNA. Proc Natl Acad Sci U S A. 2001;98:5544–5549. doi: 10.1073/pnas.101004498. [DOI] [PMC free article] [PubMed] [Google Scholar]
- 26.Kapanidis AN, et al. Initial transcription by RNA polymerase proceeds through a DNA-scrunching mechanism. Science. 2006;314:1144–1147. doi: 10.1126/science.1131399. [DOI] [PMC free article] [PubMed] [Google Scholar]
- 27.Revyakin A, Liu C, Ebright RH, Strick TR. Abortive initiation and productive initiation by RNA polymerase involve DNA scrunching. Science. 2006;314:1139–1143. doi: 10.1126/science.1131398. [DOI] [PMC free article] [PubMed] [Google Scholar]
- 28.Miller G, Hahn S. A DNA-tethered cleavage probe reveals the path for promoter DNA in the yeast preinitiation complex. Nat Struct Mol Biol. 2006;13:603–610. doi: 10.1038/nsmb1117. [DOI] [PMC free article] [PubMed] [Google Scholar]
- 29.Murakami K, et al. Architecture of an RNA polymerase II transcription pre-initiation complex. Science. 2013;342:1238724. doi: 10.1126/science.1238724. [DOI] [PMC free article] [PubMed] [Google Scholar]
- 30.Sandelin A, et al. Mammalian RNA polymerase II core promoters: insights from genome-wide studies. Nat Rev Genet. 2007;8:424–436. doi: 10.1038/nrg2026. [DOI] [PubMed] [Google Scholar]
- 31.Laybourn PJ, Dahmus ME. Phosphorylation of RNA polymerase IIA occurs subsequent to interaction with the promoter and before the initiation of transcription. Journal of Biological Chemistry. 1990;265:13165–13173. [PubMed] [Google Scholar]
- 32.Feaver WJ, Gileadi O, Li Y, Kornberg RD. CTD kinase associated with yeast RNA polymerase II initiation factor b. Cell. 1991;67:1223–1230. doi: 10.1016/0092-8674(91)90298-d. [DOI] [PubMed] [Google Scholar]
- 33.Larson MH, et al. Trigger loop dynamics mediate the balance between the transcriptional fidelity and speed of RNA polymerase II. Proc Natl Acad Sci USA. 2012;109:6555–6560. doi: 10.1073/pnas.1200939109. [DOI] [PMC free article] [PubMed] [Google Scholar]
- 34.Koslover DJ, Fazal FM, Mooney RA, Landick R, Block SM. Binding and translocation of termination factor rho studied at the single-molecule level. J Mol Biol. 2012;423:664–676. doi: 10.1016/j.jmb.2012.07.027. [DOI] [PMC free article] [PubMed] [Google Scholar]
- 35.Murakami K, et al. Formation and fate of a complete 31-protein RNA polymerase II transcription preinitiation complex. J Biol Chem. 2013;288:6325–6332. doi: 10.1074/jbc.M112.433623. [DOI] [PMC free article] [PubMed] [Google Scholar]
- 36.Murakami K, et al. Tfb6, a previously unidentified subunit of the general transcription factor TFIIH, facilitates dissociation of Ssl2 helicase after transcription initiation. Proc Natl Acad Sci USA. 2012;109:4816–4821. doi: 10.1073/pnas.1201448109. [DOI] [PMC free article] [PubMed] [Google Scholar]
- 37.Schweikhard V, et al. Transcription factors TFIIF and TFIIS promote transcript elongation by RNA polymerase II by synergistic and independent mechanisms. Proc Natl Acad Sci USA. 2014;111:6642–6647. doi: 10.1073/pnas.1405181111. [DOI] [PMC free article] [PubMed] [Google Scholar]
- 38.Ge H, Roeder RG. Purification, cloning, and characterization of a human coactivator, PC4, that mediates transcriptional activation of class II genes. Cell. 1994;78:513–523. doi: 10.1016/0092-8674(94)90428-6. [DOI] [PubMed] [Google Scholar]
- 39.Henry NL, Bushnell DA, Kornberg RD. A yeast transcriptional stimulatory protein similar to human PC4. J Biol Chem. 1996;271:21842–21847. doi: 10.1074/jbc.271.36.21842. [DOI] [PubMed] [Google Scholar]
- 40.Malik S, Guermah M, Roeder RG. A dynamic model for PC4 coactivator function in RNA polymerase II transcription. Proc Natl Acad Sci U S A. 1998;95:2192–2197. doi: 10.1073/pnas.95.5.2192. [DOI] [PMC free article] [PubMed] [Google Scholar]
- 41.Neuman KC, Abbondanzieri EA, Landick R, Gelles J, Block SM. Ubiquitous transcriptional pausing is independent of RNA polymerase backtracking. Cell. 2003;115:437–447. doi: 10.1016/s0092-8674(03)00845-6. [DOI] [PubMed] [Google Scholar]