

Abstract
It is well established that African Americans (AA) experience greater pain associated with a variety of clinical conditions, and greater pain sensitivity to experimental pain tasks relative to non-Hispanic Whites (W). Notably, African Americans do not show the same relationships involving endogenous pain regulatory mechanisms and pain sensitivity documented in Caucasians, including positive associations between blood pressure, norepinephrine, cortisol and greater pain tolerance.
Objectives
The purpose of this study was to examine the relationship between plasma oxytocin (OT) and pain sensitivity and to explore the relation of OT to other factors known to influence pain perception.
Design
OT concentration and sensitivity to ischemic, cold pressor, and thermal pain tasks were assessed in African American (n=25) and non-Hispanic White (n=23) pre-menopausal women.
Results
African American women demonstrated significantly lower pain tolerance across tasks compared with Whites (F1,46 =6.31, p=0.0156) and also exhibited lower plasma OT levels (AA: 3.90, W: 7.05 pg/mL; p=0.0014). Greater OT levels were correlated with greater tolerance to ischemic pain (r=0.36, p=0.013) and accounted for a marginally significant portion of the ethnic difference in ischemic pain tolerance (B=+0.29, p=0.06). Greater OT was also correlated with greater tolerance of cold pressor pain (r=0.31, p=0.03); however, this association was no longer seen after the variance due to ethnicity was accounted for.
Conclusion
These data suggest that reduced oxytocinergic function may be one of multiple biological factors contributing to the greater sensitivity to experimental ischemic pain, and to the greater burden of some types of clinical pain experienced by African Americans compared with Whites.
Keywords: oxytocin, pain sensitivity, African Americans, norepinephrine, beta-endorphin
Introduction
In this investigation, we explored two primary research questions: Is the peptide oxytocin (OT) related to reduced sensitivity to experimental pain? Do differences in OT levels contribute to the well-documented ethnic differences in clinical and experimental pain sensitivity?
It is well established that African Americans (AA) experience greater pain associated with a variety of acute and chronic medical conditions relative to non-Hispanic Whites (W) (Faucett et al. 1994, Breitbart et al. 1996, Sheffield et al. 1999, Edwards et al. 2001b, Green et al. 2003) including osteoarthritis (Creamer et al. 1999), angina pectoris (Sheffield et al. 1999), post-surgical (Faucett et al. 1994), migraine headache (Stewart et al. 1996), temporomandibular joint (Widmalm et al. 1995) and AIDS-related symptom pain (Breitbart et al. 1996). This finding persists in both men and women, in children, and in both young and elderly adults. However, differences in medication rates (Ng et al. 1996), physician assessments and treatment (Todd et al. 1994, Todd et al. 2000), disease severity, access to health care (Edwards et al. 2001a), and other factors that influence pain make identification of causal factors difficult. Therefore, in order to better understand the biological and psychosocial determinants of the ethnicity–pain relationship, experimental studies of pain sensitivity in initially pain-free, healthy volunteers in response to administration of noxious stimuli have been conducted. As in studies of clinical pain rates, African American men and women have consistently demonstrated greater sensitivity to these standardized pain stimuli compared with Whites (Edwards and Fillingim 1999, Edwards et al. 2001b, Campbell et al. 2005). Specifically, in response to multiple types of experimental pain, including ischemic, cold pressor, and thermal heat pain, African American men and women do not differ from Caucasians in reporting pain onset (threshold), but do consistently report lower pain tolerance levels, defined as the point at which an individual is no longer able to tolerate or endure the painful stimulus. Importantly, pain sensitivity to these experimental pain stimuli has been found to predict both the magnitude and the onset of clinical pain (Fillingim et al. 1996, Edwards et al. 2001b, France et al. 2004, Goldman and Maixner 2005). This predictive utility identifies experimental pain testing as one valid tool to use in investigation of the biopsychosocial determinants of ethnic differences in clinical pain.
Multiple biological pathways are involved in modulating pain perception in response to internal and external events, and there is considerable evidence that many of the physiological responses to stress and/or painful stimuli act to diminish the perception of pain (Maixner 1989, Ren et al. 2005). Stress-induced analgesia is documented in numerous animal and some human studies (Randich and Maixner 1986, Miller et al. 1993, Sheps et al. 1995, al’Absi and Petersen 2003, Girdler et al. 2005), and an integrated pain inhibitory response is theorized by some as an adaptive component of the multi-system defense reaction, facilitative of fight, flight and survival (Jessell and Kelly 1991). This premise is supported by experimental studies showing inverse relationships of blood pressure (BP) levels with pain sensitivity in animal models (Dworkin et al. 1979, Maixner et al. 1982, Randich and Maixner 1984), and in both hypertensive and normotensive humans (Sheps et al. 1992). Similarly, decreased pain sensitivity is associated with greater adrenergic (Sagen et al. 1991) and/or hypothalamic–pituitary–adrenal axis (HPA) activity (al’Absi et al. 2002) characteristic of the stress response.
In our recent research examining endogenous pain regulatory mechanisms we documented, in a mixed gender sample, that African Americans not only showed reduced pain tolerance to experimental pain stimuli relative to Caucasian men and women, but that in African Americans there was also an absence of the expected endogenous pain inhibitory mechanisms documented in Caucasians, and which have been reported in other studies (Edwards et al. 2001b). Likewise, in our recent report, only Caucasians showed the expected positive associations between higher pain tolerance and greater BP, plasma norepinephrine (NE), and cortisol. For the African American sample, all correlations involving these biological measures were uniformly low and non-significant (Mechlin et al. 2005). This suggests that inherent differences, alterations or adaptations in one or more biological pathways involved in pain inhibition may contribute to the observed ethnic differences in pain.
The purpose of the present report was to extend this line of inquiry by examining the relationship between plasma OT and pain sensitivity in a biracial sample of women. OT is a distinctly mammalian neuropeptide associated with social affiliation and feelings of well-being. It is manufactured at numerous central and peripheral sites; however, the paraventricular nucleus (PVN) of the hypothalamus has been identified as a primary source. OT synthesized there is released into the systemic circulation where it acts as a hormone at multiple sites throughout the body. Oxytocinergic fibers emanating from the PVN also reach numerous and varied sites in brain and spinal cord (Sawchenko and Swanson 1982, Gimpl and Fahrenholz 2001), allowing OT to act as a neuromodulator, potentiating or attenuating activity in different systems to engender widespread, integrated effects. Although best known for its function in milk let-down in lactation, uterine contractions during parturition, and more recently, for its role in social behaviors (Pedersen and Prange 1979, Carter et al. 1992, Insel et al. 1995, Carter 1998, Insel and Young 2001, Pedersen and Boccia 2002, Uvnas-Moberg and Petersson 2005), OT has also been shown in animal models to inhibit pain responses (Lundeberg et al. 1994, Condes-Lara et al. 2005). OT fibers terminate in areas of pain modulation in the brain (Sofroniew 1980, Sofroniew et al. 1981) and spinal cord, where descending anti-nociceptive pathways may exert analgesic effects (Richard et al. 1991). Moreover, in a series of rodent studies, Uvnas-Moberg and colleagues (Uvnas-Moberg et al. 1992) have shown that OT administration reduces pain sensitivity to thermal heat (Petersson et al. 1996, Agren et al. 1997) and mechanical pain (Petersson et al. 2001) while OT antagonist given with OT blocks these effects, and OT antagonist given alone increases pain sensitivity (Uvnas-Moberg et al. 1992). In the few studies done in humans, the relationship between higher OT concentrations and lesser pain sensitivity has also been supported. Lower plasma OT concentrations have been linked to greater clinical pain in depressed women with fibromyalgia (Anderberg and Uvnas-Moberg 2000), and to greater abdominal pain in children and adults (Alfven et al. 1994, Ohlsson et al. 2005). Intrathecal OT administration has reduced pain in a dose-dependent manner in a placebo-controlled study of men and women with acute or chronic low back pain (Yang et al. 2002); and intraventricular OT administration lessened intractable thoracic cancer pain in a single terminally ill patient with mesothelioma (Madrazo et al. 1987). The research supports several candidate mechanisms mediating the antinociceptive effects of OT, including enhancement of endogenous opioid activity (Lundeberg et al. 1994, Petersson et al. 1996, Lund et al. 2002, Miranda-Cardenas et al. 2006) and reduction of sympathetic nervous system activity (Sofroniew 1980).
These data from animal and human studies strongly suggest that pain sensitivity may be modulated, in part, by endogenous OT activity; however, an examination of ethnic differences in this relationship has not been reported. Therefore, we investigated the association of plasma OT concentration with three types of experimental pain (ischemic, thermal, and cold pressor) in both African American and non-Hispanic White pre-menopausal women in order to explore its role as a potential mediator of ethnic differences in pain sensitivity.
Methods
Participants
Selection
Participants in the present report comprise a large, all female sub-sample of volunteers tested in a study designed to examine the effects of ethnicity, gender, and stress on physiological mechanisms involved in endogenous pain regulation (Mechlin et al. 2005). As part of a post hoc investigation of the association of OT to pain sensitivity, OT concentrations were assayed from baseline plasma samples in female subjects only. This decision was based on the availability of archived plasma samples, and on our previous results showing that plasma OT was related to more physiological and affective variables in women compared with men. Of the 56 female volunteers tested in the parent study (56 females, 50 males), 48 females had both full pain-testing data and plasma available for OT assay. Therefore, these 48 women were selected for the present investigation of the association of OT levels to pain sensitivity.
Ethnicity
This was determined by the subject’s response to an open-ended question of their race/ethnicity: 25 women, self-identified as African American (AA), were compared with 23 who self-identified as non-Hispanic White.
Recruitment
Subjects volunteered in response to newspaper ads seeking healthy non-smokers for a study of pain perception. All women were pre-menopausal, medically healthy, normotensive to pre-hypertensive (maximal resting baseline BP: 136/84 mm Hg), and free of chronic disease or pain disorders. None took prescription medication, including antidepressants, hormonal medications, or oral contraceptives, and none reported the regular use of over-the-counter medications, including analgesics, non-steroidal anti-inflammatory agents or antihistamines. A structured interview based on the Hamilton Depression (score<7) and Anxiety Scales (score<9) confirmed the absence of current mood disorders.
Procedures
As part of the larger protocol, described elsewhere (Mechlin et al. 2005), each woman underwent identical experimental laboratory testing once in each of three phases of the menstrual cycle (early follicular, late follicular and luteal phases), randomizing order within each ethnic group. As evidence indicates a priming effect of estrogen on OT synthesis, release, and receptor expression (DeKloet et al. 1986, Petersson et al. 1999, Light et al. 2005b), we examined the relationship of OT to pain sensitivity in the late follicular phase (days 8–12) when estrogen is rising to ovulatory peak, using serum estradiol and progesterone to confirm phase. Therefore, only results exclusive to late follicular phase testing are reported here. The proportion of women for whom the late follicular phase was their first (33%), second (38%), or last test session (29%) did not differ (Chi-square=0.50, ns).
Screening
Subjects first attended a brief screening appointment where eligible volunteers gave written informed consent with an institutional review board-approved consent form. Procedures were then described, laboratory and pain-testing equipment were introduced, and a preliminary thermal pain threshold test was performed to familiarize subjects with procedures and reduce the effects of novelty and first-time exposure on subsequent pain testing.
Laboratory protocol
For all subjects, lab sessions began between 12 p.m. and 2 p.m. on a day separate from screening appointment. Although not a focus of the current report, a research goal of the larger study (Mechlin et al. 2005) was investigation of mechanisms mediating stress-induced reductions in pain perception (hypoalgesia). Therefore, in order to assess the effects of mental stress on pain perception, subjects underwent two identical counterbalanced intervals of pain testing preceded either by 20 minutes of experimental stress in the form of the Trier Social Stress Test (TSST) or by a time-equivalent period of seated rest (REST), with order of TSST versus REST strictly counterbalanced within both ethnic groups. The progression of experimental events was: Instrumentation with cardiovascular monitors and insertion of intravenous catheter into a forearm vein, Acclimation (10 minutes), Baseline (10 minutes), REST or TSST (23.5 minutes), Recovery (10 minutes), Pain Testing, REST or TSST (23.5 minutes), Recovery (10 minutes), and Pain Testing.
Baseline
Immediately following the establishment of intravenous line, 20 minutes of quiet seated rest ensued. The first 10 minutes served as an acclimation period, while the last 10 minutes was used as baseline. Venous blood was sampled for OT, NE, cortisol, adrenocorticotropin hormone (ACTH), beta-endorphin, estradiol, and progesterone at the end of baseline. BP readings were taken at minutes one, three, five, seven, and nine of baseline and were averaged to comprise Baseline systolic blood pressure (SBP), diastolic blood pressure (DBP), and mean arterial pressure (MAP).
Trier Social Stress Test (TSST)
The TSST was chosen based on its documented ability to reliably elicit large and consistent cardiovascular and neuroendocrine stress responses, including indices of HPA, immune, and sympathetic nervous system activation in various populations including young and elderly, male and female, as well as women in different phases of the menstrual cycle, on oral contraceptives or after menopause (Kirschbaum et al. 1993, Kirschbaum et al. 1999, Rohleder et al. 2001, Heinrichs et al. 2003, Rohleder et al. 2003, Schommer et al. 2003, Kudielka et al. 2004). We administered a modified version in which serial addition was substituted for the serial subtraction component of the test, and in which subjects were not ambulatory. The TSST consisted of (1) Pre-Task Instructions; (2) Speech Preparation (five minutes): Each subject silently prepared a five-minute talk to be delivered to 2–3 mock judges; (3) Public Speaking (five minutes): Each subject was tape-recorded as she delivered her prepared talk to a silent ‘committee’; (4) Paced Auditory Serial Addition (eight minutes 30 seconds): Subjects were required to serially add a succession of numbers presented by tape-recorder. Subjects were motivated further by the opportunity to earn up to $10.00 for each task based on performance.
Recovery
It consisted of 10 minutes of quiet solitary seated rest.
Pain-testing procedures
Following both post-TSST and post-REST Recovery periods, subjects underwent three pain test procedures to assess threshold (onset of pain, when the stimulus first is perceived as painful), tolerance (when the stimulus is perceived as intolerable) and subjective intensity and unpleasantness of each type of pain stimulus. Ischemic, thermal heat and cold pressor pain tasks were administered in one of three orders, counterbalanced to ensure that equal numbers of women in each ethnic group were tested in each order: (1. Ischemic, Thermal, Cold; 2. Thermal, Cold, Ischemic; or 3. Cold, Ischemic, Thermal).
Ischemic pain procedure
The submaximal effort tourniquet procedure, described previously (Maixner et al. 1990), was used to occlude blood flow to the forearm in order to induce ischemic pain. This deprivation of blood flow to the forearm causes a gradually increasing deep, diffuse, dull aching muscle pain. A tourniquet BP cuff was placed on the subject’s arm above the elbow. The arm was supported and elevated vertically for 30 seconds to promote venous drainage. The cuff was then rapidly inflated to 200 mm Hg (Hokanson E20 Rapid Cuff Inflator), the arm was lowered to rest on a pillow on the arm of the chair, and subjects then completed 20 handgrip exercises on a handgrip dynamometer at 30% maximum force (determined at the start of the session) for two seconds duration each, with an inter-squeeze interval of two seconds, to hasten muscle ischemia. Prior to the task, subjects were given instructions to say the word ‘Pain’ when they first felt a sensation of pain (pain threshold), and to say the word ‘Stop’ when they were no longer willing or able to tolerate the pain (pain tolerance). Immediately after saying ‘Stop’ the subjects rated the attributes of pain intensity (0=No sensation, 100=The most intense sensation imaginable) and unpleasantness (0=Not bad at all, 100=The worst pain imaginable) using two Visual Analog Scales (VAS), and the cuff was immediately deflated. A maximum time limit of 20 minutes was imposed to prevent tissue damage. Time (seconds) to pain threshold and tolerance were recorded.
Hand cold pressor task
A container filled with ice and water, maintained at 4°C (~39°F), and employing a water circulator to prevent water from warming near the subject’s hand, was used. Subjects were instructed to immerse the hand to a line marked on the wrist, and to remain still. A maximum time limit of five minutes was imposed to prevent tissue damage. Time (seconds) to pain threshold and tolerance were recorded, and intensity and unpleasantness were assessed by VAS.
Thermal heat pain task
Thermal heat pain was created using a 1-cm diameter contact thermode, applied to the volar forearm. Threshold and tolerance were determined using an ascending method of limits, in which the diode temperature increased in 0.5°C increments every five seconds, starting from 41.5°C (~107°F) until it reached 53°C (~127°F) or until the subjects reached tolerance. The average of three series was calculated to determine thermal heat pain threshold and tolerance (degrees).
Physiological recording of blood pressure (BP)
The SunTech 4240 Exercise BP monitor (SunTech Medical, Inc., Raleigh, NC) was used to measure BP at predetermined intervals, using the auscultatory method.
Hormone and neuroendocrine assays
Plasma oxytocin (OT), norepinephrine (NE), ACTH, and beta-endorphin
The level of OT in ethylene diamine tetracetic acid (EDTA)-treated plasma (pg/mL) was determined by extraction and radioimmunoassay (RIA) using commercially available kits (Peninsula Laboratories, San Carlos, CA). The intra-assay coefficient of variance (CV) was 4.05% and inter-assay CV was 8.95%, sensitivity was approximately 0.5 pg, and cross-reactivity of the antibody with Arg8-vasopressin was <0.01%. The level of NE in heparin-treated plasma (pg/mL) was determined using high performance liquid chromatography (HPLC) with electrochemical detection. Intra- and inter-assay CV’s were less than 10%, and sensitivity was 25 pg/mL. Plasma ACTH was determined using RIA techniques (Nichols Institute Diagnostics). The sensitivity of this assay was 1 pg/mL, and the selectivity showed only 0–0.02% cross-reactivity with other steroid compounds. The level of beta-endorphin in EDTA plasma was determined following extraction by RIA (INCSTAR, Stillwater, Minnesota); intra- and inter-assay coefficients of variation were approximately 10 and 15%, respectively, and sensitivity was 3 pmol/L.
Serum concentrations of cortisol, estradiol and progesterone
These concentrations were determined by RIA techniques (ICN Biomedical, Inc.); sensitivity of 0.07 mcg/dL, and inter- and intra-assay coefficients of variation of less than 8%. The specificity of the progesterone and estradiol antiserums were very high (progesterone: 0.01–2.5% cross-reactivity with other steroid hormones; estradiol: 0.01–1.45% cross-reactivity with other steroid hormones, except for 6% cross-reactivity with estrone).
Questionnaires
Beck Depression Inventory
This 21-item self-report scale assesses cognitive, affective and somatic depressive symptoms that have occurred over the previous week. This scale measures depressed mood, is not used as a diagnostic tool to assess major depressive disorder (Beck and Beamesderfer 1974).
Spielberger State and Trait Anxiety Inventory (Spielberger and Syderman 1994)
This 40-item scale is designed to assess current (state) and chronic (trait) symptoms of anxiety including restlessness and tension.
Data reduction and analyses
Independent t-tests were used to determine ethnic differences (African American, White) in demographic and baseline characteristics, and in plasma OT. Repeated measures ANOVAs were used to compare pain measures (threshold, tolerance, unpleasantness and intensity) after TSST and REST, with Ethnicity as a two-level between-subjects factor. Paired t-tests, used to assess whether pain measures differed when pain was presented after TSST versus after REST, revealed no significant differences attributable to stress. Therefore, post-REST and post-TSST pain measures were averaged to create mean tolerance, threshold, intensity and unpleasantness values for each pain task, which were used in subsequent group mean comparisons and correlational analyses. Tolerance and threshold values were not comparable across tasks because the three pain tasks were of different duration, and recorded using a different metric for ischemic and cold pressor (seconds) versus thermal (degrees Celsius). For each pain task, Z-scores for tolerance and threshold values were computed using the formula: Zx =(X–(mean of X)/sdx) in order to compare group means across tasks. Mean threshold and tolerance Z-scores for each task are equal to 0 (zero) and each unit of change represents one standard deviation. Two separate repeated measures ANOVAs, with pain task as the three-level within-subject factor and Ethnicity as the two-level between-subjects factor were then computed to assess differences in threshold and tolerance across tasks for individuals, and to evaluate overall pain sensitivity differences by ethnicity. Square-root transformations of OT, NE, pain threshold and pain tolerance values were calculated to correct for non-normal distributions. The relationship of plasma OT and square-root transformed OT values with NE, cortisol, ACTH, beta-endorphin, estradiol and mean arterial BP was examined using Pearson Product Moment correlational analyses. Correlations with both square root-adjusted and unadjusted values are reported. We calculated hierarchical regression models, regressing square-root transformed pain tolerance on the linear combination of plasma NE and OT (sqrt transformed) levels. We then added ethnicity to the model (dummy coded) to determine its influence on the relationship of OT to pain tolerance. Prior data from the larger cohort (Mechlin et al. 2005) showed no association between pain sensitivity and obesity, indexed by body mass index (BMI), or BP, therefore we did not include these as covariates in the current analyses.
Results
Ethnic differences in demographic and baseline characteristics
As shown in Table 1, we observed no significant ethnic group differences in demographic or baseline characteristics that might influence pain sensitivity, neuroendocrine, or cardiovascular responses. Group differences were not observed in age, BP, depressed mood, state anxiety, trait anxiety, serum estradiol, cortisol, and ACTH, or plasma beta-endorphin and NE concentrations; however, African Americans exhibited marginally greater BMI compared with Whites.
Table 1.
Mean (±SEM) demographic and baseline characteristics by ethnicity.
| African American (n=25) | Non-hispanic white (n=23) | |
|---|---|---|
| Age (years) | 27.40 (1.2) | 27.40 (1.3) |
| BMIa (kg/m2) | 28.47 (1.5) | 25.05 (1.1) |
| Beta-endorphin (pg/mL) | 7.09 (1.0) | 7.17 (1.1) |
| Norepinephrine (pg/mL) | 182.30 (13.7) | 169.90 (14.6) |
| Cortisol (mcg/dL) | 6.64 (0.4) | 6.99 (0.4) |
| ACTH | 19.81 (1.5) | 20.17 (1.7) |
| Estradiol (ng/mL) | 47.12 (5.4) | 43.11 (5.7) |
| SBP (mm Hg) | 113.04 (2.0) | 108.18 (2.1) |
| DBP (mm Hg) | 65.64 (1.7) | 62.09 (1.5) |
| MAP (mm Hg) | 81.40 (1.7) | 77.40 (1.6) |
| Beck Depression | 3.60 (0.6) | 2.90 (0.7) |
| Spielberger State Anxiety | 25.6 (1.1) | 28.90 (1.2) |
| Spielberger Trait Anxiety | 31.8 (1.3) | 32.90 (1.3) |
| Caffeine (none/>3C per day) | 50%/29% | 50%/26% |
| Alcohol (0–2/6–10 drinks per week) | 79%/4% | 78%/13% |
| Educationb (lesser than four-year college degree/greater than or equal to four-year college degree) | 42%/58% | 17%/83% |
| Mean annual household Income | $38,750 ($5280) | $31,196 ($4775) |
| Mean per capita income | $20,160 ($2707) | $19,203 ($1990) |
BMI, body mass index, t=1.86, p=0.07;
ACTH, adrenocorticotropin hormone; SBP, systolic blood pressure; DBP, diastolic blood pressure; MAP, mean arterial pressure; Beck Depression, Beck Depression Inventory total score.
Education level: Chi-square=7.44, p=0.06.
Ethnic groups also did not differ in consumption patterns of caffeine or alcohol. All subjects were non-smokers and none were taking oral contraceptives. All subjects reported educational achievement greater than high school level; however, a marginal ethnic group difference was observed (Chi-square=7.43, df=(1,3), p= 0.06) with 83% of Non-Hispanic Whites compared with 58% of African Americans reporting at least a four-year college education. This did not translate to differences in mean annual household income (AA: $38,750; W: $31,196), or in per capita income, calculated as the household income divided by the number of people living on that income (AA: $20,160; W: $19,203).
Ethnic differences in pain tolerance
Figure 1 shows ethnic differences in untransformed values for threshold and tolerance of cold pressor, ischemic, and thermal pain after rest and stress (TSST). Consistent with other reports, African Americans and Whites did not differ in pain threshold for any pain task. However, African American women did demonstrate significantly lower pain tolerance to hand cold pressor pain (F(1, 46)=5.03, p=0.0298) and marginally lower tolerance to ischemic pain (F(1, 46)=3.44, p= 0.07) compared with non-Hispanic Whites. No ethnic differences in tolerance to thermal heat pain were observed. Figure 1 also shows that pain tolerances and pain thresholds were not significantly different after rest compared with after stress, and thus no evidence of stress-induced analgesia for African Americans or Whites was observed. Post-stress and post-rest pain scores were therefore averaged to create mean scores for subsequent analyses.
Figure 1.

Ethnic differences in mean pain threshold and tolerance time in seconds (Mean± SEM) during cold pressor, ischemic, and thermal heat pain tasks.
When standardized pain tolerance (Z) scores were compared across the three pain tasks, a significant ethnic difference in overall pain tolerance across the three different tasks was observed (repeated measures between-subjects effect of Ethnicity: F1, 46 =6.31, p=0.0156). Figure 2 shows significantly lower pain tolerance in African American women than non-Hispanic Whites across all three pain tasks, where mean task tolerance is defined as 0, and each increment of 1 represents a standard deviation above or below the task mean across all subjects.
Figure 2.

Ethnic differences in mean (Mean±SEM) pain tolerance averaged across post-rest and post-stress periods, expressed as Z-scores, for cold pressor, ischemic, and thermal pain tasks. Mean tolerance score=0, 1 unit=1 standard deviation. Repeated measures ethnicity effect: F1, 46 =6.31, p=0.0156.
No significant ethnic differences were observed for perceived unpleasantness or intensity of any tasks.
Ethnic difference in oxytocin (OT) concentration
African American women had significantly lower baseline plasma OT concentrations than non-Hispanic White women, using both raw (AA: 3.90±0.55, W: 7.05±0.85 pg/mL; p=0.0028) and square-root transformed (AA: 1.84±0.15, W: 2.56±0.15 pg/ mL; p=0.0014) values. Figure 3 shows untransformed OT concentrations by ethnic group. In a subset of 24 subjects in which OT was assessed after TSST stress, levels of OT were also lower in African American compared with Whites using both raw (AA: 3.85±0.69, W: 6.56±0.49 pg/mL; p=0.0037) and square-root transformed (AA: 1.86±0.18, W: 2.54±0.10 pg/mL; p=0.0033) values.
Figure 3.
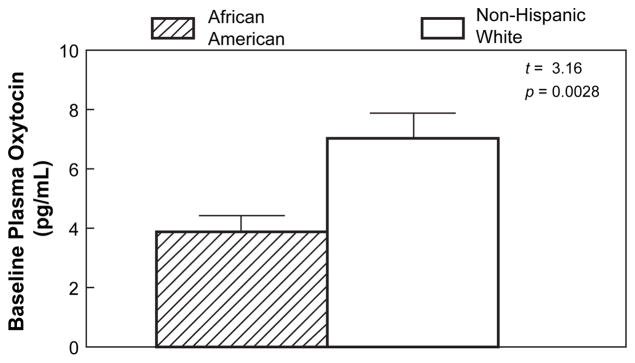
Ethnic differences in mean (Mean±SEM) plasma oxytocin concentration (pg/mL) at baseline; Student’s t-test=3.16, p=0.0028.
Relationships of oxytocin (OT) to other biological measures
Table 2 shows correlations of plasma OT with other factors known to influence pain sensitivity. Across the full sample, higher OT levels were marginally associated with higher plasma NE and higher beta-endorphin concentrations (ps<0.10). Similar associations were revealed when correlations were done separately by ethnic group, although substantially lower power was present to test significance in these smaller groups. In African Americans only, higher OT concentrations were significantly correlated with lower systolic BP (r=−0.40, p<0.05). In a sub-sample of participants (12 AA, 12 W), OT was also measured after the TSST stressor. In this smaller group of 24 subjects, higher OT levels at baseline were significantly and strongly correlated with higher OT levels after stress.
Table 2.
Bivariate Pearson correlations (r) of baseline plasma oxytocin with other biological values.
| All | African American | Non-Hispanic White | |
|---|---|---|---|
|
| |||
| r | |||
| Norepinephrine | −0.25# | −0.23 | −0.23 |
| Beta-endorphin | +0.28# | +0.36# | +0.31 |
| Cortisol | −0.11 | −0.14 | −0.19 |
| ACTH | +0.04 | +0.09 | −0.03 |
| SBP | −0.23 | −0.40* | +0.16 |
| DBP | −0.19 | −0.23 | +0.07 |
| MAP | −0.22 | −0.33 | +0.12 |
| Estradiol | +0.04 | +0.18 | −0.04 |
| Progesterone | +0.06 | +0.22 | +0.08 |
| Stress oxytocina | +0.88**** | +0.85*** | +0.79** |
Note:
p<0.10;
p<0.05;
p<0.01;
p<0.001;
p<0.0001;
ACTH, adrenocorticotropin hormone; SBP, systolic blood pressure; DBP, diastolic blood pressure; MAP, mean arterial pressure.
Correlation of baseline and stress oxytocin measured in 12 AA and 12 W participants; AA=25, W=23 for all other correlations.
Significant correlations (p<.05) in bold-face type.
As higher NE has been linked to reduced pain sensitivity (Kuraishi et al. 1985, West et al. 1993, Girdler et al. 2005), and to lower OT concentrations (Grewen et al. 2005), subsequent analyses examining the relationship of OT to pain sensitivity are reported with and without adjustment for baseline NE concentrations.
Relationships of oxytocin (OT), pain tolerance and pain threshold
Table 3 shows correlations between OT, pain tolerance and pain threshold ratings. Higher levels of plasma OT were associated with greater tolerance for cold pressor and ischemic pain, but were not linked to thermal pain tolerance or to pain thresholds for any pain modality. Cold pressor pain tolerance ratings were correlated with both untransformed (r=+0.30, p=0.04) and square-root transformed (r= +0.31, p=0.033) OT values. Ischemic pain tolerance ratings were correlated with both untransformed (r=+0.34, p=0.018) and square-root transformed plasma OT concentrations (r=+0.36, p=0.013).
Table 3.
Bivariate Pearson correlations between measures of pain threshold and tolerance with ratings of task unpleasantness and intensity and with plasma oxytocin concentration (N=48).
| Task unpleasantness | Pain intensity | Baseline oxytocin | |
|---|---|---|---|
|
| |||
| r | |||
| Cold pressor | |||
| Threshold | −0.14 | −0.28# | 0.00 |
| Tolerance | −0.32* | −0.26# | +0.31* |
| Ischemic pain | |||
| Threshold | −0.09 | −0.34* | 0.05 |
| Tolerance | −0.19 | −0.37* | +0.36* |
| Thermal heat | |||
| Threshold | 0.14 | 0.00 | −0.10 |
| Tolerance | 0.08 | 0.05 | 0.12 |
Note:
p<0.05;
p<0.10.
No associations between oxytocin and unpleasantness or intensity were present. Significant correlations (p<0.5) in bold.
Participants rating the cold pressor task as more unpleasant demonstrated lower tolerance (r=−0.32). Those rating cold pressor pain as more intense had marginally lower cold pain threshold (r=−0.28) and tolerance (r=−0.26). Those who rated ischemic pain as more intense demonstrated lower threshold (r=−0.34, p=0.02) and lower tolerance to ischemic pain (r=−0.37, p=0.01).
Separate multiple regressions were then calculated for cold, ischemic and thermal pain tolerance ratings regressed on the linear combination of NE and OT. Examination of standardized regression coefficients revealed that higher OT was a significant predictor of greater cold pressor tolerance (B=0.33, t=2.24, p=0.03) and ischemic pain tolerance (B=0.37, t=2.61, p=0.012) after adjusting for plasma NE. NE was not a significant predictor for cold, ischemic, or thermal pain tolerance.
The influence of ethnicity on relationships of oxytocin (OT) to pain tolerance
Using multiple regressions, pain tolerance ratings were then regressed on the linear combination of ethnicity and OT. Table 4 shows the results of these hierarchical regression models for cold and ischemic pain tolerance. For both pain tasks, pain tolerance was first regressed on OT alone (Step 1), then ethnicity alone (Step 2) and finally on ethnicity followed by OT (Step 3).
Table 4.
Hierarchical regressions of cold pressor and ischemic pain tolerance regressed on Ethnicity and oxytocin (OT) concentration.
| Full model
|
Ethnicity
|
Oxytocin
|
||||||||
|---|---|---|---|---|---|---|---|---|---|---|
| F | p | R2 | B | t | p | B | t | p | ||
| Cold pressor tolerance | ||||||||||
| Step 1 | OT | 4.83 | 0.033 | 0.10 | +0.31 | 2.20 | 0.033 | |||
| Step 2 | Ethnicity | 8.50 | 0.005 | 0.16 | −0.40 | −2.91 | 0.005 | |||
| Step 3 | Ethnicity, OT | 4.85 | 0.012 | 0.18 | −0.32 | −2.12 | 0.039 | +0.16 | 1.09 | 0.28 |
| Step 4 | Ethnicity, OT, outliers removeda | 5.49 | 0.008 | 0.20 | −0.41 | −2.73 | 0.04 | +0.08 | 0.55 | 0.59 |
| Ischemic pain tolerance | ||||||||||
| Step 1 | OT | 6.69 | 0.013 | 0.13 | +0.36 | 2.59 | 0.013 | |||
| Step 2 | Ethnicity | 3.67 | 0.062 | 0.07 | −0.27 | −1.92 | 0.06 | |||
| Step 3 | Ethnicity, OT | 3.74 | 0.031 | 0.14 | −0.14 | −0.91 | 0.37 | +0.29 | 1.90 | 0.064 |
Outliers=2 High OT, high tolerance White participants.
Significant values in bold. Ethnicity coded: AA=1, W=0.
Cold pressor tolerance
Ethnicity alone was significantly predictive of cold pressor tolerance (B=−0.40, p=0.005). Higher OT, when entered alone, also significantly predicted greater cold pressor tolerance (B=+0.31). However, with Ethnicity already in the model, the addition of OT concentration did not result in the consequential reduction of the predictive strength of ethnicity (B=−0.32, p=0.039), and OT was no longer predictive of cold tolerance, independent of ethnicity (B=+0.16, t=1.09, p=0.28). This model accounted for 18% of the variance in cold pressor tolerance (F=4.85, p=0.01). Examination of Figure 4 reveals that the association of cold pressor tolerance to OT concentration is driven primarily by two ‘high tolerance/high OT’ white subjects. When these subjects are excluded from the analyses (Step 4 in Table 4), Ethnicity remains predictive of cold pressor tolerance (B=−0.41) while the association between OT and tolerance is reduced even more (B=0.08, p=ns).
Figure 4.

Correlations (r) between plasma oxytocin (square-root transformed) and cold pressor pain tolerance (square-root transformed) displayed separately by ethnic group. African Americans: filled circles, non-Hispanic Whites: open circles.
Ischemic pain tolerance
Hierarchical regression revealed that a model inclusive of Ethnicity and OT concentration as predictors accounted for 14% of the variance in ischemic pain tolerance (F(1, 47)=3.74, p=0.031). Examination of standardized regression coefficients revealed that the marginally predictive strength of Ethnicity for ischemic pain tolerance when entered alone (B=−0.27, p=0.06) was reduced to non-significance when OT concentration was added to the model. Greater OT concentration, originally a significant predictor of greater ischemic tolerance (B= +0.36, p=0.013), remained marginally predictive (B=+0.29, p=0.064) when entered into the model with Ethnicity. Figure 5 shows the association of ischemic pain tolerance to OT concentration, separately by ethnic group.
Figure 5.

Correlations (r) between plasma oxytocin (square-root transformed) and ischemic pain tolerance (square-root transformed) displayed separately by ethnic group. African Americans: filled circles, non-Hispanic Whites: open circles.
Thermal pain tolerance
The linear combination of Ethnicity and OT was not predictive of thermal pain tolerance (F=1.37, p=0.26).
Discussion
The results from this study are the first, to our knowledge, to document a relationship between endogenous OT concentrations and sensitivity to experimental pain in humans. Pre-menopausal women with higher circulating OT levels during resting baseline demonstrated greater tolerance to subsequent ischemic pain and cold pressor pain. The association of OT to ischemic pain remained significant after adjusting for Ethnicity. This is consistent with existing data showing a link between lower OT levels and reports of greater clinical pain (Anderberg and Uvnas-Moberg 2000), as well as those showing an analgesic effect of exogenous OT administration (Madrazo et al. 1987, Yang et al. 2002, Ohlsson et al. 2005). Experimental ischemic pain is most similar to deep diffuse aching muscle pain characteristic of chronic pain disorders, including fibromyalgia, myofascial pain, and low back pain. Moreover, lower ischemic pain tolerance has been modestly correlated with greater clinical pain reporting in at least one study (Edwards et al. 2001b).
A second important and novel finding is that African American women demonstrated lower plasma OT compared with non-Hispanic Whites, making this the first report of which we are aware to describe ethnic differences in circulating OT levels. We found that African Americans differed not only in OT levels, but also in pain–response profile. African Americans demonstrated lower tolerance to ischemic, cold pressor, and thermal heat pain than their non-Hispanic White counterparts, replicating findings from other studies of ethnic differences in pain sensitivity in both men and women (Edwards and Fillingim 1999, Fillingim et al. 1999, Edwards et al. 2001b, Mechlin et al. 2005). Taken together, these data support the thesis that differences in OT may be one of multiple underlying biological mechanisms contributing to the observed ethnic differences in some types of clinical and experimental pain.
We also explored the relationship of OT to three biological markers which are known to influence pain sensitivity and which have also been associated with greater oxytocinergic activity: reduced NE and BP levels, and increased beta-endorphin levels. In the current report, higher NE concentrations were marginally correlated with lower OT concentrations, replicating our recent finding from a predominantly non-Hispanic White sample of pre-menopausal women, in which higher OT was correlated with lower NE at several time points across an experimental protocol (Grewen et al. 2005). As human and animal data show reduced pain sensitivity in the presence of higher NE (Sagen et al. 1991, Girdler et al. 2005), we were surprised to find that NE concentrations were not related to pain sensitivity in our sample. Although other research has linked both OT and catecholamine levels to reduced pain sensitivity, in the current investigation we found that only plasma OT was related to pain tolerance, and this effect was restricted to ischemic pain. These findings suggest independent mechanisms for the analgesic effects of OT and catecholamines.
Although other studies, including our own, have shown inverse relationships between OT and BP (Grewen et al. 2005, Light et al. 2005a), we observed this association only in African Americans. In addition, many studies report that African Americans have higher BP levels (Association 2002), differ in BP regulatory mechanisms (Girdler et al. 1993a, Light et al. 1993, Sherwood and Hinderliter 1993, Sherwood et al. 1995, Hinderliter et al. 1996), and do not appear to show the same relationships between higher BP and lower pain sensitivity (Mechlin et al. 2005) compared with Whites. However, in the current investigation we did not see higher BP in African Americans. This may be due to the limited range of BP levels in this young female sample of normotensive women, or to the fact that all were tested in the late follicular phase of the menstrual cycle, since cardiovascular function (Girdler et al. 1993b, Pfleeger et al. 1997), OT activity (Schumacher et al. 1989, Coirini et al. 1992, Schumacher et al. 1993, Salonia et al. 2005), and ischemic pain sensitivity (Fillingim et al. 1997) all vary as a function of female reproductive hormone variation.
Although the current study is strengthened by inclusion of assessment of cardiovascular, neuroendocrine, and pain variables across multiple pain modalities in a biracial sample, several limitations may reduce generalizability of our findings. First, it is important to note that all experimenters were non-Hispanic White, therefore we cannot rule out the possibility that ethnic differences in pain and neuroendocrine responses may have been influenced by differential responses to the experimenter, and/or to the nature of the social stressor. In a similar protocol, Edwards found no significant effects of experimenter gender or ethnicity on experimental thermal pain sensitivity (Edwards and Fillingim 1999); however, others suggest that between- and within-ethnic group cultural differences may indeed influence responses (Zatzick and Dimsdale 1990). In the current study, we found that greater pain sensitivity in African Americans was similarly present regardless of whether pain testing occurred after stress or after rest. However, it is possible that subjects’ knowledge of an impending public speaking task may have induced greater stress responses in the African Americans compared with Whites, even influencing the baseline and post-rest values. Examination of physiological indices of stress level revealed that plasma NE, epinephrine, and mean arterial BP did not differ by ethnicity at baseline, during the speech or mental arithmetic stressors. Thus, any bias in stress responses introduced by experimenter ethnicity was limited to OT levels and pain tolerance values. Nevertheless, future investigations should be designed with an ethnically diverse group of experimenters reflective of sample ethnicities in order to control for this potential confound. Second, in this preliminary exploration, we did not measure OT during pain tasks or during stress, but instead related resting OT levels, taken at the end of the first baseline period, to pain responses taken later in the protocol. Future studies would benefit from additional assessments of OT during pain tasks, in order to assess associations between OT responsivity and tolerance across different pain tasks. Third, we assessed OT levels in peripheral venous blood and cannot be certain that this reflects OT levels at central sites in brain and/or spinal cord where pain sensitivity is most likely modulated. However, at least one clinical study has related plasma OT levels to clinical pain (Anderberg and Uvnas-Moberg 2000), and even though central and peripheral OT release may occur independently, physiologic events such as lactation, parturition, and mating induce similar OT release in both brain and periphery (Kendrick et al. 1986, Da Costa et al. 1996), suggesting that levels and changes in plasma OT are correlated with, if not equivalent to, central levels. Fourth, because our sample was restricted to pre-menopausal women, we cannot infer that ethnic differences in OT levels, or links between OT and pain tolerance will be observed in men, post-menopausal women, or in clinical populations. Finally, it must be emphasized that the observed relationship between OT and pain tolerance is correlational, and thus a cause–effect role for OT on pain sensitivity remains hypothetical in humans.
In summary, our findings suggest that reduced oxytocinergic function may be one of multiple factors underlying the greater sensitivity to ischemic experimental pain and the greater burden of some types of clinical pain experienced by African Americans compared with Whites; however, replication in larger samples is needed to strengthen confidence in this conclusion. This study is the first to report ethnic differences in plasma OT concentrations, documenting lower levels in African American women compared with Whites, and is also the first to show association between lesser OT levels and greater sensitivity to experimental pain tolerance in humans. To the extent that OT is stress-sensitive in humans, as it is in animal models (Dreiling et al. 1991, Jezova et al. 1995), we speculate that lower OT levels and decreased pain tolerance observed in African American women may reflect the long-term effects of physiological responses to psychosocial stress, consistent with an allostatic load model (McEwen 1998). Moreover, because sensitivity to experimental pain has been shown to be predictive of more clinical pain reporting (Fillingim et al. 1996) and because African Americans experience more chronic pain (Edwards et al. 2001b, McCracken et al. 2001, Riley et al. 2002) and report more pain associated with chronic medical conditions (Edwards et al. 2001a), further exploration of the role played by OT in ethnic differences in endogenous pain regulation appears warranted. Future studies designed to examine relationships involving OT, psychosocial stress, and pain sensitivity in multi-ethnic samples, and in samples inclusive of men, as well as peri- and post-menopausal women, are indicated.
References
- Agren G, Uvnas-Moberg K, Lundeberg T. Olfactory cues from an oxytocin-injected male rat can induce anti-nociception in its cagemates. Neuroreport. 1997;8(14):3073–3076. doi: 10.1097/00001756-199709290-00013. [DOI] [PubMed] [Google Scholar]
- al’Absi M, Petersen KL. Blood pressure but not cortisol mediates stress effects on subsequent pain perception in healthy men and women. Pain. 2003;106(3):285–295. doi: 10.1016/S0304-3959(03)00300-2. [DOI] [PubMed] [Google Scholar]
- al’Absi M, Petersen KL, Wittmers LE. Adrenocortical and hemodynamic predictors of pain perception in men and women. Pain. 2002;96(1–2):197–204. doi: 10.1016/s0304-3959(01)00447-x. [DOI] [PubMed] [Google Scholar]
- Alfven G, de la Torre B, Uvnas-Moberg K. Depressed concentrations of oxytocin and cortisol in children with recurrent abdominal pain of non-organic origin. Acta Paediatrica. 1994;83(10):1076–1080. doi: 10.1111/j.1651-2227.1994.tb12989.x. [DOI] [PubMed] [Google Scholar]
- Anderberg UM, Uvnas-Moberg K. Plasma oxytocin levels in female fibromyalgia syndrome patients. Zeitschrift fur Rheumatologie. 2000;59(6):373–379. doi: 10.1007/s003930070045. [DOI] [PubMed] [Google Scholar]
- American Heart Association. 2002 Heart and Stroke Statistical Update. Dallas, TX: 2002. [Google Scholar]
- Beck A, Beamesderfer A. Assessment of depression: the depression inventory. In: Pichot P, editor. Psychological Measurements in psychopharmacology: Modern problems in pharmacopsychiatry. Basel, Paris: Karger; 1974. pp. 151–169. [Google Scholar]
- Breitbart W, McDonald M, Rosenfeld B, Passik S, Hewitt D, Thaler H, Portenoy R. Pain in ambulatory AIDS patients, I. Pain characteristics and medical correlates. Pain. 1996;68:315–321. doi: 10.1016/s0304-3959(96)03215-0. [DOI] [PubMed] [Google Scholar]
- Campbell C, Edwards R, Fillingim R. Ethnic differences in responses to multiple experimental pain stimuli. Pain. 2005;113:20–26. doi: 10.1016/j.pain.2004.08.013. [DOI] [PubMed] [Google Scholar]
- Carter CS. Neuroendocrine perspectives on social attachment and love. Psychoneuroendocrinology. 1998;23(8):779–818. doi: 10.1016/s0306-4530(98)00055-9. [DOI] [PubMed] [Google Scholar]
- Carter CS, Williams JR, Witt DM, Insel TR. Oxytocin and social bonding. Annals of the New York Academy of Science. 1992;652:204–211. doi: 10.1111/j.1749-6632.1992.tb34356.x. [DOI] [PubMed] [Google Scholar]
- Coirini H, Johnson AE, Schumacher M, McEwen BS. Sex differences in the regulation of oxytocin receptors by ovarian steroids in the ventromedial hypothalamus of the rat. Neuroendocrinology. 1992;55(3):269–275. doi: 10.1159/000126125. [DOI] [PubMed] [Google Scholar]
- Condes-Lara M, Maie I, Dickenson A. Oxytocin actions on afferent evoked spinal cord neuronal activities in neuropathic but not in normal rats. Brain Research. 2005;1045:124–133. doi: 10.1016/j.brainres.2005.03.020. [DOI] [PubMed] [Google Scholar]
- Creamer P, Lethbridge-Cejku M, Hochber M. Determinants of pain severity in knee osteoarthritis: effect of demographic and psychosocial variables using 3 pain measures. Journal of Rheumatology. 1999;26:1785–1792. [PubMed] [Google Scholar]
- Da Costa AP, Guevara-Guzman RG, Ohkura S, Goode JA, Kendrick KM. The role of oxytocin release in the paraventricular nucleus in the control of maternal behaviour in the sheep. Neuroendocrinology. 1996;8:163–77. doi: 10.1046/j.1365-2826.1996.04411.x. [DOI] [PubMed] [Google Scholar]
- DeKloet E, Voorhuis D, Boschma Y, Elands J. Estradiol modulates density of putative oxytocin receptors in discrete rat brain regions. Neuroendocrinology. 1986;44:415–421. doi: 10.1159/000124680. [DOI] [PubMed] [Google Scholar]
- Dreiling CE, Carman FS, 3rd, Brown DE. Maternal endocrine and fetal metabolic responses to heat stress. Journal of Dairy Science. 1991;74(1):312–327. doi: 10.3168/jds.S0022-0302(91)78175-7. [DOI] [PubMed] [Google Scholar]
- Dworkin BR, Filewich RJ, Miller NE, Craigmyle N, Pickering TG. Baroreceptor activation reduces reactivity to noxious stimulation: implications for hypertension. Science. 1979;205(4412):1299–1301. doi: 10.1126/science.472749. [DOI] [PubMed] [Google Scholar]
- Edwards C, Fillingim R, Keefe F. Race, ethnicity and pain. Pain. 2001a;94:133–137. doi: 10.1016/S0304-3959(01)00408-0. [DOI] [PubMed] [Google Scholar]
- Edwards R, Doleys D, Fillingim R, Lowery D. Ethnic differences in pain tolerance: clinical implications in a chronic pain population. Psychosomatic Medicine. 2001b;63(2):316–323. doi: 10.1097/00006842-200103000-00018. [DOI] [PubMed] [Google Scholar]
- Edwards RR, Fillingim RB. Ethnic differences in thermal pain responses. Psychosomatic Medicine. 1999;61(3):346–354. doi: 10.1097/00006842-199905000-00014. [DOI] [PubMed] [Google Scholar]
- Faucett J, Gordon N, Levine J. Differences in postoperative pain severity among four ethnic groups. Journal of Pain and Symptom Management. 1994;9:383–389. doi: 10.1016/0885-3924(94)90175-9. [DOI] [PubMed] [Google Scholar]
- Fillingim RB, Edwards RR, Powell T. The relationship of sex and clinical pain to experimental pain responses. Pain. 1999;83(3):419–425. doi: 10.1016/S0304-3959(99)00128-1. [DOI] [PubMed] [Google Scholar]
- Fillingim RB, Maixner W, Girdler SS, Light KC, Harris B, Sheps D, Mason G. Ischemic but not thermal pain sensitivity varies across the menstrual cycle. Psychosomatic Medicine. 1997;59:512–520. doi: 10.1097/00006842-199709000-00008. [DOI] [PubMed] [Google Scholar]
- Fillingim RB, Maixner W, Kincaid S, Sigurdsson A, Harris MB. Pain sensitivity in patients with temporomandibular disorders: relationship to clinical and psychosocial factors. Clinical Journal of Pain. 1996;12(4):260–269. doi: 10.1097/00002508-199612000-00005. [DOI] [PubMed] [Google Scholar]
- France C, Keefe F, Emery C, Affleck G, France J, Waters S, Caldwell D, Stainbrook D, Hackshaw K, Edwards C. Laboratory pain perception and clinical pain in post-menopausal women and age-matched men with osteoarthritis: relationship to pain coping and hormonal status. Pain. 2004;112:274–281. doi: 10.1016/j.pain.2004.09.007. [DOI] [PubMed] [Google Scholar]
- Gimpl G, Fahrenholz F. The oxytocin receptor system: structure, function, and regulation. Physiological Reviews. 2001;81(2):629–683. doi: 10.1152/physrev.2001.81.2.629. [DOI] [PubMed] [Google Scholar]
- Girdler SS, Hinderliter AL, Light KC. Peripheral adrenergic receptor contributions to cardiovascular reactivity: influence of race and gender. Journal of Psychosomatic Research. 1993a;37(2):177–193. doi: 10.1016/0022-3999(93)90085-t. [DOI] [PubMed] [Google Scholar]
- Girdler SS, Maixner W, Naftel HA, Stewart PW, Moretz RL, Light KC. Cigarette smoking, stress-induced analgesia and pain perception in men and women. Pain. 2005;114(3):372–385. doi: 10.1016/j.pain.2004.12.035. [DOI] [PubMed] [Google Scholar]
- Girdler SS, Pedersen CA, Stern RA, Light KC. Menstrual cycle and premenstrual syndrome: modifiers of cardiovascular reactivity in women. Health Psychology. 1993b;12(3):180–192. doi: 10.1037//0278-6133.12.3.180. [DOI] [PubMed] [Google Scholar]
- Goldman D, Maixner W. Contribution of genetic and psychological factors to experimental pain perception and temporomandibular disorder. Conference Presentaion, The International Association for Study of Pain; Sydney, Australia. 2005. pp. 1671–1674. [Google Scholar]
- Green C, Anderson K, Baker T, Campbell L, Decker S, Todd K, Vallerand A. The unequal burden of pain: confronting racial and ethnic disparities in pain. Pain Medicine. 2003;4:277–294. doi: 10.1046/j.1526-4637.2003.03034.x. [DOI] [PubMed] [Google Scholar]
- Grewen KM, Girdler SS, Amico J, Light KC. Effects of partner support on resting oxytocin, cortisol, norepinephrine, and blood pressure before and after warm partner contact. Psychosomatic Medicine. 2005;67(4):531–538. doi: 10.1097/01.psy.0000170341.88395.47. [DOI] [PubMed] [Google Scholar]
- Heinrichs M, Baumgartner T, Kirschbaum C, Ehlert U. Social support and oxytocin interact to suppress cortisol and subjective responses to psychosocial stress. Biological Psychiatry. 2003;54(12):1389–1398. doi: 10.1016/s0006-3223(03)00465-7. [DOI] [PubMed] [Google Scholar]
- Hinderliter AL, Sager AR, Sherwood A, Light KC, Girdler SS, Willis PWt. Ethnic differences in forearm vasodilator capacity. American Journal of Cardiology. 1996;78(2):208–211. doi: 10.1016/s0002-9149(96)90397-5. [DOI] [PubMed] [Google Scholar]
- Insel TR, Winslow JT, Wang ZX, Young L, Hulihan TJ. Oxytocin and the molecular basis of monogamy. Advances in Experimental Medicine and Biology. 1995;395:227–234. [PubMed] [Google Scholar]
- Insel TR, Young LJ. The neurobiology of attachment. National Reviews Neuroscience. 2001;2(2):129–136. doi: 10.1038/35053579. [DOI] [PubMed] [Google Scholar]
- Jessell T, Kelly D. Pain and Analgesia. In: Kandel E, Schwartz J, Jessell T, editors. Principles of Neural Science. New York: Elsevier Science Publishing Co, Inc; 1991. pp. 397–398. [Google Scholar]
- Jezova D, Skultetyova I, Tokarev DI, Bakos P, Vigas M. Vasopressin and oxytocin in stress. Annals of the New York Academy of Science. 1995;771:192–203. doi: 10.1111/j.1749-6632.1995.tb44681.x. [DOI] [PubMed] [Google Scholar]
- Kendrick KM, Keverne EB, Baldwin BA, Sharman DF. Cerebrospinal fluid levels of acetylcholinesterase, monoamines and oxytocin during labour, parturition, vaginocervical stimulation, lamb separation and suckling in sheep. Neuroendocrinology. 1986;44:149–156. doi: 10.1159/000124638. [DOI] [PubMed] [Google Scholar]
- Kirschbaum C, Kudielka BM, Gaab J, Schommer NC, Hellhammer DH. Impact of gender, menstrual cycle phase, and oral contraceptives on the activity of the hypothalamus-pituitary-adrenal axis. Psychosomatic Medicine. 1999;61(2):154–162. doi: 10.1097/00006842-199903000-00006. [DOI] [PubMed] [Google Scholar]
- Kirschbaum C, Pirke KM, Hellhammer DH. The ‘Trier Social Stress Test’–a tool for investigating psychobiological stress responses in a laboratory setting. Neuropsychobiology. 1993;28(1–2):76–81. doi: 10.1159/000119004. [DOI] [PubMed] [Google Scholar]
- Kudielka BM, Buske-Kirschbaum A, Hellhammer DH, Kirschbaum C. HPA axis responses to laboratory psychosocial stress in healthy elderly adults, younger adults, and children: impact of age and gender. Psychoneuroendocrinology. 2004;29(1):83–98. doi: 10.1016/s0306-4530(02)00146-4. [DOI] [PubMed] [Google Scholar]
- Kuraishi Y, Hirota N, Satoh M, Takagi H. Antinociceptive effects of intrathecal opioids, noradrenaline and serotonin in rats: mechanical and thermal algesic tests. Brain Research. 1985;326(1):168–171. doi: 10.1016/0006-8993(85)91398-8. [DOI] [PubMed] [Google Scholar]
- Light KC, Grewen KM, Amico JA. More frequent partner hugs and higher oxytocin levels are linked to lower blood pressure and heart rate in premenopausal women. Biological Psychology. 2005a;69(1):5–21. doi: 10.1016/j.biopsycho.2004.11.002. [DOI] [PubMed] [Google Scholar]
- Light KC, Grewen KM, Amico JA, Brownley KA, West SG, Hinderliter AL, Girdler SS. Oxytocinergic activity is linked to lower blood pressure and vascular resistance during stress in postmenopausal women on estrogen replacement. Hormones Behaviour. 2005b;47(5):540–548. doi: 10.1016/j.yhbeh.2004.12.010. [DOI] [PubMed] [Google Scholar]
- Light KC, Turner JR, Hinderliter AL, Sherwood A. Race and gender comparisons: I. Hemodynamic responses to a series of stressors. Health Psychology. 1993;12(5):354–365. doi: 10.1037//0278-6133.12.5.354. [DOI] [PubMed] [Google Scholar]
- Lund I, Ge Y, Yu LC, Uvnas-Moberg K, Wang J, Yu C, Kurosawa M, Agren G, Rosen A, Lekman M, Lundeberg T. Repeated massage-like stimulation induces long-term effects on nociception: contribution of oxytocinergic mechanisms. European Journal of Neuroscience. 2002;16(2):330–338. doi: 10.1046/j.1460-9568.2002.02087.x. [DOI] [PubMed] [Google Scholar]
- Lundeberg T, Uvnas-Moberg K, Agren G, Bruzelius G. Anti-nociceptive effects of oxytocin in rats and mice. Neuroscience Letters. 1994;170(1):153–157. doi: 10.1016/0304-3940(94)90262-3. [DOI] [PubMed] [Google Scholar]
- Madrazo I, Franco-Bourland R, Leon-Meza V, Mena I. Intraventricular somatostatin-14, arginine vasopressin, and oxytocin: analgesic effect in a patient with intractable cancer pain. Applied Neurophysiology. 1987;50:427–431. doi: 10.1159/000100753. [DOI] [PubMed] [Google Scholar]
- Maixner W. Autonomic and somatosensory interactions: physiological and pathophysiological implications. Proceedings of the Finnish Dental Society. 1989;85(4–5):395–407. [PubMed] [Google Scholar]
- Maixner W, Gracely RH, Zuniga JR, Humphrey CB, Bloodworth GR. Cardiovascular and sensory responses to forearm ischemia and dynamic hand exercise. American Journal of Physiology. 1990;259(6 Pt 2):R1156–1163. doi: 10.1152/ajpregu.1990.259.6.R1156. [DOI] [PubMed] [Google Scholar]
- Maixner W, Touw KB, Brody MJ, Gebhart GF, Long JP. Factors influencing the altered pain perception in the spontaneously hypertensive rat. Brain Research. 1982;237(1):137–145. doi: 10.1016/0006-8993(82)90562-5. [DOI] [PubMed] [Google Scholar]
- McCracken L, Matthews A, Tang T, Cuba S. A comparison of Blacks and Whites seeking treatment for chronic pain. Clinical Journal of Pain. 2001;17:249–255. doi: 10.1097/00002508-200109000-00011. [DOI] [PubMed] [Google Scholar]
- McEwen BS. Stress, adaptation, and disease. Allostasis and allostatic load. Annals of the New York Academy of Science. 1998;840:33–44. doi: 10.1111/j.1749-6632.1998.tb09546.x. [DOI] [PubMed] [Google Scholar]
- Mechlin MB, Maixner W, Light KC, Fisher JM, Girdler SS. African Americans show alterations in endogenous pain regulatory mechanisms and reduced pain tolerance to experimental pain procedures. Psychosomatic Medicine. 2005;67(6):948–956. doi: 10.1097/01.psy.0000188466.14546.68. [DOI] [PubMed] [Google Scholar]
- Miller PF, Light KC, Bragdon EE, Ballenger MN, Herbst MC, Maixner W, Hinderliter AL, Atkinson SS, Koch GG, Sheps DS. Beta-endorphin response to exercise and mental stress in patients with ischemic heart disease. Journal of Psychosomatic Research. 1993;37(5):455–465. doi: 10.1016/0022-3999(93)90002-w. [DOI] [PubMed] [Google Scholar]
- Miranda-Cardenas Y, Rojas-Piloni G, Martinez-Lorenzana G, Rodriguez-Jimenez J, Lopez-Hidalgo M, Freund-Mercier M, Condes-Lara M. Oxytocin and electrical stimulation of the paraventricular hypothalamic nucleus produce antinociceptive effects that are reversed by an oxytocin antagonist. Pain. 2006;122:182–189. doi: 10.1016/j.pain.2006.01.029. [DOI] [PubMed] [Google Scholar]
- Ng B, Dimsdale JE, Rollnik J, Shapiro H. The effect of ethnicity on prescriptions for controlled analgesia for post-operative pain. Pain. 1996;66:9–12. doi: 10.1016/0304-3959(96)02955-7. [DOI] [PubMed] [Google Scholar]
- Ohlsson B, Truedsson M, Bengtsson M, Torstenson R, Sjolund K, Bjornsson E, Simren M. Effects of long-term treatment with oxytocin in chronic constipation; a double blind, placebo-controlled pilot trial. Neurogastroenterology Motility. 2005;17:697–704. doi: 10.1111/j.1365-2982.2005.00679.x. [DOI] [PubMed] [Google Scholar]
- Pedersen CA, Boccia ML. Oxytocin maintains as well as initiates female sexual behavior: effects of a highly selective oxytocin antagonist. Hormonal Behaviour. 2002;41(2):170–177. doi: 10.1006/hbeh.2001.1736. [DOI] [PubMed] [Google Scholar]
- Pedersen CA, Prange AJ., Jr Induction of maternal behavior in virgin rats after intracerebroventricular administration of oxytocin. Proceedings of National Academy of Science of the USA. 1979;76(12):6661–6665. doi: 10.1073/pnas.76.12.6661. [DOI] [PMC free article] [PubMed] [Google Scholar]
- Petersson M, Alster P, Lundeberg T, Uvnas-Moberg K. Oxytocin increases nociceptive thresholds in a long-term perspective in female and male rats. Neuroscience Letters. 1996;(212) doi: 10.1016/0304-3940(96)12773-7. [DOI] [PubMed] [Google Scholar]
- Petersson M, Lundeberg T, Uvnas-Moberg K. Short-term increase and long-term decrease of blood pressure in response to oxytocin-potentiating effect of female steroid hormones. Journal of Cardiovascular Pharmacology. 1999;33(1):102–108. doi: 10.1097/00005344-199901000-00015. [DOI] [PubMed] [Google Scholar]
- Petersson M, Wiberg U, Lundeberg T, Uvnas-Moberg K. Oxytocin decreases carrageenan induced inflammation in rats. Peptides. 2001;22(9):1479–1484. doi: 10.1016/s0196-9781(01)00469-7. [DOI] [PubMed] [Google Scholar]
- Pfleeger M, Straneva PA, Fillingim RB, Maixner W, Girdler SS. Menstrual cycle, blood pressure and ischemic pain sensitivity in women: a preliminary investigation. International Journal of Psychophysiology. 1997;27(2):161–166. doi: 10.1016/s0167-8760(97)00058-5. [DOI] [PubMed] [Google Scholar]
- Randich A, Maixner W. Interactions between cardiovascular and pain regulatory systems. Neuroscience Biobehavioral Reviews. 1984;8(3):343–367. doi: 10.1016/0149-7634(84)90057-5. [DOI] [PubMed] [Google Scholar]
- Randich A, Maixner W. The role of sinoaortic and cardiopulmonary baroreceptor reflex arcs in nociception and stress-induced analgesia. In: Kelly D, editor. Stress-Induced Analgesia. New York: New York Academy of Sciences; 1986. pp. 385–401. [DOI] [PubMed] [Google Scholar]
- Ren Y, Zou X, Fang L, Lin Q. Sympathetic modulation of activity in Adelta-and C-primary nociceptive afferents after intradermal injection of capsaicin in rats. Journal of Neurophysiology. 2005;93(1):365–377. doi: 10.1152/jn.00804.2004. [DOI] [PubMed] [Google Scholar]
- Richard P, Moos F, Freund-Mercier MJ. Central effects of oxytocin. Physiological Reviews. 1991;71(2):331–370. doi: 10.1152/physrev.1991.71.2.331. [DOI] [PubMed] [Google Scholar]
- Riley J, Gilbert G, Heft M. Race/ethnic differences in health care use for orofacial pain among older adults. Pain. 2002;100:119–130. doi: 10.1016/s0304-3959(02)00256-7. [DOI] [PubMed] [Google Scholar]
- Rohleder N, Schommer NC, Hellhammer DH, Engel R, Kirschbaum C. Sex differences in glucocorticoid sensitivity of proinflammatory cytokine production after psychosocial stress. Psychosomatic Medicine. 2001;63(6):966–972. doi: 10.1097/00006842-200111000-00016. [DOI] [PubMed] [Google Scholar]
- Rohleder N, Wolf JM, Piel M, Kirschbaum C. Impact of oral contraceptive use on glucocorticoid sensitivity of pro-inflammatory cytokine production after psychosocial stress. Psychoneuroendocrinology. 2003;28(3):261–273. doi: 10.1016/s0306-4530(02)00019-7. [DOI] [PubMed] [Google Scholar]
- Sagen J, Kemmler J, Wang H. Adrenal medullary transplants increase spinal cord cerebrospinal fluid catecholamine levels and reduce pain sensitivity. Journal of Neurochemistry. 1991;56:623–627. doi: 10.1111/j.1471-4159.1991.tb08195.x. [DOI] [PubMed] [Google Scholar]
- Salonia A, Nappi RE, Pontillo M, Daverio R, Smeraldi A, Briganti A, Fabbri F, Zanni G, Rigatti P, Montorsi F. Menstrual cycle-related changes in plasma oxytocin are relevant to normal sexual function in healthy women. Hormonal Behavior. 2005;47(2):164–169. doi: 10.1016/j.yhbeh.2004.10.002. [DOI] [PubMed] [Google Scholar]
- Sawchenko PE, Swanson LW. Immunohistochemical identification of neurons in the paraventricular nucleus of the hypothalamus that project to the medulla or to the spinal cord in the rat. Journal of Comparative Neurology. 1982;205(3):260–272. doi: 10.1002/cne.902050306. [DOI] [PubMed] [Google Scholar]
- Schommer NC, Hellhammer DH, Kirschbaum C. Dissociation between reactivity of the hypothalamus-pituitary-adrenal axis and the sympathetic-adrenal-medullary system to repeated psychosocial stress. Psychosomatic Medicine. 2003;65(3):450–460. doi: 10.1097/01.psy.0000035721.12441.17. [DOI] [PubMed] [Google Scholar]
- Schumacher M, Coirini H, Frankfurt M, McEwen BS. Localized actions of progesterone in hypothalamus involve oxytocin. Proceedings of the National Academy of Sciences of the USA. 1989;86(17):6798–6801. doi: 10.1073/pnas.86.17.6798. [DOI] [PMC free article] [PubMed] [Google Scholar]
- Schumacher M, Coirini H, Johnson AE, Flanagan LM, Frankfurt M, Pfaff DW, McEwen BS. The oxytocin receptor: a target for steroid hormones. Regulatory Peptides. 1993;45(1–2):115–119. doi: 10.1016/0167-0115(93)90192-b. [DOI] [PubMed] [Google Scholar]
- Sheffield D, Kirby D, Biles P, Sheps D. Comparison of perception of angina pectoris during exercise testing in African Americans versus Caucasians. American Journal of Cardiology. 1999;83:106–108. doi: 10.1016/s0002-9149(98)00790-5. [DOI] [PubMed] [Google Scholar]
- Sheps DS, Ballenger MN, De Gent GE, Krittayaphong R, Dittman E, Maixner W, McCartney W, Golden RN, Koch G, Light KC. Psychophysical responses to a speech stressor: correlation of plasma beta-endorphin levels at rest and after psychological stress with thermally measured pain threshold in patients with coronary artery disease. Journal of the American College of Cardiology. 1995;25(7):1499–1503. doi: 10.1016/0735-1097(95)00045-6. [DOI] [PubMed] [Google Scholar]
- Sheps DS, Bragdon EE, Gray TF, 3rd, Ballenger M, Usedom JE, Maixner W. Relation between systemic hypertension and pain perception. American Journal of Cardiology. 1992;70(16):3F–5F. doi: 10.1016/0002-9149(92)90181-w. [DOI] [PubMed] [Google Scholar]
- Sherwood A, Hinderliter AL. Responsiveness to alpha- and beta-adrenergic receptor agonists. Effects of race in borderline hypertensive compared to normotensive men. American Journal of Hypertension. 1993;6(7 Pt1):630–635. doi: 10.1093/ajh/6.7.630. [DOI] [PubMed] [Google Scholar]
- Sherwood A, May CW, Siegel WC, Blumenthal JA. Ethnic differences in hemodynamic responses to stress in hypertensive men and women. American Journal of Hypertension. 1995;8(6):552–557. doi: 10.1016/0895-7061(95)00036-O. [DOI] [PubMed] [Google Scholar]
- Sofroniew MV. Projections from vasopressin, oxytocin, and neurophysin neurons to neural targets in the rat and human. Journal of Histochemistry and Cytochemistry. 1980;28(5):475–478. doi: 10.1177/28.5.7381192. [DOI] [PubMed] [Google Scholar]
- Sofroniew MV, Weindl A, Schrell U, Wetzstein R. Immunohistochemistry of vasopressin, oxytocin and neurophysin in the hypothalamus and extrahypothalamic regions of the human and primate brain. Acta Histochemica Supplement. 1981;24:79–95. [PubMed] [Google Scholar]
- Spielberger C, Syderman S. State-trait anxiety inventory. In: Maruish M, editor. The use of psychological tests for treatment planning and outcome assessment. Hillsdale, NJ: LEA; 1994. pp. 291–321. [Google Scholar]
- Stewart W, Lipton R, Liberman J. Variation in migraine prevalence by race. Neurology. 1996;47:52–9. doi: 10.1212/wnl.47.1.52. [DOI] [PubMed] [Google Scholar]
- Todd K, Deaton C, D’Amato A, Goe L. Ethnicity and analgesic practive. Annals of Emergency Medicine. 2000;35:11–16. doi: 10.1016/s0196-0644(00)70099-0. [DOI] [PubMed] [Google Scholar]
- Todd K, Lee T, Hoffman J. The effect of ethnicity on physician estimates of pain severity in patients with isolated trauma. JAMA. 1994;271:925–928. [PubMed] [Google Scholar]
- Uvnas-Moberg K, Bruzelius G, Alster P, Bileviciute I, Lundeberg T. Oxytocin increases and a specific oxytocin antagonist decreases pain threshold in male rats. Acta Physiologica Scandinavica. 1992;144(4):487–488. doi: 10.1111/j.1748-1716.1992.tb09327.x. [DOI] [PubMed] [Google Scholar]
- Uvnas-Moberg K, Petersson M. Oxytocin, a mediator of anti-stress, well-being, social interaction, growth and healing. Zeitschrift fur psychosomatische medizin and psychotherapie. 2005;51(1):57–80. doi: 10.13109/zptm.2005.51.1.57. [DOI] [PubMed] [Google Scholar]
- West WL, Yeomans DC, Proudfit HK. The function of noradrenergic neurons in mediating antinociception induced by electrical stimulation of the locus coeruleus in two different sources of Sprague-Dawley rats. Brain Research. 1993;626(1–2):127–135. doi: 10.1016/0006-8993(93)90571-4. [DOI] [PubMed] [Google Scholar]
- Widmalm S, Gunn S, Christiansen R, Hawley L. Association between CMD signs and symptoms, oral parafunctions, race and sex, in 4–6 year-old African-American and Caucasian children. Journal of Oral Rehabilitation. 1995;22:95–100. doi: 10.1111/j.1365-2842.1995.tb00241.x. [DOI] [PubMed] [Google Scholar]
- Yang Z, Wheatley M, Coote J. Neuropeptides, amines and amino acids as mediators of the sympathetic effects of paraventricular nucleus activation in the rat. Experimental Physiology. 2002;87:6. doi: 10.1113/eph8702439. [DOI] [PubMed] [Google Scholar]
- Zatzick DF, Dimsdale JE. Cultural variations in response to painful stimuli. Psychosomatic Medicine. 1990;52(5):544–557. doi: 10.1097/00006842-199009000-00007. [DOI] [PubMed] [Google Scholar]