Abstract
The folding pathway of E. coli RNase H is one of the best experimentally characterized for any protein. In spite of this, spectroscopic studies have never captured the earliest events. Using continuous flow microfluidic mixing, we have now observed the first several milliseconds of folding by monitoring the tryptophan fluorescence lifetime (60 microsecond dead time). Two folding intermediates are observed, the second of which is the previously characterized Icore millisecond intermediate. The new, earlier intermediate is likely on-pathway and appears to have long-range non-native structure, providing a rare example of such non-native structure formation in a folding pathway. The tryptophan fluorescence lifetimes also suggest a deviation from native packing in the second intermediate, Icore. Similar results from a fragment of RNase H demonstrate that only half of the protein is significantly involved in this early structure formation. These studies give us a view of the formation of tertiary structure on the folding pathway, and complement previous hydrogen exchange studies which monitored only secondary structure and observed sequential native structure formation. Our results provide detailed folding information on both a timescale and a size-scale accessible to all-atom molecular dynamic simulations of protein folding.
Keywords: Protein folding, partially folded states, tryptophan fluorescence, continuous-flow mixing, sub-millisecond reaction
Graphical Abstracts
Introduction
What does a protein look like as it folds? What partially folded intermediates are populated on the way to reaching the native state? It is particularly difficult to answer these questions for the earliest stages of folding. Protein folding spans a wide range of timescales – some single-domain proteins fold to their native state in microseconds while others need several seconds – but for even the slower folders, many reach partially structured intermediate states within microseconds or milliseconds. These early structural events are important determinants of the overall reaction, and are critical for understanding protein-folding pathways, but are the hardest to observe directly.
While events on the microsecond-millisecond timescale are the hardest to observe experimentally, they are the events most accessible to detailed simulations of folding [1]. The improvement of folding simulations – important for our ability to predict protein dynamics and behavior from sequence – requires detailed experimental information for comparison and validation. Here, we use a microfluidic continuous flow mixer to observe the early folding of an important protein folding model system, E. coli RNase H, at a timescale – and size-scale – amenable to simulation.
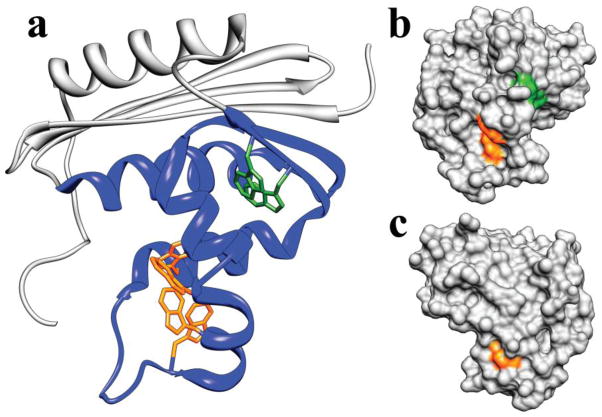
The folding of E. coli RNase H has been studied extensively; the protein is known to populate an obligate, on-pathway, partially folded intermediate within several milliseconds of folding, with subsequent folding to the native state occurring in seconds [2,3]. (All work on E. coli RNase H discussed here refers to a cysteine-free variant [4,5].) The intermediate, termed Icore, was initially characterized using pulse-labeling hydrogen exchange monitored by NMR [2] and mutational analysis [6], and found to contain native-like secondary structure in approximately half of the protein (Figure 1a). Although very well characterized, until recently, the folding to this intermediate had never been observed directly, as it occurs within the dead time of a standard stop-flow or quench-flow instrument.
Figure 1.
Structure of E. coli RNase H. a. Ribbon diagram. Helices are labeled with letters and β-strands with Roman numerals. The region that is structured in the Icore intermediate is colored blue. Tryptophan residues are shown in stick (in the 4Trp variant, the two green tryptophans are mutated to phenylalanine, leaving only the four orange tryptophans). b. Surface contour of the RNase H crystal structure in a very similar orientation as in panel a. Only the tryptophan side chains are colored, to highlight the solvent exposure of these side chains in the native state. c. Structure in B rotated 180 degrees about the vertical axis. W104 on helix D is the only completely buried tryptophan.
Recently, using pulse-labeling hydrogen exchange and a novel mass spectrometry technique (HX-MS), we identified two new early folding intermediates in addition to Icore [7]. (The experiment was conducted at 10°C instead of the 25°C conditions of previous experiments, slowing early folding events so they were accessible in a quench-flow instrument.) While this work provides detailed structural characterization of early folding events, it gives only a rough sense of the rates associated with these early steps, and provides no information about tertiary structure formation and its role during the early folding of RNase H.
In the present work, we use ultra-rapid continuous flow mixing to monitor RNase H folding spectroscopically from 60 microseconds to nine milliseconds [8], characterizing early folding kinetics with high temporal resolution. We use intrinsic tryptophan fluorescence to monitor the progress of the folding reaction, providing a window into tertiary structure formation. RNase H has six tryptophans, all within the structured portion of Icore (Figure 1).
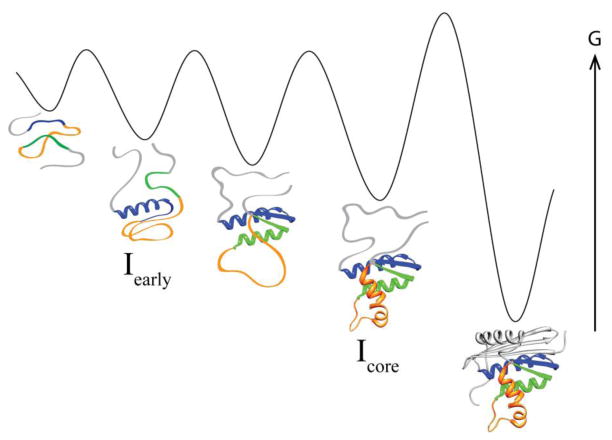
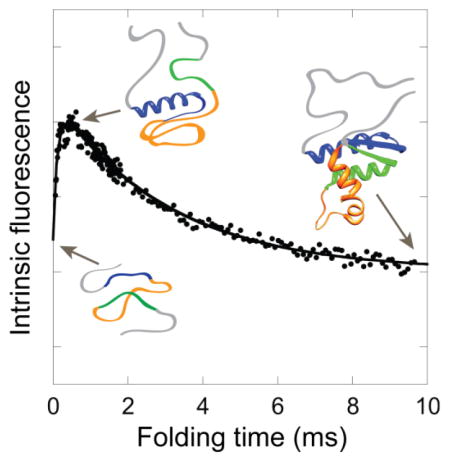
We observed two kinetic steps in the first few milliseconds of RNase H folding, revealing the formation of a new early intermediate (Iearly) in addition to the formation of Icore. Kinetic modeling, mutational analysis, and comparison with the HX-MS data [7] suggest that Iearly is an on-pathway intermediate containing some non-native structure. Using a fragment of RNase H [9], we confirm that only half the protein is significantly involved in these early folding steps. These results, together with the previous HX-MS data [7], provide a detailed model for the early folding of RNase H on both a timescale and size-scale amenable to comparison with atomistic folding simulations.
Results
Direct observation of two kinetic phases in the first nine milliseconds of folding
Folding of E. coli RNase H was initiated using a 6 M to 0.6 M urea concentration jump in a microsecond-resolved continuous flow (CF) mixing device with a 60 μs dead time. Folding was monitored by the change in average fluorescence lifetime of the tryptophans, determined using time-correlated single photon counting (TCSPC). Plotting the average lifetime versus folding time reveals two kinetic phases, clearly distinguishable by the opposite directions of their change in amplitude (Figure 2a, inset). The time constant of the second kinetic phase, however, is poorly determined in these experimental conditions where folding is only monitored out to one millisecond.
Figure 2.
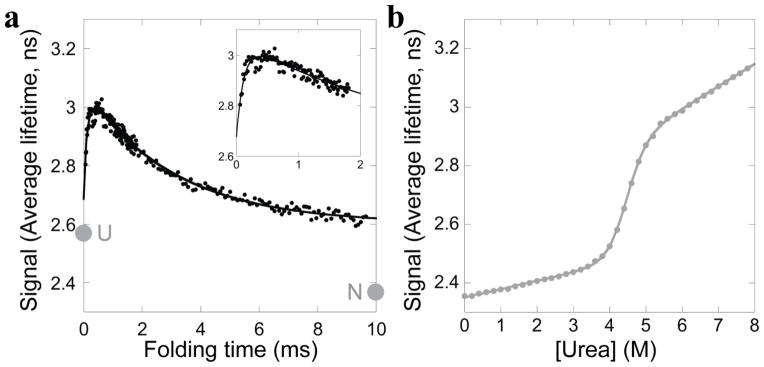
Wild type E. coli RNase H. a. Refolding into 0.6 M urea monitored by average fluorescence lifetime. For comparison, the extrapolated signal of the unfolded state (U) and the signal of the final equilibrium state (N) at this condition are indicated. Inset: Refolding monitored in just the fastest mixing device. b. Equilibrium urea denaturation monitored by average fluorescent lifetime. Data are fit with a two-state model.
In order to better resolve the second kinetic phase, we repeated the experiment using a larger CF mixing device that has an approximately one millisecond mixing time, with folding observed out to nine milliseconds. The second kinetic phase is well resolved in this time range. The data from both experiments were combined; a fit of the change in average fluorescence lifetime as a function of folding time (Figure 2a) yields time constants of 120 ± 20 μs and 3.1 ± 0.2 ms for the first and second kinetic phases, respectively. We are using the average fluorescence lifetime to evaluate the progression of the reaction (see Methods) but it should be noted that the opposite trend in amplitudes is observed when monitoring the total fluorescence intensity: the intensity decreases in the first few hundred microseconds and then rises over milliseconds (Figure S1).
Equilibrium unfolding monitored by average fluorescent lifetime
To determine the expected signal for the unfolded and native states (starting and end points), we carried out an equilibrium urea titration monitored by TCSPC (Figure 2b). The resulting cooperative unfolding transition, fit to a two-state model [10], agrees with previous work on RNase H [2], with a ΔGunf of 9.5 ± 0.4 kcal/mol, and an m-value of 2.13 ± 0.09 kcal/mol/Murea. The average fluorescence lifetime for the native state at 0.6 M urea is less than the final value observed at the end of our millisecond kinetics (2.36 ns vs. 2.60 ns). Extrapolation of the unfolded baseline back to 0.6 M urea results in an expected average fluorescence lifetime of 2.58 ns (the signal assumed for the unfolded state at the start of the kinetic experiment), while the amplitude of the observed kinetics extrapolated to zero time yields a fluorescence lifetime of 2.69 ns. These values are just outside of our error (error is approximately ± 0.05 ns, based on an error of 15 microseconds – one time step – for determining the zero time). The difference could be due to the inaccuracy of such a long extrapolation of the unfolded baseline, or could indicate that there is a very early small amplitude kinetic phase occurring within our 60 μs mixing time.
Urea dependence of the observed kinetics
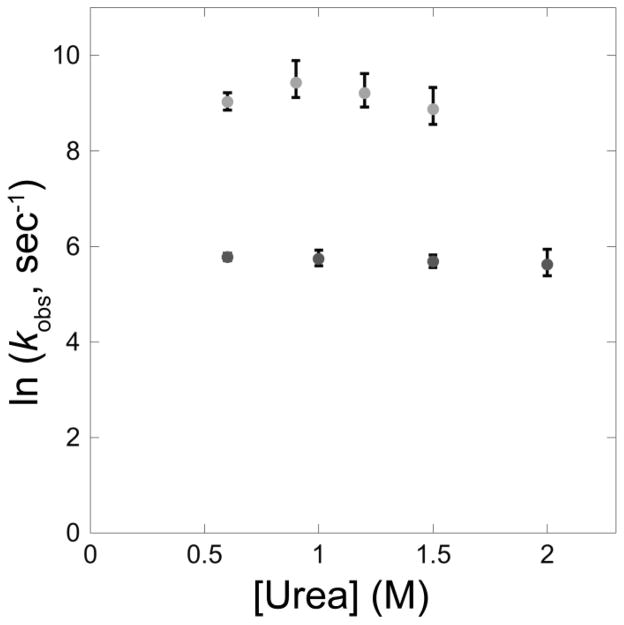
In an effort to obtain insights into the solvent accessible surface area of the transition state for the two early kinetic steps and to aid in the development of a kinetic model, we repeated the ultra-rapid mixing experiments as a function of denaturant concentration. The results are plotted in Figure 3 (raw data shown in Figure S2). The early folding steps are characterized by very low refolding m-values (denaturant dependence of the barriers), indicative of a transition state that is very unfolded like [11]. The unfolding leg of the chevron for these early steps, expected at > 2 M final urea concentration, was not resolved in these experiments because higher urea decreases the amplitude of both phases and also increases the pressure beyond the physical limits of the mixing devices.
Figure 3.
Urea dependence of wild type E. coli RNase H early folding kinetics. Refolding was monitored by average fluorescence lifetime at multiple final urea concentrations spanning the accessible range of the continuous flow mixing experiments. Error shown is the 95% confidence interval calculated using the standard deviation of the fits, which likely underestimates the true error.
The effect of the I53D mutation on early folding
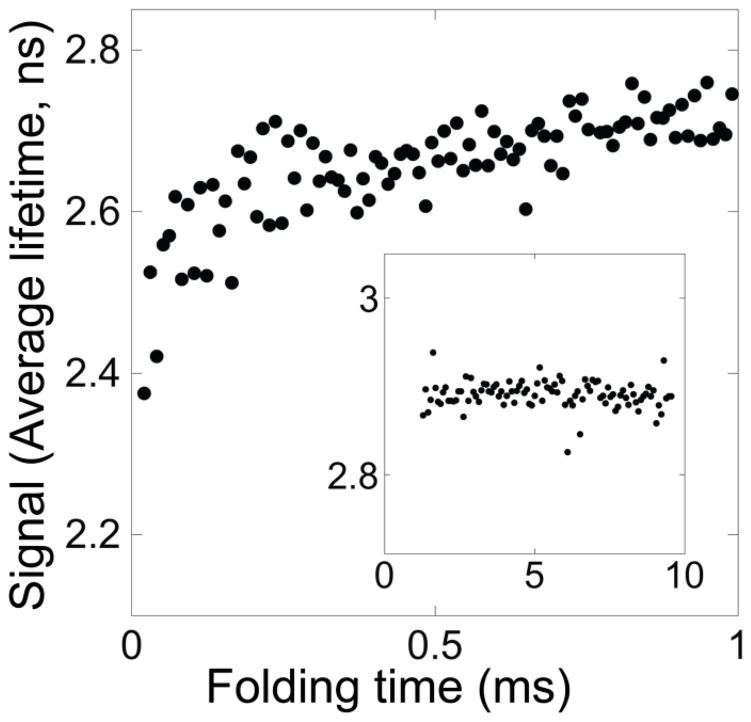
The single amino acid substitution I53D is known to destabilize the Icore intermediate such that folding monitored by stop-flow CD appears two-state (the Icore intermediate is never detectably populated) [12,13]. To test whether our CF mixing experiments monitor the formation of the Icore intermediate, we repeated the same rapid-mixing experiments with the I53D variant. No kinetics were observed in the slower mixer (Figure 4 – inset); however, we still observe a fast kinetic phase in the faster mixer (Figure 4). (Data from the two mixers are displayed separately since we cannot combine them without an overlapping kinetic process.) Overall, the I53D mutation abolishes the second kinetic phase observed in the wild-type experiments, indicating that the second phase is indeed formation of Icore.
Figure 4.
Early folding kinetics of the I53D variant. Refolding of I53D was performed in both mixing devices. A fast kinetic phase is observed in the fastest mixer, analogous to the fastest kinetic phase in the refolding of the wild type protein. Inset: No millisecond refolding kinetics are observed. There is no kinetic process overlapping between the two data sets so they cannot be combined.
Structural information from monitoring select tryptophans
To obtain further structural information about the two kinetic phases, we reduced the number of tryptophan reporters. We made conservative substitutions for two of the six tryptophans, W118F and W120F, creating a variant with just four tryptophans, all in one region of the protein (herein referred to as the 4Trp variant) (Figure 1).
Refolding of the 4Trp variant was monitored as previously (Figure 5a). The observed kinetics look qualitatively very similar to wild type, indicating that the remaining region of tryptophans (Trps 81, 85, 90 and 104) is the primary reporter on both kinetic phases observed in the wild-type experiments. Quantitatively, a global fit of the 4Trp data fits best to three phases rather than two phases (with time constants of 91 ± 2 μs, 300 ± 40 μs and 2.3 ± 0.2 ms, all with amplitudes of similar magnitude). The observation of three kinetic phases may indicate that the mutations have altered the early folding pathway, or may indicate that the wild-type protein also folds in three steps but one step is obscured by signal from the additional tryptophans.
Figure 5.
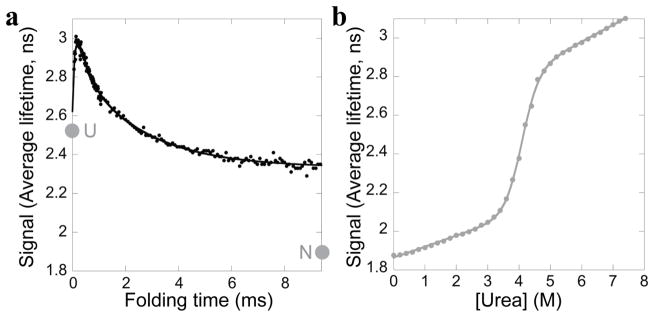
The 4Trp variant. a. Refolding into 0.6 M urea was monitored by average fluorescence lifetime. Two kinetic phases, similar to wild type, are observed. The extrapolated signal of the unfolded state (U) and the signal of the final equilibrium state (N) at this condition are indicated. b. Equilibrium urea denaturation monitored by average fluorescence lifetime. Data are fit with a two-state model.
An equilibrium urea titration with the 4Trp variant, monitored by average fluorescence lifetime (Figure 5b) can be fit to a two-state model, with a ΔGunf of 8.5 ± 0.3 kcal/mol and an m-value of 2.19 ± 0.08 kcal/mol/Murea, indicating that these mutations destabilize the native state by only 1 kcal/mol. Comparing fluorescence lifetimes between the equilibrium titration and the kinetic experiment indicates the starting point for refolding and the extrapolated equilibrium unfolded state are just outside of error from each other, as seen for WT (2.63 ns vs. 2.53 ns). The comparison also suggests that the region containing the remaining four tryptophans is not natively folded in the Icore intermediate: the final fluorescent lifetime of the millisecond kinetics is 2.34 ns while the fluorescent lifetime of the 4Trp native state in 0.6 M urea is 1.90 ns.
Structural information from a truncation mutant
The current model of the Icore folding intermediate does not involve any structure in the region encompassing native-state strands I–III and helix E (Figure 1a) [2,6,7,14]. Since there are no tryptophans in this region of the protein, our kinetic experiments do not report on its role in the early folding pathway. However, we recently made a fragment of RNase H with the I–III/E regions removed [9]. This fragment folds and serves as a mimic of Icore. Therefore, we carried out the CF folding experiment with this fragment and compared the results to wild type to determine whether the I–III/E regions impact the early folding pathway.
The first nine milliseconds of the folding of the fragment were monitored using a 5 M to 0.5 M urea concentration jump in both mixers (Figure 6a). Qualitatively, the kinetics are very similar to that observed in the wild-type protein: two kinetic phases with similar amplitude changes. When the data are fit together to a two-exponential model, the time constants for the two phases are 80 ± 10 μs and 1.11 ± 0.06 ms, slightly faster than observed for wild type (even when an extrapolation to 0.5 M is considered). These observations fit with a model where the I–III/E regions of the protein play only a minor role in slowing the early events in the refolding of full-length protein.
Figure 6.
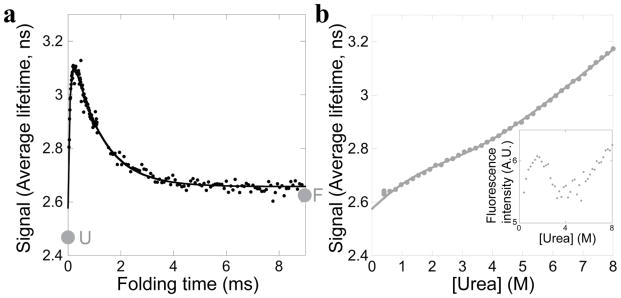
The Icore fragment. a. The fragment refolding into 0.5 M urea was monitored by average fluorescence lifetime. The extrapolated signal of the unfolded state (U) and the final equilibrium state (F) at these conditions are indicated. b. Equilibrium urea denaturation of the fragment monitored by average fluorescence lifetime, fit to a two-state model by performing a global fit with the total fluorescence intensity data (inset).
The equilibrium urea denaturation of the fragment (Figure 6b) reveals a steep dependence on urea concentration in the folded and unfolded baselines, making it difficult to fit these data to a model. Globally fitting the average fluorescence lifetime together with total fluorescence intensity (Figure 6b – inset) to a two-state model yields a stability of 1.0 ± 1.0 kcal/mol and an m-value of 0.5 ± 0.2 kcal/mol/Murea; however, improvements in χ2 using a three-state model hint that the fragment may populate an intermediate during equilibrium unfolding. Three-state equilibrium unfolding by fluorescence would explain why the stability and m-value determined here using a two-state model are lower than previously determined using CD data fit to a two-state model (stability of 3.0 ± 0.3 kcal/mol and m-value of 1.16 ± 0.05 kcal/mol/Murea) [9]. Nevertheless, the equilibrium average lifetime data are useful to compare to the kinetic amplitudes. The final amplitude of the fluorescent lifetime in the kinetic experiment (2.66 ns) is very similar to the equilibrium fluorescent lifetime of the fragment at 0.5 M urea (2.62 ns), suggesting that the fragment folds to its equilibrium conformation within the time window of our experiment. The kinetic starting point and the extrapolated equilibrium unfolded state are again just outside of error from each other (2.58 ns vs. 2.47 ns).
Fitting a kinetic model
The observation of two kinetic phases indicates folding to an early intermediate (which we now term Iearly) in addition to the formation of Icore. Icore is known to be an obligate and on-pathway intermediate [3]. There are three ways to incorporate Iearly into this folding pathway without invoking any unjustified complexity: Iearly is on-pathway to Icore (Model 1), Iearly is off-pathway from the unfolded state (Model 2), or Iearly is off-pathway from Icore (Model 3). These three models are depicted below.
| Model 1 |
| Model 2 |
| Model 3 |
Results for the I53D variant allow us to discount Model 3. The I53D variant populates the intermediate with the long fluorescence lifetime (Iearly) on a 100-μs timescale without build-up of Icore intermediate (Figure 4). This result is only compatible with Model 3 if I53D Icore forms on this 100-μs timescale and Iearly formation occurs even faster. By comparison to WT, this would require that one or both early folding steps were significantly sped up by the destabilizing I53D mutation – a very unlikely scenario. In contrast, Models 1 and 2 both allow for the I53D mutation to significantly slow down the formation of Icore, which is much more probable.
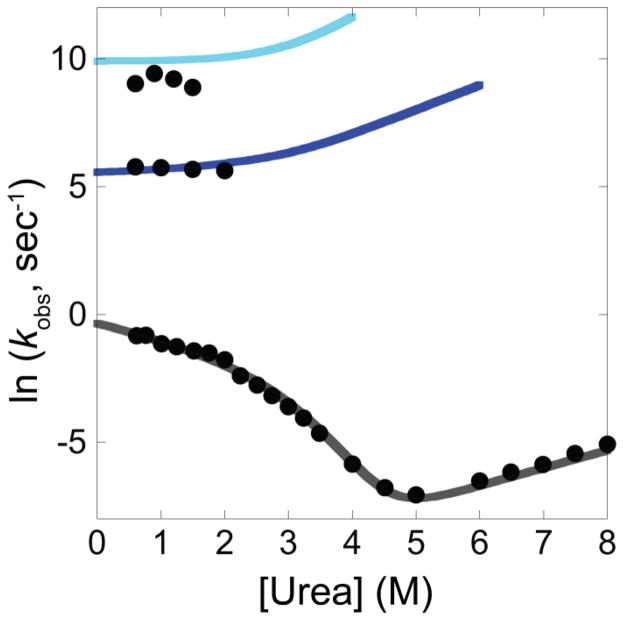
We performed global fits of the data based on Models 1 and 2 to determine how consistent these models are with our measurements, and to determine possible values for the microscopic rate constants at each kinetic step. Models were fit simultaneously to the raw data from the continuous-flow and equilibrium experiments (Figures S2 and 2b). To constrain the fits to be consistent with previous stopped-flow and manual mixing results, kinetic traces for refolding and unfolding to/from the native state were simulated according to the parameters in Raschke and Marqusee [2] and included with appropriate weighting in the global chevron analysis (see Methods).
The on-pathway model (Model 1) reasonably fits the raw kinetic data, rate constants and amplitudes from the kinetic experiments and reproduces the equilibrium thermodynamics (Figures 7, S2, S3, and Table 1). The deviations between the fit and the data are of a reasonable magnitude considering the number of simultaneous data sets being considered, and the small difference in temperature between previous and present experiments (the continuous-flow experiments were performed at 21 °C while the experiments in Raschke and Marqusee [2] were performed at 25 °C).
Figure 7.
The on-pathway kinetic model. Comparison between results from the global fit and the observed rate constants from the present continuous-flow mixing experiments and previous folding and unfolding experiments to/from the native state [2].
Table 1.
Parameters from the global fit to Model 1
| Global Fit Parameters* | Previously Published [2] | |
|---|---|---|
| k1 (sec−1) | 20,000 ± 3,000 | n.a. |
| k−1 (sec−1) | 130 ± 150 | n.a. |
| k2 (sec−1) | 240 ± 80 | n.a. |
| k−2 (sec−1) | 24 ± 20 | n.a. |
| k3 (sec−1) | 0.78 ± 0.11 | 0.74 ± 0.02 |
| k−3 (sec−1) | 1.9 × 10⁻⁵ ± 0.1 × 10⁻⁴ | 1.69 × 10⁻⁵ ± 0.04 × 10⁻⁵ |
| m1 (kcal mol−1 M−1) | 0.0 | n.a. |
| m−1 (kcal mol−1 M−1) | −0.97 | n.a. |
| m2 (kcal mol−1 M−1) | 0.0 | n.a. |
| m−2 (kcal mol−1 M−1) | −0.57 | n.a. |
| m3 (kcal mol−1 M−1) | 0.34 | 0.454 ± 0.005 |
| m−3 (kcal mol−1 M−1) | −0.41 | −0.42 ± 0.03 |
|
| ||
| ΔGU-Iearly (kcal/mol) | −3.0 ± 0.7 | n.a. |
| ΔGU-Icore (kcal/mol) | −4.3 ± 1.2 | −3.5 |
| ΔGU-N (kcal/mol) | −10.6 ± 1.3 | −9.9 |
Error propagated from the 68% confidence interval from a rigorous error analysis
In contrast, it is not possible to reasonably fit the off-pathway model (Model 2) (Figure S3). If forced, the off-pathway model can reproduce the experimentally observed rate constants (eigenvalues) reasonably well, but this results in unphysical amplitudes (e.g., negative average fluorescence lifetimes) and statistically poorer fits (χ2off/χ2on = 1.24, P < 10−6). This strongly rules out Model 2, suggesting that Iearly is likely an on-pathway intermediate.
Because the global kinetic analysis is constrained by the equilibrium unfolding curve and the stopped-flow/manual mixing results, thermodynamic information can be obtained about the two intermediates, Iearly and Icore, without direct unfolding kinetic data. The global analysis suggests that Iearly has a stability of 3.0 ± 0.7 kcal/mol (with an m-value of 0.97 kcal/mol/Murea) and that Icore is slightly more stable: 4.3 ± 1.2 kcal/mol (with an m-value of 1.5 kcal/mol/Murea) (errors were propagated from the 68% confidence interval from a rigorous error analysis, see Methods). The equilibrium m-value for both intermediates is dominated by the unfolding leg of the chevron, consistent with an unfolded-like transition state for formation of Iearly and an Iearly–like transition state leading to Icore.
Discussion
Using a continuous-flow rapid mixing device we can now directly observe the first several milliseconds of E. coli RNase H folding (with a 60 μs dead time) by monitoring the change in tryptophan fluorescence. Two kinetic phases are clearly observed: one on the hundred-microsecond timescale and one an order of magnitude slower, on the millisecond timescale. These kinetics represent folding to intermediates, with final folding to the native state occurring on a slower timescale (seconds), beyond the range of these experiments. Experiments with the I53D variant demonstrate that the millisecond-timescale kinetic phase is the formation of the previously characterized Icore intermediate. Therefore, our data indicate we are observing the transient population of an early intermediate (Iearly) in addition to formation of Icore. Kinetic modeling demonstrates that Iearly likely forms on-pathway to Icore.
Structural interpretation
How does the change in tryptophan environment give rise to the observed fluorescence lifetime for each state? Fluorescence quenching (often characterized by a shorter lifetime) is typically associated with solvent exposure, but may also arise from close proximity of quenching-competent groups such as other tryptophans, phenylalanines, protonated histidines, charged amino groups and protonated carboxyl groups [15–18]. Quenching by other tryptophans is a strong possibility in RNase H because four Trps (green in Figure 1) are within 5–7 Ångstroms of each other in the native structure and the two additional Trps (118 and 120, orange in Figure 1) are sequence local and also stacked cofacially in the native structure [19].
Iearly folds within the first few hundred microseconds and has a longer fluorescence lifetime relative to all other states. This is true for all constructs, including the 4Trp variant, indicating that the tryptophan region in helices C and D (orange in Figure 1) undergoes a dramatic change in environment from U to Iearly, and from Iearly to Icore. The long lifetime suggests that these tryptophans are significantly protected from solvent due to burial in a collapsed structure. It is noteworthy that this presumably collapsed region overlaps with the most extensive network of isoleucine, leucine and valine (ILV) residues in the native protein (Figure S4) – ILV residues have been shown to be important for guiding early structure formation [20]. Interestingly, the average fluorescence lifetime is much longer in Iearly than in the native state, suggesting the presence of non-native structure (consistent with a model incorporating the previous hydrogen exchange data, described below).
While a longer fluorescence lifetime would be predicted to correlate with an increase in total fluorescence intensity, Iearly exhibits slightly decreased fluorescence intensity relative to the unfolded state and Icore (Figure S1). This is likely because we are monitoring fluorescence only at the peak emission for solvent exposed tryptophans (335 to 379 nm) and the tryptophan emission spectrum shifts in hydrophobic environments. (Though this observation could also arise in the event of preferential quenching of Trp residues or rotamers with shorter lifetimes.)
The transition from Iearly to Icore is accompanied by a reduction in the fluorescence lifetime followed by an even further reduction when Icore folds to the native state. In the native state, most of the tryptophans have some solvent exposure (Figure 1b,c) and all are packed against other tryptophans, both of which are undoubtedly the basis of the observed quenching. Previous studies using HX [2,7], mutagenesis [6] and equilibrium mimics [9] all suggest a native-like topology for Icore. However, since all of the tryptophans reside within the structured region of Icore, the non-native fluorescence signal of Icore suggests that it contains some non-native features. Importantly, this is also true for the 4Trp variant where the tryptophans adjacent to the interface with the unstructured region of Icore have been removed.
Previously, Icore was thought to be a molten globule [2,21], which could account for the observed difference in fluorescence between Icore and N. However, we recently determined that Icore likely has closely packed side chains [9]. If this is the case, there must be at a minimum a small reorientation of tryptophan side chains as the protein folds from Icore to N, and therefore Icore must have non-native packing. This reorientation must occur in a way that makes the tryptophans in the native state more solvent exposed or else packed slightly differently so as to be more efficient at quenching each other, or more efficiently quenched by neighboring side chains. In the future, monitoring anisotropy [22] and/or iodide quenching could be used to directly address the mobility and solvent exposure of the tryptophans in Icore, as well as in Iearly.
A detailed model of the folding pathway
Any model for early folding must be reconciled with previous experiments. We recently explored the folding pathway of RNase H using a high-resolution pulse-labeled hydrogen exchange experiment monitored by mass spectrometry (HX-MS) [7] and found that folding occurred in three steps by sequential addition of native units of secondary structure: helix A and strand IV, then helix D and strand V, then finally helices B and C, forming the previously characterized Icore intermediate. In view of this work, our present results are most readily explained by the model depicted in Figure 8.
Figure 8.
A model for the early folding pathway of RNase H. This model incorporates the results presented here for the early folding monitored by fluorescence as well as the HX-MS results from Hu, et al. [7].
The initial burial of the tryptophans on helices C and D must precede or accompany the protection observed in helix A and strand IV. According to the scheme in Figure 8, Iearly may be the same species as the on-pathway, HX-MS A/4 intermediate, with non-native structure (orange) stabilizing the first native secondary structure elements (blue). This interaction would explain the mystery of why helix A is the first helix to show protection, when it is not the helix with the highest intrinsic helicity (which is helix E). This model makes a case for non-native structure formation that is on-pathway, supporting the folding of native units of secondary structure.
In subsequent folding steps, the non-native interaction is replaced by native-like packing between helices A and D, and then finally helices B and C assemble to form Icore. This model is consistent with our observation of three-state early folding in the 4Trp variant, suggesting that in the wild-type protein, the strand V tryptophans (green in Figure 1) obscure observation of the latter two folding events as discrete steps. Additionally, while Figure 8 depicts the Icore intermediate as containing secondary structure elements in a native-like orientation, native-like packing has not been achieved, as discussed above. This intermediate may be best described as a subset of native secondary structure and topology but with some non-native tertiary interactions. Such intermediates have been observed for other protein folding model systems [23–25]. Perhaps resolution of closely-packed non-native structure in Icore is what creates the subsequent rate-limiting barrier, as we have previously suggested [9].
The scheme in Figure 8 also predicts that the I–III/E regions (gray) are not involved in the early folding pathway, and only become structured in the rate-limiting step. This is supported by our observation that a fragment of the protein encompassing the contiguous sequence from helix A to strand V folds with kinetics and amplitudes very similar to the wild-type protein. Because the fragment folds [9] and appears to mirror the early folding of wild-type RNase H, the fragment could be a good target for atomistic folding simulations, which are generally limited to small proteins. (Proteins studied by detailed folding simulations are typically no larger than ~80 amino acids in size [1]; the fragment is 81 amino acids.)
Overall, we have presented a detailed model for the early folding pathway of RNase H at a timescale that is currently accessible by atomistic simulations of folding. Moreover, we show that the region of the protein gaining structure on this timescale is on a size-scale amenable to atomistic simulations. Our model makes the prediction that non-native structure is present in multiple on-pathway intermediates. This underscores the importance of using methods that monitor both secondary and tertiary structure when analyzing protein-folding pathways.
Materials and Methods
Materials
Cysteine-free E. coli RNase H was expressed and purified as described previously [5], with the following modifications. Heparin column fractions containing RNase H were diluted 1:1 with water and adjusted to a pH of 5.5. Precipitated protein was removed by centrifugation and the supernatant further purified using cation-exchange chromatography (HiTrap Capto S column). Purified protein was dialyzed against 50 mM ammonium bicarbonate, lyophilized and resuspended into the designated buffer before use.
The I53D variant [12] and the fragment variant [9] were constructed previously. The 4Trp variant was generated using the QuikChange mutagenesis protocol, using pSM101 as a template, and then subcloned into a pET27 vector.
Expressions were performed in the Rosetta2(DE3)pLysS strain. The 4Trp variant was purified like the wild type. The fragment expresses insolubly in inclusion bodies and was purified according to the protocol from Rosen, et al. [9]. The I53D variant was purified the same way, but without the final size chromatography step.
The purity and molecular mass of all the variants were verified by SDS-PAGE and mass spectrometry (data not shown).
Experimental conditions
For all experiments, the buffer conditions were 20 mM sodium acetate, pH 5.5, and 50 mM potassium chloride. All experiments were performed at room temperature (21 °C). Final protein concentration after mixing was 1.2 μM for wild type, fragment, and I53D, and 1.5 μM for the 4Trp variant.
Time-resolved tryptophan fluorescence
Details of the TCSPC apparatus equipped with a very similar microsecond CF mixer have been described [8,22]. In this work, we use mixers that are single-piece quartz microfluidic devices from Translume Inc. (Ann Arbor, MI). The faster one has custom, arrow-shaped geometry, with a 75 μm × 100 μm cross-section and the large one has a T-shaped geometry with a 300 μm × 300 μm cross section. Both are 3 cm in length after the point of mixing. Prior to use, both mixers were covalently modified using silanated PEG in order to passivate the surfaces and prevent protein adsorption on the channel walls. This was done by slowly flowing 2-[methoxy(polyethyleneoxy)propyl]trimethoxysilane, tech-90 through the mixer for over three hours followed by rinsing with methanol.
Flow to the microchannel mixer was provided by two syringe pumps (500D, Isco Inc., Lincoln, NE) operating at a combined flow rate of 8 mL/min in the smaller mixer, corresponding to a ~60 μs dead time, and 15 ml/min in the larger mixer, corresponding to a ~2 ms dead time (the dead time is the mixing time). The exception is that the 0.6 M urea experiment in the smaller mixer was performed with a 7 mL/min combined flow rate. Excitation at 293 nm with a repetition rate of 3.8 MHz was provided by the vertically polarized third harmonic of a Ti:sapphire laser. Typical excitation power was 500 μW. Tryptophan emission was measured using a 357 nm filter with 44 nm bandwidth from Semrock Inc. (Rochester, NY). A Glan-Taylor polarizer at magic angle (54.7° from vertical) orientation was used for all measurements. The variation in excitation intensity along the flow channel was corrected using a standard (N-acetylL-tryptophanamide), as described previously [8]. Separate instrument responses were recorded for each channel by recording of scattered light signal or by numerical deconvolution from the N-acetyl-L-tryptophanamide decay curve. The photon count rate was typically 7 × 10⁴ to 1 × 10⁵ cps. Each scan of the channel consisted of approximately 120 points, with 0.5 s/point. Typically, 6–8 scans were summed.
The excited-state lifetime, τave, was determined by calculating the first moment (center of mass) for the time-resolved fluorescence decay, based on the following equality:
where αi and τi are the amplitude and lifetime of the ith phase in a Trp fluorescence decay curve, and Ij is the intensity at the tj point in decay time. The use of the first moment was adopted because it provided a model-independent approach for monitoring the kinetics based on a metric that was insensitive to protein concentration and relatively independent of signal-to-noise. The latter feature allowed more robust comparisons between the high signal-to-noise equilibrium experiments and kinetic data. For all data sets, the first moment was calculated over the −0.16 to 14.7 ns time range relative to the zero-time defined by the excitation pulse arrival.
Fits to the kinetic data
The kinetic data were fit to one- or two-exponentials according to
Signal = A exp(−kobs t) + C, or
Signal = A1 exp(−kobs,1 t) + A2 exp(−kobs,2 t) + C,
to determine the rate constants for the observed kinetic phases (in the text, we report time constants of the kinetic phases: the time constant is the reciprocal of the observed rate constant). The data from experiments performed in both mixing devices (WT 0.6 M and 1.5 M urea, 4Trp and fragment experiments) were combined, fit to two-exponentials and both observed rate constants considered. Experiments performed in only the fastest mixing device (WT 0.9 M and 1.2 M urea) were fit to two-exponentials but only the fastest observed rate constant is considered. Experiments performed only in the slower mixing device (WT 1 M and 2 M urea) were fit to one-exponential. Where shown, the 95% confidence intervals were calculated using the standard deviation of the fits and likely underestimate the true error. Fits were performed using Savuka. To validate the use of the first moment, fits of the kinetic data were also carried out using a global analysis that incorporated the first moment weighted by the total intensity. Because the total intensity (used as a proxy for quantum yield) change throughout the microsecond to second time range was less than 20%, fits of the first moment did not depend on weighting by quantum yield.
Equilibrium titrations
Equilibrium unfolding experiments were set up using a titrator and measured using a homemade autosampler assembled from linear stepper motor stages (Zaber Technologies Inc., Vancouver, British Columbia, Canada) and a Hamilton Microlab 500 syringe pump. Signal was measured using the same TCSPC apparatus as used in the kinetic experiments. For comparison to kinetic data, signal from the equilibrium titration was adjusted to match equilibrium endpoints measured within the mixing device.
Fitting kinetic models to the Chevrons
Global fits of the kinetic data at various final denaturant concentrations was accomplished by the “cumbersome” [26] approach of fitting the raw data. The amplitudes and time constants were calculated from the eigenvalues and eigenvectors of a general kinetic master equation as detailed previously [27,28]. The baselines for the optical properties of the intermediates were assumed to follow the Z-approximation, where Z=(Yint-Ynative)/(Yunfolded-Ynative) and Yunfolded,Ynative and Yint are the optical properties of the unfolded, native and intermediate species (e.g. Iearly or Icore), respectively, in the absence of denaturant. For the fits utilizing Model 1 and Model 2, the refolding m-values were constrained to be positive and unfolding m-values to be negative. Equilibrium data was included in the global fits with the thermodynamic parameters calculated from the microscopic rate constants and associated m-values.
Ideally, the global fit would utilize raw kinetic data from the previous stopped-flow CD work with RNase H in Raschke and Marqusee [2]. We attempted this approach, but unfortunately the signal-to-noise of these data on the millisecond timescale was insufficient to constrain the global fits so that the slowest kinetic step agreed with the published work. Therefore, in order to be able to use the longer timescale data published previously [2], we created a synthetic dataset based on the published chevron. The noise level of the synthetic data set was adjusted to the maximum amount that produced eigenvalues statistically within the 68% confidence interval of those in Raschke and Marqusee as determined by a Z-statistic comparing the residuals of the two chevrons. When the synthetic data set is included in the global fit with our continuous-flow data, the resulting microscopic rate constants for the final step of the mechanism, Icore to N in this manuscript and I to N in Raschke and Marqusee, are nearly identical.
Errors for the microscopic kinetic rates were determined using sensitivity (rigorous) analysis. This was accomplished by sampling of the parameter over parameter space (typically 20 to 40 points) and keeping the parameter fixed at each value while allowing all other parameters to vary as before. The chi-square obtained for each point along the parameter space was used to obtain a one-dimensional chi-square surface. This was converted to an F-statistic (using the minimum chi-square value for the ratio) and converted into a one-dimensional probability curve to obtain the confidence interval for each parameter.
Supplementary Material
Highlights.
What are the earliest events in protein folding?
Continuous flow mixing initiates protein folding in 60 microseconds
Tertiary structure formation is monitored by tryptophan fluorescence
Non-native structure is present in two early on-pathway intermediates
Results are time- and size-scale accessible to all-atom folding simulation
Acknowledgments
We thank K. Connell for help with initial experiments and purification of protein and B. Maguire for additional help with protein purification. This work was supported by grants from the NIH (GM05945 to SM and GM23303 to CRM/OB), NSF (MCB1121942 to CRM/OB) and predoctoral fellowship funding from the NSF and NIH.
Footnotes
Publisher's Disclaimer: This is a PDF file of an unedited manuscript that has been accepted for publication. As a service to our customers we are providing this early version of the manuscript. The manuscript will undergo copyediting, typesetting, and review of the resulting proof before it is published in its final citable form. Please note that during the production process errors may be discovered which could affect the content, and all legal disclaimers that apply to the journal pertain.
References
- 1.Lane TJ, Shukla D, Beauchamp KA, Pande VS. To milliseconds and beyond: challenges in the simulation of protein folding. Current Opinion in Structural Biology. 2013;23:58–65. doi: 10.1016/j.sbi.2012.11.002. [DOI] [PMC free article] [PubMed] [Google Scholar]
- 2.Raschke T, Marqusee S. The kinetic folding intermediate of ribonuclease H resembles the acid molten globule and partially unfolded molecules detected under native conditions. Nature Structural Biology. 1997;4:298–304. doi: 10.1038/nsb0497-298. [DOI] [PubMed] [Google Scholar]
- 3.Cecconi C, Shank E, Bustamante C, Marqusee S. Direct observation of the three-state folding of a single protein molecule. Science. 2005;309:2057–60. doi: 10.1126/science.1116702. [DOI] [PubMed] [Google Scholar]
- 4.Kanaya S, Kimura S, Katsuda C, Ikehara M. Role of cysteine residues in ribonuclease H from Escherichia coli. Biochem J. 1990;271:59–66. doi: 10.1042/bj2710059. [DOI] [PMC free article] [PubMed] [Google Scholar]
- 5.Dabora JM, Marqusee S. Equilibrium unfolding of Escherichia coli ribonuclease H: characterization of a partially folded state. Protein Sci. 1994;3:1401–8. doi: 10.1002/pro.5560030906. [DOI] [PMC free article] [PubMed] [Google Scholar]
- 6.Raschke TM, Kho J, Marqusee S. Confirmation of the hierarchical folding of RNase H: a protein engineering study. Nature Structural Biology. 1999;6:825–31. doi: 10.1038/12277. [DOI] [PubMed] [Google Scholar]
- 7.Hu W, Walters BT, Kan Z-Y, Mayne L, Rosen LE, Marqusee S, et al. Stepwise protein folding at near amino acid resolution by hydrogen exchange and mass spectrometry. Proc Natl Acad Sci USA. 2013;110:7684–9. doi: 10.1073/pnas.1305887110. [DOI] [PMC free article] [PubMed] [Google Scholar]
- 8.Bilsel O, Kayatekin C, Wallace LA, Matthews CR. A microchannel solution mixer for studying microsecond protein folding reactions. Review of Scientific Instruments. 2005:1–7. [Google Scholar]
- 9.Rosen LE, Connell KB, Marqusee S. Evidence for close side-chain packing in an early protein folding intermediate previously assumed to be a molten globule. Proc Natl Acad Sci USA. 2014 doi: 10.1073/pnas.1410630111. Accepted. [DOI] [PMC free article] [PubMed] [Google Scholar]
- 10.Santoro MM, Bolen DW. Unfolding free energy changes determined by the linear extrapolation method: 1. Unfolding of phenylmethanesulfonyl alpha-chymotrypsin using different denaturants. Biochemistry. 1988;27:8063–8. doi: 10.1021/bi00421a014. [DOI] [PubMed] [Google Scholar]
- 11.Kathuria SV, Kayatekin C, Barrea R, Kondrashkina E, Graceffa R, Guo L, et al. Microsecond barrier-limited chain collapse observed by time-resolved FRET and SAXS. Journal of Molecular Biology. 2014;426:1980–94. doi: 10.1016/j.jmb.2014.02.020. [DOI] [PMC free article] [PubMed] [Google Scholar]
- 12.Spudich GM, Miller EJ, Marqusee S. Destabilization of the Escherichia coli RNase H kinetic intermediate: switching between a two-state and three-state folding mechanism. Journal of Molecular Biology. 2004;335:609–18. doi: 10.1016/j.jmb.2003.10.052. [DOI] [PubMed] [Google Scholar]
- 13.Connell KB, Miller EJ, Marqusee S. The Folding Trajectory of RNase H Is Dominated by Its Topology and Not Local Stability: A Protein Engineering Study of Variants that Fold via Two-State and Three-State Mechanisms. Journal of Molecular Biology. 2009;391:450–60. doi: 10.1016/j.jmb.2009.05.085. [DOI] [PMC free article] [PubMed] [Google Scholar]
- 14.Fischer K, Marqusee S. A rapid test for identification of autonomous folding units in proteins. Journal of Molecular Biology. 2000;302:701–2. doi: 10.1006/jmbi.2000.4049. [DOI] [PubMed] [Google Scholar]
- 15.Chen Y, Barkley MD. Toward understanding tryptophan fluorescence in proteins. Biochemistry. 1998;37:9976–82. doi: 10.1021/bi980274n. [DOI] [PubMed] [Google Scholar]
- 16.Xu J, Toptygin D, Graver KJ, Albertini RA, Savtchenko RS, Meadow ND, et al. Ultrafast fluorescence dynamics of tryptophan in the proteins monellin and IIAGlc. Jacs. 2006;128:1214–21. doi: 10.1021/ja055746h. [DOI] [PubMed] [Google Scholar]
- 17.Callis PR, Vivian JT. Understanding the variable fluorescence quantum yield of tryptophan in proteins using QM-MM simulations. Quenching by charge transfer to the peptide backbone. Chemical Physics Letters. 2003;369:409–14. [Google Scholar]
- 18.Arai M, Iwakura M, Matthews CR, Bilsel O. Microsecond Subdomain Folding in Dihydrofolate Reductase. Journal of Molecular Biology. 2011;410:329–42. doi: 10.1016/j.jmb.2011.04.057. [DOI] [PubMed] [Google Scholar]
- 19.Katayanagi K, Miyagawa M, Matsushima M, Ishikawa M, Kanaya S, Nakamura H, et al. Structural details of ribonuclease H from Escherichia coli as refined to an atomic resolution. Journal of Molecular Biology. 1992;223:1029–52. doi: 10.1016/0022-2836(92)90260-q. [DOI] [PubMed] [Google Scholar]
- 20.Wu Y, Vadrevu R, Kathuria S, Yang X, Matthews CR. A tightly packed hydrophobic cluster directs the formation of an off-pathway sub-millisecond folding intermediate in the alpha subunit of tryptophan synthase, a TIM barrel protein. Journal of Molecular Biology. 2007;366:1624–38. doi: 10.1016/j.jmb.2006.12.005. [DOI] [PMC free article] [PubMed] [Google Scholar]
- 21.Connell KB, Horner GA, Marqusee S. A Single Mutation at Residue 25 Populates the Folding Intermediate of E. coli RNase H and Reveals a Highly Dynamic Partially Folded Ensemble. Journal of Molecular Biology. 2009;391:461–70. doi: 10.1016/j.jmb.2009.05.084. [DOI] [PMC free article] [PubMed] [Google Scholar]
- 22.Wu Y, Kondrashkina E, Kayatekin C, Matthews CR, Bilsel O. Microsecond acquisition of heterogeneous structure in the folding of a TIM barrel protein. Proc Natl Acad Sci USA. 2008;105:13367–72. doi: 10.1073/pnas.0802788105. [DOI] [PMC free article] [PubMed] [Google Scholar]
- 23.Capaldi AP, Kleanthous C, Radford SE. Im7 folding mechanism: misfolding on a path to the native state. Nature Structural Biology. 2002;9:209–16. doi: 10.1038/nsb757. [DOI] [PubMed] [Google Scholar]
- 24.Feng H, Zhou Z, Bai Y. A protein folding pathway with multiple folding intermediates at atomic resolution. Proc Natl Acad Sci USA. 2005;102:5026–31. doi: 10.1073/pnas.0501372102. [DOI] [PMC free article] [PubMed] [Google Scholar]
- 25.Nishimura C, Dyson HJ, Wright PE. Identification of Native and Non-native Structure in Kinetic Folding Intermediates of Apomyoglobin. Journal of Molecular Biology. 2006;355:139–56. doi: 10.1016/j.jmb.2005.10.047. [DOI] [PubMed] [Google Scholar]
- 26.Maxwell KL, Wildes D, Zarrine-Afsar A, De Los Rios MA, Brown AG, Friel CT, et al. Protein folding: defining a “standard” set of experimental conditions and a preliminary kinetic data set of two-state proteins. Protein Sci. 2005;14:602–16. doi: 10.1110/ps.041205405. [DOI] [PMC free article] [PubMed] [Google Scholar]
- 27.Bilsel O, Yang L, Zitzewitz JA, Beechem JM, Matthews CR. Time-resolved fluorescence anisotropy study of the refolding reaction of the alpha-subunit of tryptophan synthase reveals nonmonotonic behavior of the rotational correlation time. Biochemistry. 1999;38:4177–87. doi: 10.1021/bi9829433. [DOI] [PubMed] [Google Scholar]
- 28.Kathuria SV, Day IJ, Wallace LA, Matthews CR. Kinetic traps in the folding of beta alpha-repeat proteins: CheY initially misfolds before accessing the native conformation. Journal of Molecular Biology. 2008;382:467–84. doi: 10.1016/j.jmb.2008.06.054. [DOI] [PubMed] [Google Scholar]
Associated Data
This section collects any data citations, data availability statements, or supplementary materials included in this article.


