Abstract
Objective
To quantitatively assess the impact of follicle size on oocyte maturation, fertilization, and embryo quality.
Design
Prospective study.
Setting
Academic medical center.
Patient(s)
Couples undergoing ovarian stimulation and in vitro fertilization (IVF).
Intervention(s)
A total of 235 cycles were monitored prospectively, and 2934 oocytes were collected from five groups of follicle size. Repeated measures multivariate analyses were used to compare the smaller follicle sizes with the lead follicle.
Main Outcome Measure(s)
Oocyte maturation, fertilization, and embryo quality.
Result(s)
Compared with the lead follicular group (>18 mm), the odds of a mature oocyte from a 16 to 18 mm size follicle were 37% and declined progressively with each size. The odds of fertilization of oocytes from follicles 16 to 18 mm in size was 28% less than the lead group and decreased with each size. The rate of polyspermy with conventional insemination was increased for the smaller follicular groups (adjusted odds ratio =2.37). Follicle size did not predict embryo cell number, but embryos from smaller follicles had a statistically significantly higher fragmentation compared with the lead group.
Conclusion(s)
The lead follicular group was most likely to have a mature oocyte that was capable of fertilization and best suited for development into a high-quality embryo. The smaller follicles were capable of producing metaphase II oocytes that could fertilize, but at rates approaching only 60% that of the lead follicular group.
Keywords: Ovarian stimulation, follicle size, oocyte nuclear maturation, fertilization, embryo quality
Controlled ovarian hyperstimulation is critical to assisted reproduction because it increases the number of oocytes undergoing development. Of these, only a portion will be competent for fertilization and development into viable embryos. Understanding of the processes of selection, follicular growth, and ovulation has guided the development of this important component of treatment. The medications, designed to override the selection of a single dominant follicle, drive multiple antral follicles into the growth phase. These follicles grow at different rates, and management is guided by their size rather than their competence. The administration of hCG, in mimicking the endogenous luteinizing hormone (LH) surge, is the final event that determines follicular maturity and developmental competence. The timing of its administration is typically guided by the size of the lead follicle or lead follicular cohort.
This treatment is therefore based on an assumption that follicular size predicts the developmental competence of the oocyte. The assumption is based on limited studies using different models from unstimulated cycles to in vitro maturation models in animals (1–7). Yet the available data is conflicting, and although several human studies have suggested oocytes derived from larger follicles outperform (in terms of fertilization and embryo quality) oocytes originating from smaller follicles, the correlation of oocyte competence with follicular size, after controlled ovarian stimulation, has not been well characterized. For instance, while some have suggested the decreased fertilization rate and embryo quality observed with oocytes originating from smaller follicles can be overcome with intracytoplasmic sperm injection (ICSI) (1), others have suggested normal fertilization of an oocyte is independent of its follicular size origin (6).
The reason for various laboratory outcomes that result from the ovarian stimulation and in vitro fertilization process are often questioned. Although there is evidence to suggest that follicle size can influence the outcomes, the actual relationship has not been determined. Because the decision to administer human chorionic gonadotropin (hCG) is based largely on the lead follicle, we sought to quantify the behavior of oocytes originating from smaller follicles compared with the lead follicle. More specifically, we evaluated the odds of oocyte maturation, fertilization, and the resultant embryo quality from oocytes originating from a range of follicle sizes with comparisons with the lead follicular group. Comparisons within women allowed us to carefully elucidate the relationship between developmental competence of the oocyte and follicular size and further investigate whether follicle size was an independent predictor of the fertilization rate after nuclear maturation was assessed. This information will be crucial to any quantitative decision-making model.
MATERIALS AND METHODS
Study Population
From April to September 2005, 235 assisted reproduction cycles were monitored prospectively for oocyte maturation, fertilization, and embryo quality with respect to follicle size. Only one treatment cycle per patient was analyzed. All patients underwent standard ovarian stimulation protocols (153 long luteal, 55 microdose flare, 20 antagonists, and seven stop protocols). The average age of the women was 34.1 ± 5.91 years old. A total of 2934 oocytes were collected. This study was approved by the institutional review board at the University of California, San Francisco.
Follicular Size Measurement and Oocyte Retrieval
All women underwent standard ovarian stimulation. Individuals were monitored with transvaginal ultrasound (Shimadzu, SDU-450XL, Kyoto, Japan), and follicles were measured in two dimensions to obtain a mean diameter. The decision to administer hCG was based on the lead follicular cohort, usually with at least two follicles measuring 18 mm in mean diameter. A transvaginal, ultrasound-guided follicular aspiration was conducted 36 hours after hCG administration. At retrieval, each follicle was measured before aspiration. We decided to subdivide the follicles into five arbitrary follicular groups according to their mean two-dimensional size: >18 mm, 16 to 18 mm, 13 to 15 mm, 10 to 12 mm, and <10 mm. These groups were chosen with an average difference of 3 mm in diameter to allow sufficient discriminatory power to carefully examine whether a follicular size existed beyond which the parameters examined (e.g., fertilization or oocyte maturation) would change. Following identification, the follicles were pierced with a single lumen needle and aspirated. The aspirates were collected in sequential fashion, and both the needle and tubing were flushed with GMOP media (Vitrolife, Englewood, CO) between aspirations of different follicular size groups.
Microscopic examination of the follicular aspirates was performed by the embryologist. Once the oocytes were identified, they were collected and organized according to follicle size in four-well dishes (Nunc, Roskilde, Denmark) containing medium G1.3 (Vitrolife) with 5% HSA (Sage-Cooper Surgical, Trumball, CT).
Insemination and Determination of Oocyte Maturity
Oocytes undergoing conventional insemination were grouped by their follicular size in 200-μL drops and fertilized with approximately 100,000 spermatozoa/mL 4 hours after the retrieval. Fifteen to 18 hours after insemination, the normally fertilized oocytes were identified and cultured individually by corresponding follicle size.
In ICSI cases, oocyte and embryo manipulation was performed as previously described (8). The oocytes were grouped in 25-μL media drops by nuclear maturation status and corresponding follicle size. Metaphase II (MII) oocytes were injected by standard injection technique. The oocytes were then cultured individually by corresponding follicle size.
Embryo Quality (Morphologic Grading)
Each embryo was cultured individually in 25-μL media drops (G1.3 with 5% HSA) for 72 hours. Day-3 embryo grading, based on cellular cleavage and fragmentation, was recorded separately. Fragmentation score was determined by the degree of fragmentation proportional to the whole embryo volume: 1, no fragmentation; 2, <10%; 3, 10% to 25%; 4, 25% to 50%; 5, >50%. The information for each oocyte, starting from the follicular size, was followed through all laboratory procedures including insemination, oocyte stripping for ICSI, ICSI, pronuclear assessment, embryo culture, and embryo transfer.
Statistical Analysis
A chi-square test was performed to compare crude rates for oocyte maturation and fertilization, and an analysis of variance (ANOVA) was done to evaluate embryo fragmentation among different follicle sizes. To account for the clustered nature of the data (repeat measures within the same individual) generalized estimation equation logistic regression was used to assess oocyte maturation (metaphase II) and two pronuclei formation (2PN), reported as adjusted odds ratios (AOR). In addition, generalized estimation equations linear regression was used to analyze day-3 embryo fragmentation and embryo cell number. Interactions between the different stimulation protocols and follicle size were tested for the outcomes measured. Goodness of fit testing was done to determine if there were any deviations from linearity for follicle size; if not, tests for linear trend were performed. Comparisons between ICSI and conventional insemination for odds of fertilization and average fragmentation were tested at each follicular size and with formal tests of interaction. Two-sided P <.05 was considered statistically significant. Stata Ver 7.0 (Stata Corp, College Station, TX) was used for all statistical analyses.
RESULTS
The crude rates of different stages of oocyte maturation, fertilization outcomes, and embryo quality are shown in Table 1 and Table 2. For each outcome, the follicle size effects were not statistically different across ovarian stimulation protocols (P>.14 for the test of interaction in all cases). For this reason, in characterizing follicle size effects below, we did not distinguish protocol type.
TABLE 1.
Fertilization outcomes for different follicle sizes.
| Follicle size (number of oocytes)
|
||||||||||
|---|---|---|---|---|---|---|---|---|---|---|
| >18 mm (1609) | 16–18 mm (594) | 13–15 mm (453) | 10–12 mm (167) | <10 mm (111) | ||||||
| IVF | 719
|
227
|
217
|
67
|
48
|
|||||
| n | % | n | % | n | % | n | % | n | % | |
|
| ||||||||||
| 3PN/oocytea | 44 | 6.1 | 19 | 8.4 | 16 | 7.4 | 9 | 13.4 | 8 | 16.7 |
| 2PN/oocytea | 480 | 66.8 | 136 | 59.9 | 103 | 47.5 | 21 | 31.3 | 13 | 27.1 |
|
| ||||||||||
| ICSI | 890
|
367
|
236
|
100
|
63
|
|||||
| n | % | n | % | n | % | n | % | n | % | |
|
| ||||||||||
| MIIa | 814 | 89.9 | 303 | 78.7 | 180 | 72.9 | 37 | 53.0 | 34 | 47.6 |
| 3PN/MII | 18 | 2.1 | 10 | 3.1 | 3 | 1.7 | 1 | 1.9 | 0 | 0.0 |
| 2PN/MIIa | 587 | 72.6 | 206 | 68.9 | 115 | 66.3 | 35 | 64.2 | 23 | 66.7 |
| 2PN/oocytea | 587 | 66.0 | 206 | 56.1 | 115 | 48.7 | 35 | 35.0 | 23 | 36.5 |
| Immature/oocytea | 86 | 9.7 | 78 | 21.3 | 64 | 27.1 | 47 | 47.0 | 33 | 52.4 |
| Degenerated/MIIb | 89 | 10.9 | 38 | 12.8 | 17 | 9.9 | 3 | 5.7 | 1 | 3.3 |
| Degenerated/oocytea,c | 101 | 11.3 | 52 | 14.2 | 22 | 9.3 | 11 | 11.0 | 1 | 1.6 |
Chi-square test, P<.05.
The number of degenerated oocytes after sperm injection.
The total number of degenerated oocytes.
TABLE 2.
Embryo cell number and fragmentation stratified among the different follicle size groups (mean ± SD) and difference adjusted for repeated measures in a single individual relative to the lead follicle group.
| Follicle group | >18 mm (878) | 16–18 mm (269) | 13–15 mm (165) | 10–12 mm (43) | <10 mm (31) |
|---|---|---|---|---|---|
| Cell number | |||||
| Average | 6.91 3 1.94 | 6.78 3 2.07 | 6.65 3 2.00 | 6.88 3 2.08 | 6.16 3 2.10 |
| Differencea | 0 | −0.160 | −0.050 | −0.040 | −0.642 |
| P valuea | ref | .295 | .792 | .899 | .116 |
| Fragmentation | |||||
| Averageb | 2.48 3 1.14 | 2.68 3 1.17 | 2.87 3 1.17 | 2.74 3 1.24 | 2.77 3 1.17 |
| Differencea | 0 | 0.348 | 0.346 | 0.409 | 0.406 |
| P valuea | ref | .000 | .002 | .021 | .080 |
Regression analysis.
Analysis of variance, P<.05.
Oocyte Nuclear Maturation
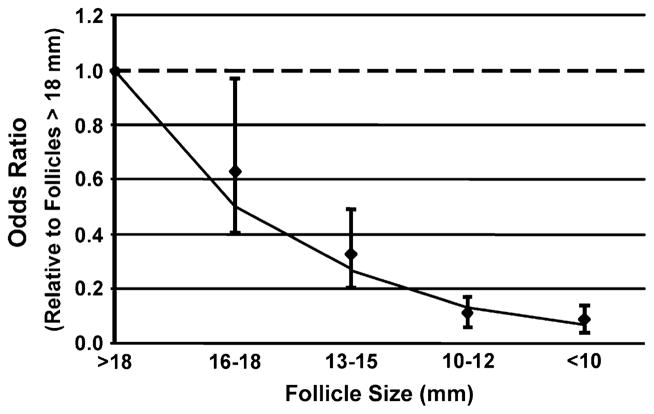
The chance that an oocyte had undergone nuclear maturation (MII) is directly related to follicle size (Fig. 1). The odds that an oocyte was mature from 16 to 18 mm follicles was 37% less compared with oocytes originating from follicles that were >18 mm in size. The odds of retrieving a mature oocyte progressively declined with decreasing follicular size. Compared with the lead follicular group (>18 mm), the odds of a mature oocyte were 70%, 90%, and 92% less from the 13 to 15 mm, 10 to 12 mm, and <10 mm follicles, respectively. The type of ovarian stimulation did not influence the relationship between follicle size and oocyte nuclear maturation.
FIGURE 1.
The odds of aspiration of metaphase II (nuclear mature) oocytes relative to the lead (>18 mm) follicular group.
The relationship between obtaining a mature oocyte across follicle size groups was also investigated (Fig. 1). The goodness of fit test showed no deviation from linearity (P=.304) on the log odds scale. The effect was a monotonic decrease in the odds of obtaining a mature oocyte with each decrease in the follicle size group (AOR = 0.51, P<.0001).
Fertilization
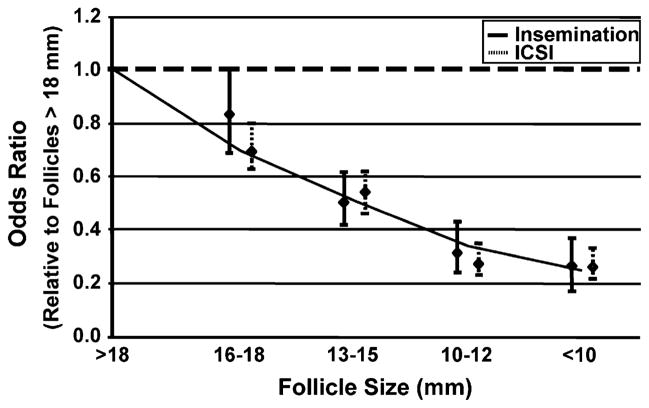
For comparison, the odds of fertilization with ICSI (2PN/ oocyte stripped) and conventional insemination (2PN/oocyte inseminated) are shown separately (Fig. 2). The analysis showed that the odds of fertilization decreased in the smaller follicular groups regardless of the method of fertilization, and the effect was no different for ICSI compared with conventional insemination for each follicular size (P>.21 in all cases).
FIGURE 2.
The odds of fertilization relative to the lead (>18 mm) follicular group using all retrieved cumulus oocyte complexes and stratified by method of fertilization (conventional insemination or intracytoplasmic sperm injection).
The overall relationship between fertilization rates for oocytes across follicle size groups was calculated regardless of method of fertilization. Compared with the lead follicular group, the odds of fertilization of oocytes originating from follicles 16 to 18 mm were 22% less (AOR = 0.78; 95% CI, 0.58–0.89). The odds of fertilization from follicles 13 to 15 mm, 10 to 12 mm, and <10 mm were also 46%, 72%, and 73% less compared with follicles >18 mm, respectively (AOR = 0.54, 0.28, and 0.27; P<.001). The type of ovarian stimulation also did not modify this relationship. The goodness of fit showed no departures from linearity (P=.522). The effect of follicle size origin for fertilization similarly showed a monotonic trend (AOR =0.71, P<.0001).
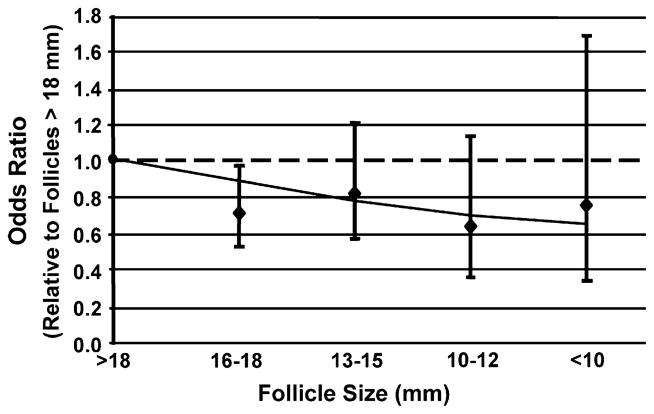
When evaluating the fertilization rate for mature oocytes only (MII) for each follicular group, wide variation was observed (Fig. 3). The odds of fertilization remained signif-cantly less for oocytes originating from follicles 16 to 18 mm compared with follicles >18 mm. But the odds of fertilization of oocytes derived from follicles <18 mm (all classes included) were not statistically significantly different among themselves, although they remained different from the lead cohort of follicles. However, the goodness of fit test showed no departures from linearity, and the test for linear trend showed a tendency for a decrease in fertilization with decreasing follicle size (OR = 0.89, P=.05).
FIGURE 3.
The odds of fertilization of metaphase II (nuclear mature) oocytes from intracytoplasmic sperm injection only relative to the lead (>18 mm) follicular group.
Polyspermy
The rate of polyspermy (>2PN/oocyte inseminated) with conventional insemination was increased for the smaller follicular groups (Fig. 4). Compared with follicles that were >18 mm in size, oocytes derived from follicles that were 10 to 12 mm in size were at higher odds to have polyspermy (AOR = 2.37; 95% CI, 1.5–3.7). Oocytes derived from follicles <10 mm in size similarly showed a trend toward higher polyspermy (AOR = 1.47; 95% CI, 0.86–2.76). Goodness of fit test revealed no deviation from linearity (P=.53). The estimate for overall linear trend, however, was not significant (AOR = 1.02; 95% CI, 0.85–1.22).
FIGURE 4.
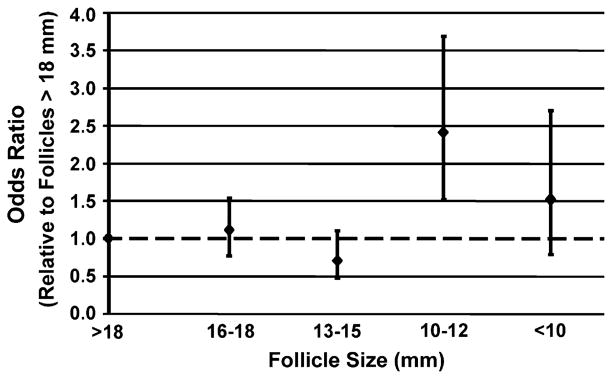
The odds of polyspermy from conventional insemination only relative to the lead (>18 mm) follicular group.
Embryo Quality
Embryo day-3 cell number and fragmentation scores were averaged for each follicular group regardless of the method of fertilization (see Table 2). Fragmentation was graded from 1 to 5 with 1 being the best as described previously. Comparisons of embryo quality were analyzed by repeated measures analysis (see materials and methods). Follicle size did not significantly predict embryo cell number. However, smaller follicles had significantly higher average day-3 embryo fragmentation compared with the lead follicular group (see Table 2). The average fragmentation was 0.34 higher for embryos derived from oocytes in the 16 to 18 mm size compared with follicles >18 mm in size. Similar findings were observed with embryos derived from follicles that were 13 to 15 mm in size. Goodness of fit test showed no deviation from linearity (P=.10), while the increase in fragmentation in smaller follicles was statistically significant (coefficient for the test for a linear increase = 0.14, P<.0001).
The relationship of follicle size to fragmentation stratified by method of fertilization was tested (Fig. 5). Goodness of fit tests showed no departures for linearity (P>.25). Tests for linear trend showed that with both conventional insemination and ICSI, the average day-3 embryo fragmentation increased as follicle size decreased (coefficient = 0.18, P=.002; coefficient = 0.11, P=.008, respectively). Although a higher trend was noted for conventional insemination, formal comparisons revealed no statistically significant difference (P=.134) between the groups.
FIGURE 5.
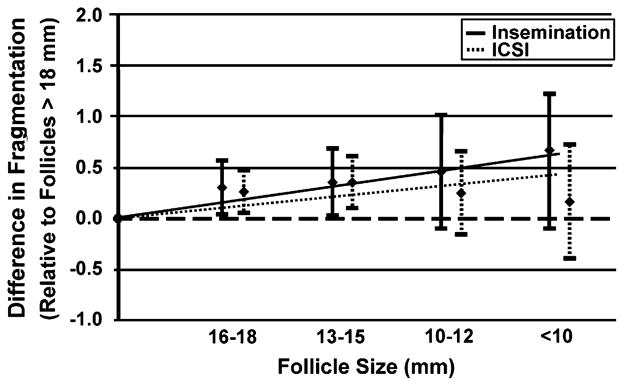
Average fragmentation relative to the lead (>18 mm) follicular group stratified by method of fertilization (conventional insemination or intracytoplasmic sperm injection).
DISCUSSION
In this study, we quantified the relationship between follicle size and oocyte maturation, fertilization, and embryo quality relative to the lead follicle group. This enabled us to predict potential outcomes based on the egg origin and to explain some of the outcomes of the in vitro fertilization (IVF) process.
The results demonstrated that the odds of oocyte maturation and fertilization rate were statistically significantly decreased with smaller follicles (see Figs. 1 and 2). Previous studies have also shown a decreased fertilization rate of oocytes from small follicles (1 mL of follicular fluid, approximately equivalent to12 mm follicles) (1, 2, 9). To further explore whether the odds of fertilization was different with ICSI compared with conventional insemination, our analysis included all oocytes retrieved for each group regardless of maturation status. The results clearly revealed that ICSI and conventional insemination have similar odds of fertilizing an oocyte within each follicular size (see Fig. 2). This has clinical relevance, especially in cases of poor fertilization following conventional insemination where it may be that the oocytes were from smaller, potentially immature follicles. Thus, the oocyte may contribute to the poor fertilization distinct from potential abnormalities with the sperm. Furthermore, it can be assumed that if the oocyte is mature, even in situations of limited oocyte number, it is equally likely to fertilize by conventional insemination as by ICSI.
It is well known that nuclear maturation, defined as oocytes that have completed their first meiotic division and are in MII, is necessary for normal fertilization. Therefore, it should not be a surprise that the fertilization rate of oocytes from different follicle sizes, following standard insemination, parallels the rate of oocyte maturation (see Fig. 2). The question remains whether an oocyte with nuclear maturation, regardless of its follicle size of origin, has equal fertilizing capacity. Several investigators have proposed that cytoplasmic and plasma membrane maturation are also obligatory for normal fertilization (10, 11). Unfortunately, there are no good markers for cytoplasmic or plasma membrane maturation. Although several studies have proposed a variety of morphologic oocyte parameters as surrogate markers (12–15), none have been consistent predictors of fertilization outcome.
We hypothesized an oocyte’s developmental competence depends on the growth of the follicle and its intrafollicular milieu; thereby, competence was expected to be superior in the lead follicular group. We calculated the odds of fertilization of nuclear-mature (MII) oocytes. We found that the 2PN rate is highest for MII oocytes originating from the lead follicular group. The test for linear trend suggests that there is a trend for a decrease in fertilization as follicular size decreases (see Fig. 2). This may suggest follicle size is a surrogate marker for cytoplasmic maturation, albeit less than it is a marker for nuclear maturation. Our results are consistent with previous data that indicate follicle size is associated with the fertilization rate of MII oocytes (5). However, Ectors et al. (5) found fertilization rates were higher with oocytes originating from follicles of <16 mm and >23 mm compared with oocytes recovered from follicles of 16 to 23 mm in size. The inconsistency may be caused by their comparisons between patients rather than within.
Abnormal fertilization may also be considered a marker of oocyte competence. Salha et al. (6) suggested that, although the fertilization rate is less with oocytes that originate from follicles that contain less than 1 mL of follicular fluid, if fertilized, the 2PN rate was the same. This finding suggested that once fertilized, the rate of polyspermy was no different for oocytes among the different follicular sizes. Our findings, however, differ. With follicles that are smaller than 12 mm, the odds of polyspermy are over twofold higher than for larger follicles (see Fig. 4). This suggests that oocytes retrieved from smaller follicles could explain cases of high polyspermy with IVF.
It is evident the process of IVF may result in pronounced embryo heterogeneity in terms of morphology. The reason for the marked variation is not known, but it likely reflects some degree of developmental capacity of the individual oocyte, some of which may be maturational in origin. Limited studies evaluating whether embryo quality was associated with oocyte follicular origin have used different morphologic criteria. Studies evaluating the association of embryo cleavage with follicle size were conflicting. One suggested that embryos created from oocytes originating from smaller follicles (<12 mm) experienced less cleavage (1), but other investigators found no difference in cleavage rates of embryos derived from oocytes aspirated from follicles greater than or less than 16 mm in size (2). Salha et al. (6) also showed that embryo quality derived from oocytes conventionally inseminated was the same, regardless of follicular size origin.
We and others have shown that day-3 cell number and embryo fragmentation are predictors of implantation (16–19). Hence, we compared the cell number and average day-3 embryo fragmentation separately among the smaller follicle sizes with the lead follicular group. Our results suggest the average cell number of embryos is the same regardless of follicle size (data not shown). However, our data also showed that embryos created from oocytes originating from the lead follicular group have, on average, statistically significantly less fragmentation. To be more specific, the average fragmentation score was approximately 0.7 points less (approximately 10%) for embryos derived from the lead follicle relative to embryos derived from follicles smaller than 10 mm (see Fig. 5). Furthermore, this effect was independent of the method of fertilization. However, the wide range in embryo fragmentation for the smaller follicle sizes suggests that good quality embryos can be derived from oocytes originating from smaller follicle size, albeit at a lesser frequency than from larger follicles.
There are, however, several limitations to our study. There was no assessment of what size lead follicle would determine “postmaturity.” In a subset of data, we obtained 15 oocytes from follicles of 23 mm or greater. Embryos derived from these oocytes had an average fragmentation of 3.1, which is considerably higher than embryos from the other follicular sizes (data not shown). No statistical analysis could be performed due to small numbers, but there is a suggestion that the addition of these larger follicles to the lead follicular cohort (all >18 mm) could have reduced the overall observed effect regarding the impact of follicle size on embryo fragmentation in this study. Furthermore, if confirmed with larger numbers, this would suggest a follicular size for postmaturity also can be determined. This theory is supported by a study that observed decreased development and quality of embryos derived from oocytes undergoing conventional insemination that originated from follicles that were greater than 23 mm in size (5). More studies are needed to evaluate outcomes of postmature follicles, which would further improve decisions regarding timing of the hCG trigger.
Our study design also did not allow for an assessment of implantation rates related to follicle size of origin. The decision regarding embryos selected for transfer was based solely on embryo morphology and not follicle of origin. Thus, transfers included embryos derived from follicles of varying sizes. Although this study may have determined which follicles contain the highest developmentally competent oocytes, it did not directly determine implantation or successful pregnancy.
We have provided further clarification of the relationship of follicle size on IVF outcomes. Our results are in agreement with those of others, which demonstrated that the lead follicular group is the most likely to have a mature oocyte, capable of fertilization, and the one best suited for development into a high quality embryo in vitro. Moreover, we showed the odds of nuclear maturity, fertilization, and development into embryos from oocytes obtained from follicles smaller than the lead follicular group, although the rates only approached 60% of that of the lead follicular group. These results demonstrate the utility of the smaller follicles. Our findings will help explain the outcomes during the in vitro process. Finally, although, more studies are needed, this study paves the way to deriving decision-making models based on follicle size to optimize outcomes from ovarian stimulation.
Footnotes
Presented at the 61st Annual Meeting of the American Society for Reproductive Medicine, October 15–19, 2005, Montreal, Quebec, Canada. Annual meeting program supplement, page S96.
References
- 1.Bergh C, Broden H, Lundin K, Hamberger L. Comparison of fertilization, cleavage and pregnancy rates of oocytes from large and small follicles. Hum Reprod. 1998;13:1912–5. doi: 10.1093/humrep/13.7.1912. [DOI] [PubMed] [Google Scholar]
- 2.Wittmaack FM, Kreger DO, Blasco L, Tureck RW, Mastroianni L, Jr, Lessey BA. Effect of follicular size on oocyte retrieval, fertilization, cleavage, and embryo quality in in vitro fertilization cycles: a 6-year data collection. Fertil Steril. 1994;62:1205–10. doi: 10.1016/s0015-0282(16)57186-6. [DOI] [PubMed] [Google Scholar]
- 3.Miller KF, Goldberg JM, Falcone T. Follicle size and implantation of embryos from in vitro fertilization. Obstet Gynecol. 1996;88:583–6. doi: 10.1016/0029-7844(96)00241-4. [DOI] [PubMed] [Google Scholar]
- 4.Andersen CY. Characteristics of human follicular fluid associated with successful conception after in vitro fertilization. J Clin Endocrinol Metab. 1993;77:1227–34. doi: 10.1210/jcem.77.5.7521343. [DOI] [PubMed] [Google Scholar]
- 5.Ectors FJ, Vanderzwalmen P, Van Hoeck J, Nigs M, Verhaegen G, Delvigne A, et al. Relationship of human follicular diameter with oocyte fertilization and development after in-vitro fertilization or intracytoplasmic sperm injection. Hum Reprod. 1997;12:2002–5. doi: 10.1093/humrep/12.9.2002. [DOI] [PubMed] [Google Scholar]
- 6.Salha O, Nugent D, Dada T, Kaufmann S, Levett S, Jenner L, et al. The relationship between follicular fluid aspirate volume and oocyte maturity in in-vitro fertilization cycles. Hum Reprod. 1998;13:1901–6. doi: 10.1093/humrep/13.7.1901. [DOI] [PubMed] [Google Scholar]
- 7.Crozet N, Ahmed-Ali M, Dubos MP. Developmental competence of goat oocytes from follicles of different size categories following maturation, fertilization and culture in vitro. J Reprod Fertil. 1995;103:293–8. doi: 10.1530/jrf.0.1030293. [DOI] [PubMed] [Google Scholar]
- 8.Rosen MP, Shen S, Dobson AT, Fujimoto VY, McCulloch CE, Cedars MI. Oocyte degeneration after intracytoplasmic sperm injection: a multivariate analysis to assess its importance as a laboratory or clinical marker. Fertil Steril. 2006;85:1736–43. doi: 10.1016/j.fertnstert.2005.12.017. [DOI] [PubMed] [Google Scholar]
- 9.Dubey AK, Wang HA, Duffy P, Penzias AS. The correlation between follicular measurements, oocyte morphology, and fertilization rates in an in vitro fertilization program. Fertil Steril. 1995;64:787–90. doi: 10.1016/s0015-0282(16)57855-8. [DOI] [PubMed] [Google Scholar]
- 10.Ji YZ, Bomsel M, Jouannet P, Wolf JP. Modifications of the human oocyte plasma membrane protein pattern during preovulatory maturation. Mol Reprod Dev. 1997;47:120–6. doi: 10.1002/(SICI)1098-2795(199705)47:1<120::AID-MRD16>3.0.CO;2-5. [DOI] [PubMed] [Google Scholar]
- 11.Kubiak JZ. Mouse oocytes gradually develop the capacity for activation during the metaphase II arrest. Dev Biol. 1989;136:537–45. doi: 10.1016/0012-1606(89)90279-0. [DOI] [PubMed] [Google Scholar]
- 12.Alikani M, Palermo G, Adler A, Bertoli M, Blake M, Cohen J. Intracytoplasmic sperm injection in dysmorphic human oocytes. Zygote. 1995;3:283–8. doi: 10.1017/s0967199400002707. [DOI] [PubMed] [Google Scholar]
- 13.Balaban B, Urman B, Sertac A, Alatas C, Aksoy S, Mercan R. Oocyte morphology does not affect fertilization rate, embryo quality and implantation rate after intracytoplasmic sperm injection. Hum Reprod. 1998;13:3431–3. doi: 10.1093/humrep/13.12.3431. [DOI] [PubMed] [Google Scholar]
- 14.Ebner T, Yaman C, Moser M, Sommergruber M, Feichtinger O, Tews G. Prognostic value of first polar body morphology on fertilization rate and embryo quality in intracytoplasmic sperm injection. Hum Reprod. 2000;15:427–30. doi: 10.1093/humrep/15.2.427. [DOI] [PubMed] [Google Scholar]
- 15.Xia P. Intracytoplasmic sperm injection: correlation of oocyte grade based on polar body, perivitelline space and cytoplasmic inclusions with fertilization rate and embryo quality. Hum Reprod. 1997;12:1750–5. doi: 10.1093/humrep/12.8.1750. [DOI] [PubMed] [Google Scholar]
- 16.Hsu MI, Mayer J, Aronshon M, Lanzendorf S, Muasher S, Kolm P, et al. Embryo implantation in in vitro fertilization and intracytoplasmic sperm injection: impact of cleavage status, morphology grade, and number of embryos transferred. Fertil Steril. 1999;72:679–85. doi: 10.1016/s0015-0282(99)00320-9. [DOI] [PubMed] [Google Scholar]
- 17.Terriou P, Sapin C, Giorgetti C, Hans E, Spach JL, Roulier R. Embryo score is a better predictor of pregnancy than the number of transferred embryos or female age. Fertil Steril. 2001;75:525–31. doi: 10.1016/s0015-0282(00)01741-6. [DOI] [PubMed] [Google Scholar]
- 18.Giorgetti C, Terriou P, Auquier P, Hans E, Spach JL, Salzmann J, Roulier R, et al. Embryo score to predict implantation after in-vitro fertilization: based on 957 single embryo transfers. Hum Reprod. 1995;10:2427–31. doi: 10.1093/oxfordjournals.humrep.a136312. [DOI] [PubMed] [Google Scholar]
- 19.Shen S, Rosen MP, Dobson AT, McCulloch CE, Rinaudo P, Cedars MI. While day 3 embryo fragmentation significantly impacts implantation, it has no impact on clinical pregnancy loss [abstract P-390] Fertil Steril. 2005;84(Suppl):S290. [Google Scholar]


