Abstract
The use of flexible micro-electro-mechanical systems (MEMS) based device provides a unique opportunity in bio-medical robotics such as characterization of normal and malignant tissues. This paper reports on design and development of a flexible MEMS-based sensor array integrating mechanical and electrical sensors on the same platform to enable the study of the change in electro-mechanical properties of the benign and cancerous breast tissues. In this work, we present the analysis for the electrical characterization of the tissue specimens and also demonstrate the feasibility of using the sensor for mechanical characterization of the tissue specimens. Eight strain gauges acting as mechanical sensors were fabricated using poly(3,4-ethylenedioxythiophene) poly(styrenesulfonate) (PEDOT:PSS) conducting polymer on poly(dimethylsiloxane) (PDMS) as the substrate material. Eight electrical sensors were fabricated using SU-8 pillars on gold (Au) pads which were patterned on the strain gauges separated by a thin insulator (SiO2 1.0μm). These pillars were coated with gold to make it conducting. The electromechanical sensors are integrated on the same substrate. The sensor array covers 180μm × 180μm area and the size of the complete device is 20mm in diameter. The diameter of each breast tissue core used in the present study was 1mm and the thickness was 8μm. The region of interest was 200μm × 200μm. Microindentation technique was used to characterize the mechanical properties of the breast tissues. The sensor is integrated with conducting SU-8 pillars to study the electrical property of the tissue. Through electro-mechanical characterization studies using this MEMS-based sensor, we were able to measure the accuracy of the fabricated device and ascertain the difference between benign and cancer breast tissue specimens.
Keywords: Flexible MEMS, Electro-mechanical tissue characterization, Breast cancer, Piezoresistive force sensor, Atomic force microscopy
1. Introduction
The advancement of surgical procedures and surgical tools and the need for miniaturization of diagnostic and therapeutic devices has resulted in tremendous growth in the research on microelectromechanical systems (MEMS) devices. MEMS devices are small in size and can be batch fabricated at low cost, thereby having a competitive advantage over other devices. One of the fastest growth areas is incorporating MEMS devices on surgical tools which facilitate the surgeon by providing real-time force feedback, measuring tissue density, temperature and providing more precise method for tissue cutting and extraction and thus improving surgical outcomes [1-7]. To use the MEMS devices for surgical and bio-medical application, there are fabrication challenges apart from integrating it with electronics, signal processing, calibration and device packaging [4-5]. Recently, much attention is focused on flexible, or skin-like sensor array with multiscale architectures for detecting mechanical, chemical, thermal, and optical changes [8-17].The capability of analyzing and manipulating the biological materials at microscale and nanoscale and the possibility of incorporating it into portable lab-on-a-chip devices makes the MEMS sensor a potential candidate for diagnostic capabilities [18-26]. Each year in USA alone, more than 200,000 breast cancer cases are diagnosed [27]. The transformation from benign to cancerous state changes the morphological signatures in the tumor environment [23,25]. Mechanical and electrical phenotyping have been demonstrated as promising techniques to study the progression of the breast cancer [18-22, 26]. However, to our knowledge, there are no prior studies involving flexible MEMS device for simultaneous electro-mechanical characterization of tissue. Thus, a device capable of performing mechanical and electrical characterization of breast tissue quickly, accurately and simultaneously at the microscale will potentially open new avenues for breast cancer diagnosis. Since, for the mechanical characterization, nanoindentation is a common technique [21,23], the device should be sensitive to measuring forces in the range of nano-to-micro Newton. A piezoresistive sensor proves to be an effective tool to study biomechanics property of the tissue as it can be microfabricated in array format and does not require complex electronics like atomic force microscopy (AFM) [26]. Although, silicon is used for fabrication of piezoresistive sensors [29-39], it is a brittle material and to piezoresistive sensor process technologies from silicon require high-temperature process steps. In addition, it has a high Young's modulus and thus for achieving large deflections the mechanical structures needs to be thin which deteriorates the mechanical strength of the device.
A conductive polymer, namely poly(3,4-ethylenedioxythiophene) poly(styrenesulfonate) (PEDOT:PSS) has a high sheet resistance than other conductive polymer, strong mechanical bending and ease of use which makes it a viable option to fabricate strain gauge sensors [40-43]. Poly(dimethylsiloxane) (PDMS) being able to use in rapid prototyping with soft lithography and acting as a compliant polymer having moduli on the order of 1 MPa is explored for development of microfluidics [44,45]. Combining the advantage of the flexibility of PDMS and conductivity of PEDOT:PSS, an array of the mechanical sensor can be fabricated.
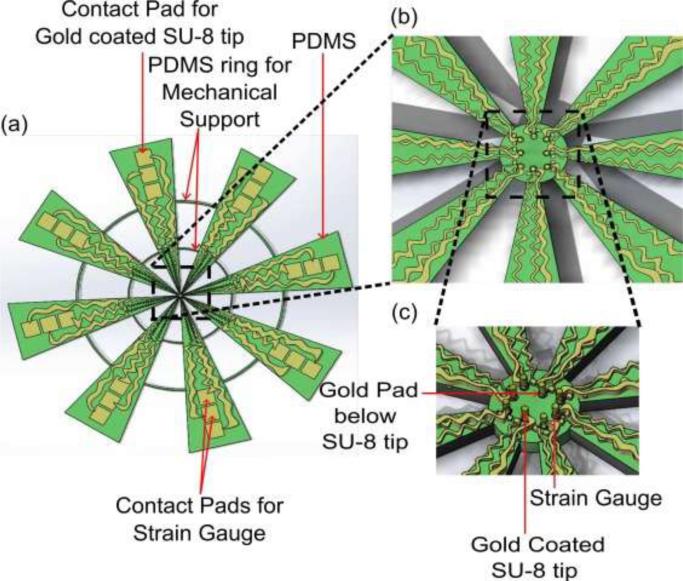
To our knowledge, the simultaneous detection of electro-mechanical properties of tissue at micro-scale has not been studied and there is no device available to study these properties in a high throughput manner. In this paper, we report on the design, fabrication and characterization of novel flexible MEMS sensor array which is capable of measuring nano-to-micro Newton force and having electrically conductive SU-8 pillars integrated on the mechanical sensors to facilitate force measurement and apply electrical signal to the tissue. The emphasis is on the fabrication of the flexible MEMS device and its application for electro-mechanical characterization of breast tissue. The schematic diagram of the flexible electro-mechanical sensor array is shown in Fig. 1.
Figure 1.
Flexible MEMS device. (a) schematic diagram, (b) magnified schematic of sensor array top view, and (c) angled view.
2. Experiments
2.1 Sensor Fabrication
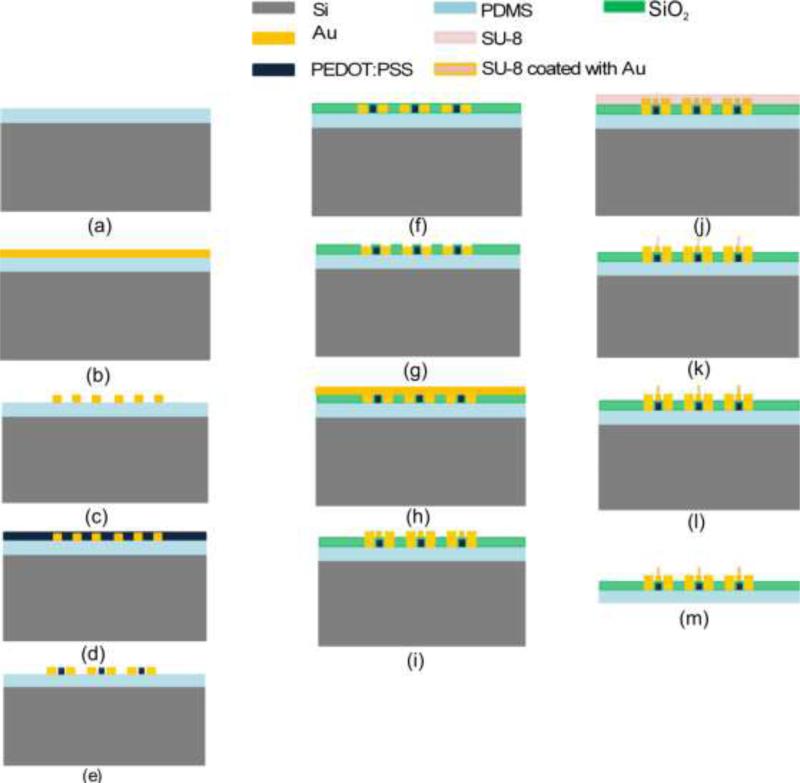
The electro-mechanical sensor array is fabricated on the PDMS polymer substrate. PDMS (SYLGARD®184 from Sigma Aldrich) is coated on a 4-inch silicon (Si) wafer and the sensing layers are built one on another subsequently. The Si provides structural support during the fabrication. The process flow for the device is shown in Fig. 2.
Figure 2.
Process flow for flexible electro-mechanical sensor array.
Six mask processes were used to fabricate the flexible electro-mechanical device. The fabrication process is as follows: (a) PDMS (140μm) was spin coated on Si wafers followed by curing at 90°C for 12 hours in furnace, (b) Chrome/gold (Cr/Au) (20nm/500nm) was deposited by using e-beam evaporator. As the PDMS and the metal deposited on PDMS cracked when the photoresist is prebaked at 90°C, an alternate approach was used in which the positive photoresist on metal coated PDMS was settled down for 6 minutes followed by baking in oven for 1 minute at 60°C before UV exposure. This method keeps the PDMS and metal film intact.
(c) Cr/Au was patterned to form electrodes for mechanical sensors (strain gauges), (d,e) PEDOT:PSS was spin coated and patterned to form array of strain gauges (0.6μm thick), (f,g) Silicon dioxide (SiO2 0.8μm) was deposited using low temperature (80°C) plasma-enhanced chemical vapor deposition (PECVD) and patterned to open contact pads for electrical connection, (h,i) Cr/Au (20nm/500nm) was deposited using e-beam evaporator and patterned to form electrode for electrical sensors, (j,k) SU-8 2025 was spin coated and patterned to form pillars of 30μm diameter and 50μm height, (l) SU-8 pillars were coated with Cr/Au using e-beam evaporation and lift-off technique to make it electrically conductive. The angle between the wafer and the gold evaporation source was kept at 45 degrees. The final part of the process was to release the complete device from Si wafer to facilitate sensor array mounting (m). The PDMS was peeled off from Si wafer to realize the device. The electro-mechanical sensor array covers 180μm × 180μm area while the complete device is 20mm in diameter. The goal of the device is to measure the changes in the benign and cancerous breast tissue core and the dimensions of the active region (sensor array) was selected accordingly. The region of interest in breast tissue core is 180μm × 180μm in the present case. The diameter of the device was selected so as to facilitate the attachment of the device with the holder for experimental measurements. The length of the device could be changed depending on the holder design, but the active region dimensions need to be kept fixed.
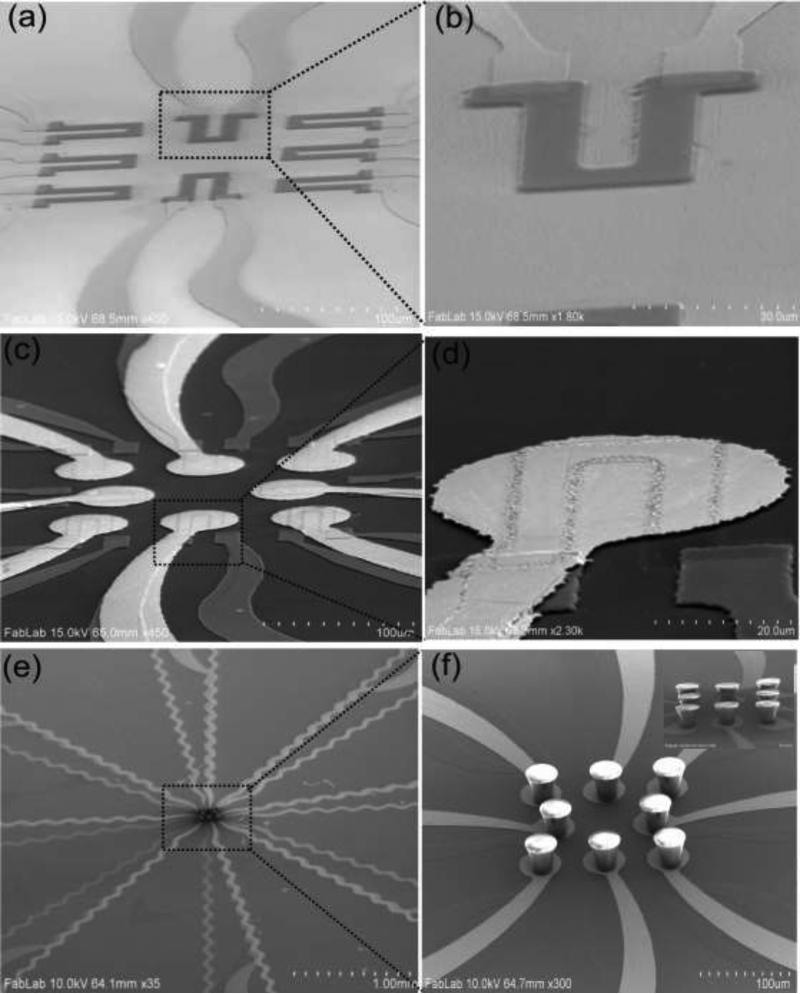
The scanning electron microscopy (SEM) image of the mechanical sensor array and single strain gauge sensor is shown in Fig. 3(a) and 3(b). The strain gauge made from PEDOT:PSS polymer can withstand much larger strain due to its flexibility [46] while maintaining its conductivity which is not the case in metal based strain gauges [47]. Each strain gauge was 50μm × 70μm in size. Fig. 3(c) shows an array of Cr/Au electrodes/SiO2/strain gauges. The circular Cr/Au pad (50μm diameter) was used as the base for electrical contact to the SU-8 pillar (see Fig. 3(d)). Figure 3(e) shows the array of conducting SU-8 pillars integrated on the gold pads and 3(f) shows the magnified image of SU-8 pillars with top surface shining due to metal coating. It is to be noted that the top and only one side of SU-8 pillar was coated and not entire pillar, since it is necessary to obtain an electrical contact from the tip of the SU-8 pillar to the base to enable the measurement of the electrical property of the tissue.
Figure 3.
Sensor fabrication SEM images. (a) strain gauge array and (b) single strain gauge, (c) array of devices showing gold pads/SiO2/strain gauge, (d) magnified image of single device, (e) array of gold coated SU-8 pillars/gold pads/SiO2/strain gauges and (f) magnified images of SU-8 pillars on gold pads (inset shows gold coated SU-8 pillars on gold pads).
These pillars serve a dual purpose in our device design namely: (a) transferring the force to strain gauge and (b) acting as the conductive probe for electrical characterization (Electrode E1).
The SU-8 pillar diameter was kept at 30μm as it has two advantages: (a) Ease of alignment at the center of the gold pad, which is 50μm in diameter, and (b) metal coating using liftoff technique is easy if the pillar size is less than the gold pad. The spacing between the pillars was chosen to facilitate the metal coating on SU-8 pillars.
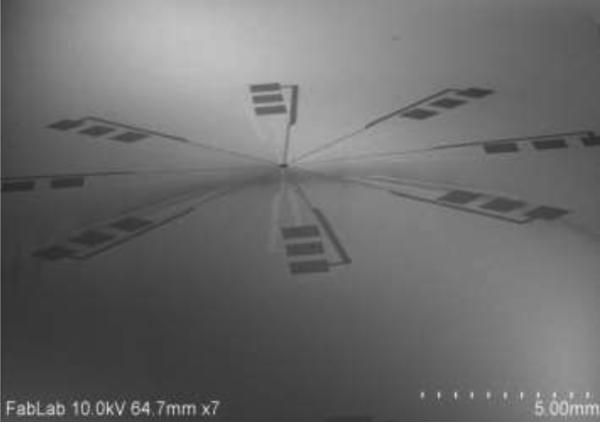
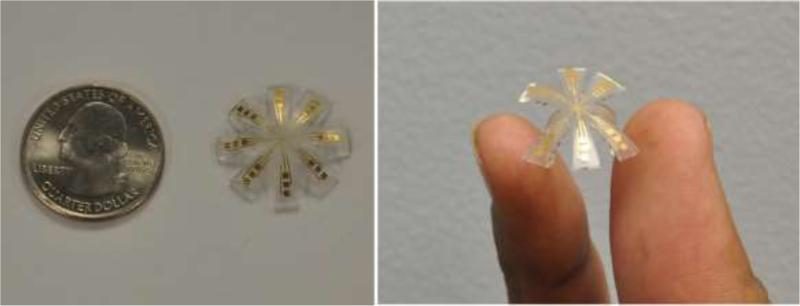
The SEM image of realized device is shown in Fig. 4, while Fig. 5 shows the photo of the flexible electro-mechanical device.
Figure 4.
SEM image of the device.
Figure 5.
Photos of flexible MEMS-based device
The connection from the electro-mechanical sensor array to the contact pads (1mm × 1mm) is through gold serpentine geometry to enable a compact footprint for routing the measured signal to the electrical circuit.
2.2 Strain detection mechanism for mechanical sensors
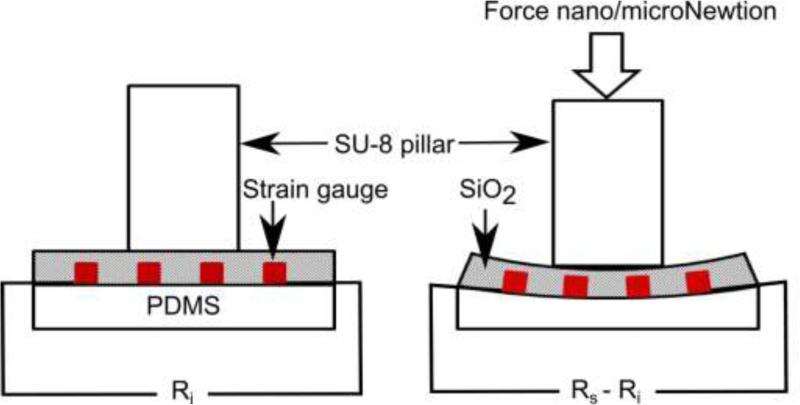
Due to the piezoresistive effect, the electrical resistance of the film is proportional to the strain of the film [48]. The schematic diagram of strain sensing mechanism is shown in Fig. 6.
Figure 6.
Strain sensing mechanism for PEDOT:PSS based sensor.
The known force value using AFM cantilever is applied on the SU-8 pillar resulting in bending of the strain sensor and corresponding change in resistance is measured. The gauge factor G is given by following relationship:
| (1) |
where, ε, Ri and Rs are the strain, initial resistance of the sensor, and sensor resistance on curved surface, respectively.
The gauge factor calculation determines the strain from the change in resistance. When the strain gauge integrated on flexible substrate is deformed to form curved surface, it results in surface strain ε given by:
| (2) |
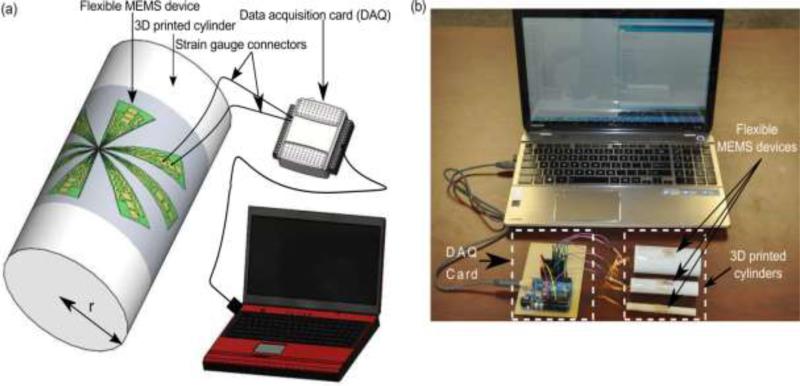
where, r is the radius of curvature and t is the substrate thickness. The substrate (PDMS) thickness was 140μm in the present study. To measure the gauge factor of the strain gauges, the flexible device was placed on the curved surface of cylinders with different radii. The schematic representation and photo of actual measurement setup for measuring the gauge factor is shown in Fig. 7.
Figure. 7.
Measuring electrical output from single strain sensor. (a) schematics, and (b) experimental setup.
The change in resistance ΔR, strain ε and gauge factor G are then calculated. The resistance of the strain gauges was measured to be 1.2 ± 0.1 kΩ in its undeformed configuration. The induced strains in the sensor were found to be 1.4, 0.7 and 0.35 when placed on the cylinder with radii of 5mm, 10mm and 20mm respectively. Using eq. (1), the measured gauge factor of the sensor was determined to be 4.0 ± 0.1.
2.3 Linear Regression Model
For accurate estimation of material properties of the tissue, researchers have studied contact models that describe tissue behaviors [49] and algorithms finding contact point between a sensor and tissue [50]. Since most of the tissue contact models are based on force-indentation relationship, piezoresistive type sensors that have resistance as an output should be calibrated in terms of force to be applied to conventional contact models. For n number of data sets in calibration, output resistance Rs, and contact F have a linear relationship to the sensor deformation δs, when contact occurs at the kth index. Thus:
| (3) |
| (4) |
where the values αj = [αj1(Ω) αj2(Ω/μm)] ; (j=1,2) are linearly regressed parameters in the non-contact and contact regime, respectively, ks is the calibrated spring constant of the sensor and εj ; (j=1,2) are the errors that typically have different distribution depending on the material interaction with the sensor [51]. In this model, ε1 is caused by the viscous interaction between the sensor and PBS solution covering the tissue, while ε2 are primarily results from sensor-tissue friction. Material properties in conventional contact models vary with the determination of contact point within the same data set. The contact point can be determined by a variety of methods such as estimating the location of a threshold slope [52], curve fitting [53], and statistical modeling [50]. One of the advantages of the sensor that we have developed is that it allows current flow on contact and hence it acts as a switch to detect when the contact has occurred.
In AFM studies for tissue indentation [50], the deformation depth of tissue can be calculated in the contact region (k +1 ≤ i ≤ n) as the difference of sensor deflection with respect to sensor position in the Z direction as shown in eq.(5). Thus:
| (5) |
By using the tissue deformation and force data, elastic modulus of tissue can be estimated by Zhang's contact model of a cylindrical tip that requires geometric information (of the tissue and the indenter), reaction force, and tissue deformation depth [54].
3. Result and Discussions
3.1. Spring constant measurement
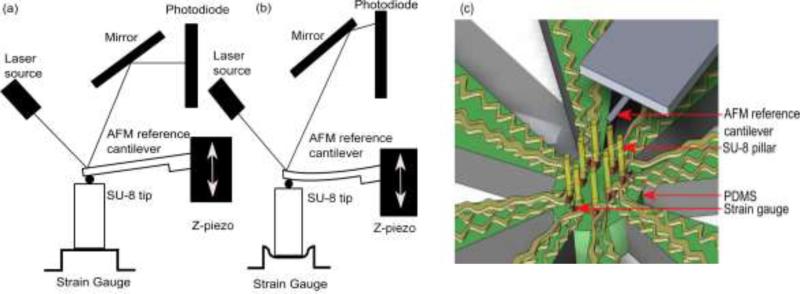
To measure the spring constant of the strain gauge sensor, we have used an AFM probe (pre-calibrated) as a reference cantilever and pressed it on the SU-8 pillar with a known force (see Fig. 8).
Figure 8.
Schematic diagram of the AFM configuration used for spring constant measurement of PEDOT:PSS strain gauge using reference cantilever method. 2D representation of (a) AFM cantilever in contact with SU-8 pillar/strain gauge, (b) AFM cantilever pressed against the SU-8 pillar/strain gauge to a preset force value, and (c) 3D representation of spring constant measurement.
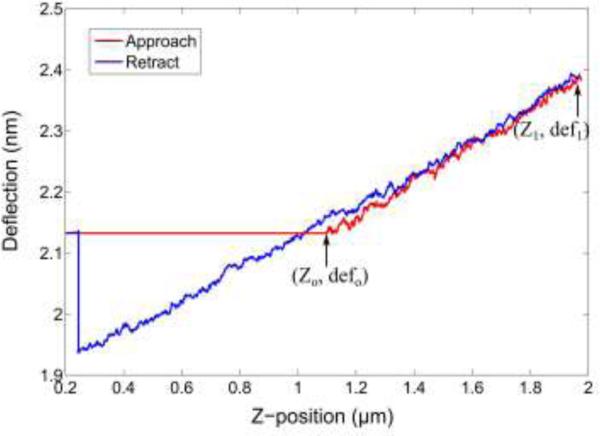
The spring constant kref of the AFM probe was calibrated using the thermal method [55,56]. The AFM force curve is obtained from the end of test cantilever upon pressing the SU-8 pillar. The measured transmitted force is given by:
| (6) |
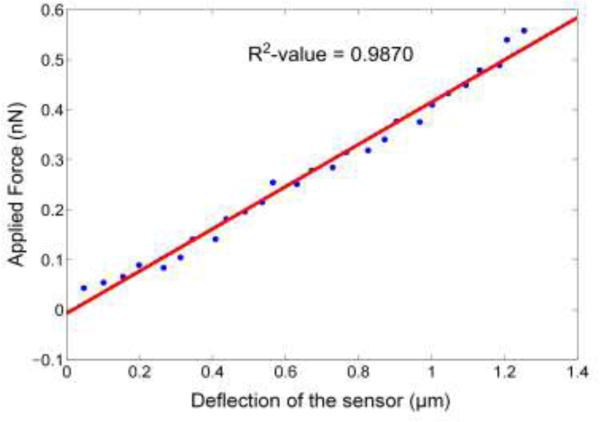
where, def0 and def1 are the initial and final deflection of the AFM cantilever which is sensed by the photodiode (see Fig. 8 and Fig. 9). The deflection in the sensor, δs, is given by the difference in the net deflection of the test cantilever and Z-travel [57]. Figure 10 shows the deflection of the sensor δs for increasing force values. The spring constant of the fabricated sensor was 0.42 nN/μm. The goodness of fit (R2-value) was found to be 0.9870, which shows that the sensor has a linear response.
Figure 9.
AFM force curve on the SU-8 pillar/strain gauge/PDMS.
Figure 10.
Spring constant measurement of sensor.
3.2. Tissue Preparation and Annotation
To facilitate the electro-mechanical characterization of the tissue, a gold pad having micro-grids (Electrode E2) was fabricated on glass wafer to hold the tissue. Cr/Au (20nm/800nm) was deposited using e-beam evaporation and patterned to form micro-grids. Figure 11(a) and (c) show the SEM images of the gold pad having micro-grid and tissue placed on micro-grid, respectively.
Figure 11.
SEM image of (a) micro-grid, (b) crumpled micro-grid, and (c) breast tissue core placed on micro-grid.
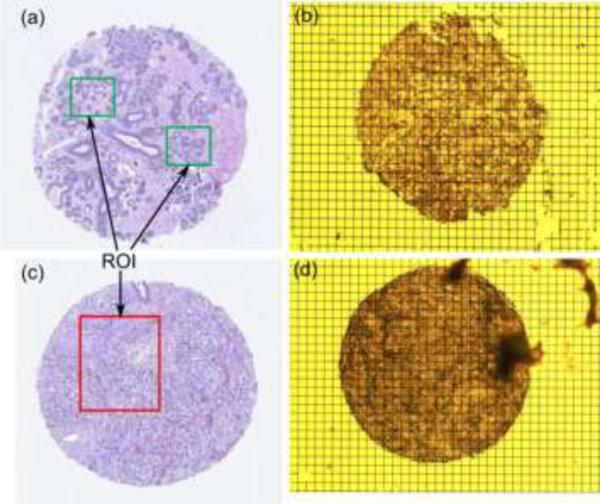
The glass wafer needs to be moisture free to enhance the adhesion of Cr/Au. Failure to which resulted in the crumpled micro-grid as shown in Fig. 11(b). The inverted microscope was used for observing the tissue samples and thus we have used grid instead of using a thick pad. The tissue is placed on the conducting micro-grid. Formalin-fixed paraffin-embedded tumor and normal breast tissue blocks were carefully identified from Biospecimen Repository at Rutgers Cancer Institute of New Jersey. With guidance of an annotated adjacent hematoxylin and eosin (H&E) slice, one sample of tissue core (1mm diameter) was extracted from each tissue block and inserted into an individual pre-punctured paraffin blocks to make a mini-tissue microarray (TMA) using tissue microarrayer Breecher ATA-27. The mini-TMAs were sectioned at 8μm thickness and carefully placed at the center of the gold pad containing micro-grids in 42-44°C water bath. The TMAs placed on the grids were de-paraffinized and stored in PBS until the experiment. An adjacent 5mm section of each mini-TMA was stained, digitized into whole slide image, as well as quality controlled and annotated by a certified pathologist. The whole slide images, with designated tissue regions highlighted as tissue annotation were stored at the Rutgers Cancer Institute of New Jersey whole slide image web service. Figure 12 shows the (H&E) and optical image of benign and cancerous breast tissue used in present work. Green and red areas are the regions of interest.
Figure 12.
Breast tissue core (a) and (b) H&E image and optical image of benign sample, (c) and (d) H&E image and optical image of cancerous sample.
3.3. Sensitivity Measurement and Sensor Performance of the Breast Tissue
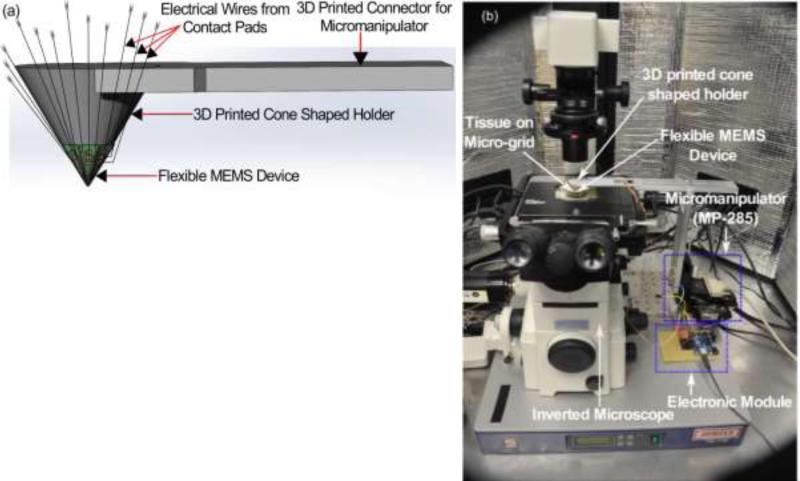
The strain gauges used for mechanical characterization change their resistance on applying strain and these strain values are measured to voltage by an electronic module consisting of multiplexer and data acquisition card. To measure the sensitivity of the sensor array, the device was mounted on a 3D printed cone shaped holder (see Fig. 13) which was attached to the micromanipulator MP-285. Using MP-285, the device was pressed down on a glass substrate to measure its sensitivity. For ease of approaching, we assumed right angle contact only during the measurement. Since the sensor output caused by bending of the pillar from inclined indentation are not distinguished from the output of z-direction compression of the pillar that we intended, we assumed that the pillar contacts the tissue at right angle (90 degree).
Figure 13.
Device mounted on cone shape holder for mechanical and electrical characterization. (a) schematic and (b) actual photograph.
To avoid inclined contact, the area of the sensor where the pillars are located was mounted on the flat tip of the cone shape holder and maximum height of the profile (i.e. difference between maximum peak height and maximum valley depth) of the tissue was under 0.5μm, which was much smaller compared to the dimension of the pillars.
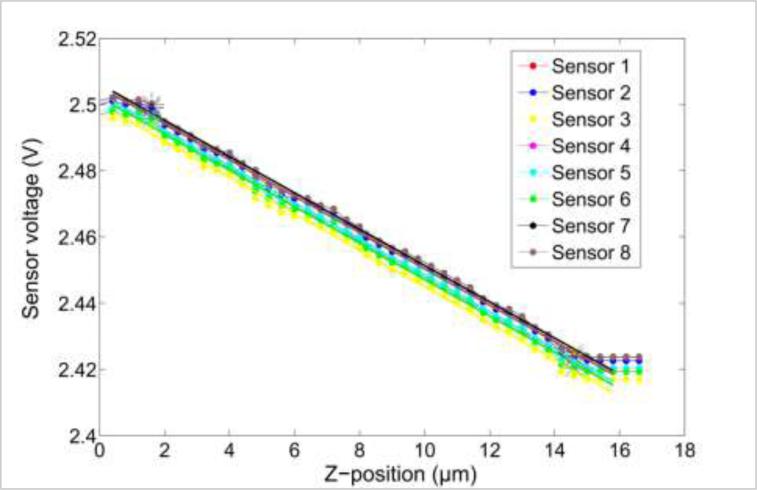
A linear regression model was used to find the correlation between the changes in the sensor reading to the sensor displacement (see Fig. 14). Figure 14 is the output voltage obtained from the sensor array and is a linear fit when pressed on the glass substrate. The data obtained is used to calculate the force from each sensor using linear regression model. The average goodness of fit (R2-value) was found to be 0.9966, which shows that the sensor has a linear response. The average sensitivity of the eight sensors was found to be 4.2308 × 10⁻⁴ V/μm.
Figure 14.
Sensitivity measurement of fabricated sensor array.
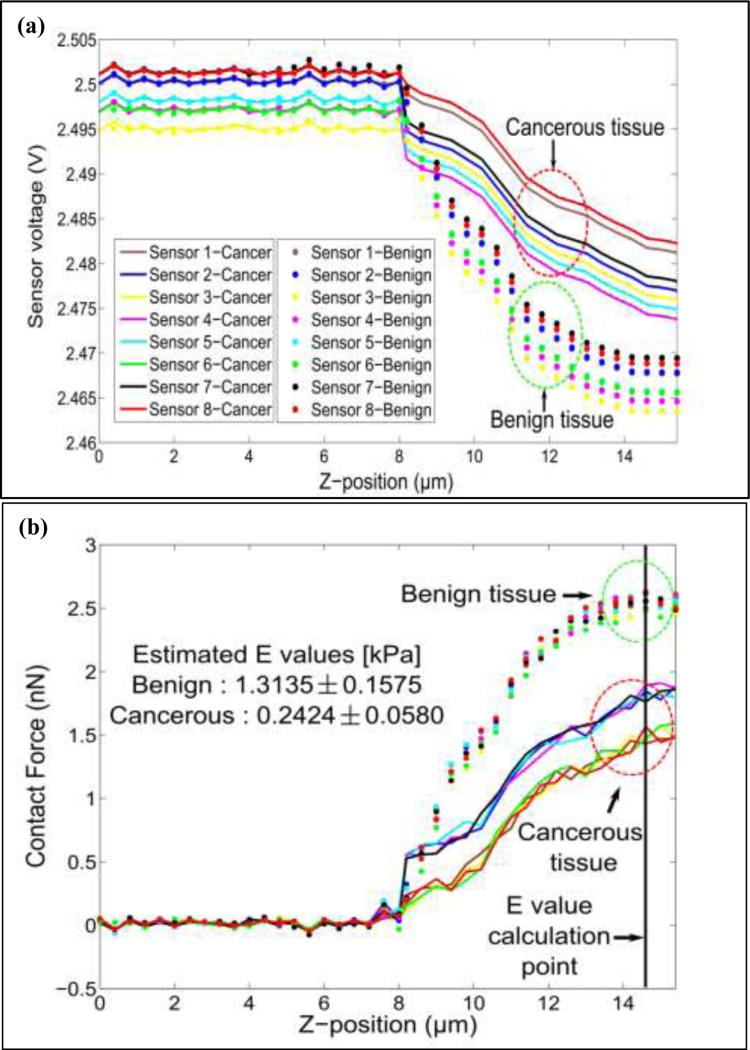
The sensor was pressed down on benign and cancerous tissue for 7μm. A clear demarcation between benign and cancerous breast tissue cores was obtained. It was further observed that, for the same z-displacement, the change in voltage for benign core was higher than that for the cancerous breast tissue core (see Fig. 15(a)). We have plotted the force vs. Z-position obtained from the benign and cancerous breast tissue by pressing the sensor array on the tissue for 7μm depth (Fig. 15(b)). The tissue elasticity is estimated by using Zhang's contact model [54] with a cylindrical tip and is given by:
| (7) |
where, F is contact force, ν is Poisson's ratio, r is the radius of indenter, δt is the tissue deformation, and κ value is a unitless coefficient determined by the geometry of the indenter.
Figure 15.
(a) Mechanical characterization: response of device on benign and cancerous breast tissue. (b) Force curves obtained from normal and cancerous breast tissue.
The spring constant of the sensor and sensor deflection were obtained from the measured spring constant (section 3.1) and linear regression model (section 2.3), respectively. Multiplication of these two values yields contact force and δt is determined by the difference between Z-position of the manipulator and sensor deflection. By using the table of κ-values, assuming that the tissue is incompressible [54], the elasticity of the tissue can be determined.
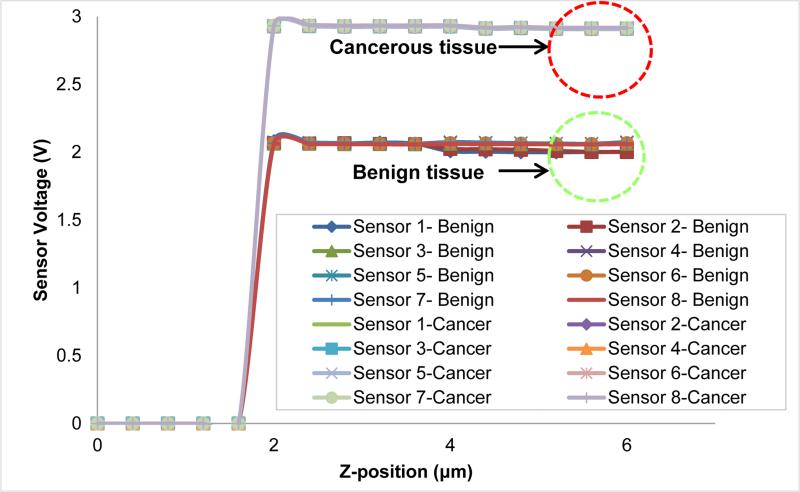
The values of tissue elasticity estimated from the observed reaction force (see Fig. 15(b)) when the sensor is pressed down to 7μm on benign and cancerous tissue are 1.3135 ± 0.1575 [kPa] and 0.2424 ± 0.0580 [kPa], respectively. It is important to note that since the sensor is also inherently flexible, not all of the 7μm motion of the tissue after contacting the tissue is translated to the deformation of the tissue. We kept the sensor motion of 7μm constant in all trials for consistency. Our findings match the observations in our prior work [57, 58], indicating that for the micron size breast tissue, the stiffness of normal tissues is higher than cancerous tissue cores. For the micron size breast tissue core (8μm thick in the present case), the electrically conductive SU-8 pillars (E1) provides an easy way to complete the electrically conducting path. The height of the SU-8 pillars was kept at 50μm as it facilitated in electrical measurements without breaking. Increasing the height of pillars to 100μm caused breakage of pillars while decreasing the size to 20-30μm made electrical measurements difficult. To measure the electrical resistance of the breast tissue, a constant voltage is applied between electrode E1 and electrode E2. When the electrode (E1) touches the tissue sample, the current passes through the top electrode (E1) through the breast tissue to the bottom electrode (E2). Depending on the resistance of the breast tissue, the current passing through the tissue would be different and that is reflected in the measured voltage. Figure 16 shows the voltage values obtained from the sensor when pressed down (about 4μm) on the tissue core. From Fig. 16, we observed that there is a difference in the conductivity of the breast tissue between benign and cancerous tissue cores. It is important to note that a variety of other electrical signals of varying frequency can be passed through the tissue and that the tissue resistance is not the only electrical parameter for characterizing the tissue electrical properties. Another important parameter of the electrical property of the tissue could be the electrical impedance of the tissue itself.
Figure 16.
Electrical characterization: response of device on benign and cancerous breast tissue.
The goal of the present work was to fabricate flexible sensor array and to explore it as a possible candidate for electro-mechanical measurements of micron size tissue cores. Thus, only one sample of each type (benign and cancer) is used for measurement. More extensive studies of benign and diseased breast tissue cores are required for a stronger claim of the capability of a device to delineate the type of tissue core.
4. Conclusion
This paper represents the fabrication and characterization of the flexible MEMS-based device with the possibility of simultaneous electro-mechanical analysis of tissue. The results obtained from the initial experiments shows a flexible MEMS device that can be used to delineate the breast cancer tissue from the benign tissue based on mechanical and electrical measurements. The device is not only simple but also small enough to report tissue changes at the microscopic level. In our future work, simultaneous electro-mechanical phenotyping of breast tissue to determine the malignancy in tissues as well was the stage of disease progression from the onset of the disease is envisaged. The present MEMS-based device is not only a potential candidate for breast cancer diagnosis but for other diseases in which the biomechanical changes occur in the tissue from the onset to progression.
Acknowledgement
Research reported in this publication was supported by the National Cancer Institute of the National Institutes of Health under Award Number R01CA161375. The content is solely the responsibility of the authors and does not necessarily represent the official views of the National Institutes of Health. We acknowledge Dr. David J. Foran, Dr. Wenjin Chen, Dr. Marina Chekmareva, Dr. Lauri Goodell from Rutgers Robert Wood Johnson Medical School as well as Lei Cong and Lucyann Franciosa from Rutgers Cancer Institute of New Jersey for participating in experiment design and sample selection, preparation and digitization. We also acknowledge the support of Maryland Nanocenter for SEM images and sensor fabrication facilities, as well as Histopathology and Imaging Shared Resources at the Rutgers Cancer Institute of New Jersey (P30CA072720) for tissue archive and specimen preparation.
References
- 1.Xie T, Xie H, Fedder G, Zeidel M, Pan Y. Endoscopic optical coherence tomography with a micromachined mirror. Proceedings of 2nd Annu. Int. IEEE-EMBS Special Topic Conf. Microtechnology Medicine and Biology. 2002:208–211. [Google Scholar]
- 2.Goosen JFL, Tanase D, French PJ. Silicon Sensors for use in catheters. Proceedings of 1st Annu. Int. IEEE-EMBS Special Topic Conf. Microtechnologies Medicine and Biology. 2000:152–155. [Google Scholar]
- 3.Goosen JFL, French PJ, Sarro PM. Pressure, flow, and oxygen saturation sensors on one chip for use in catheters. Proceedings of 13th Annu. Int. Workshop on Micro Electro Mechanical Systems. 2000:537–540. [Google Scholar]
- 4.Tatar F, Millinger J, Den Dulk RC, van Duyl WA, Goosen J, Bossche A. Ultrasonic sensor system for measuring position and orientation of laproscopic instruments in minimal invasive surgery. Proceedings of 2nd Annu. Int. IEEE-EMBS Special Topic Conf. Microtechnology Medicine and Biology. 2000:301–304. [Google Scholar]
- 5.Dario P, Menciassi A, Stefanini C, Accoto D. Miniaturization of biomedical micromachines. Proceedings of 2nd Annu. Int. EEE-EMBS Special Topic Conf. Microtechnology Medicine and Biology. 2002:291–296. [Google Scholar]
- 6.Polla D, Erdman A, Peichel D, Rizq R, Gao Y, Markus D. Precision micromotor for surgery. Proceedings of 1st Annu. Int. IEEE-EMBS Special Topics Conf. Microtechnologies Medicine and Biology. 2000:180–183. [Google Scholar]
- 7.Polla D, Erdman A, Robbins W, Markus D, Diaz-Diaz J, Rizq R, Nam Y, Brickner HT, Wang A, Krulevitch P. Microdevices in medicine. Annu. Rev. Biomed. Eng. 2002;2:551–576. doi: 10.1146/annurev.bioeng.2.1.551. [DOI] [PubMed] [Google Scholar]
- 8.Kim DH, Lu N, Ma R, Kim YS, Kim RH, Wang S, Wu J, Won SM, Tao H, Islam A, Yu KJ, Kim T. i., Chowdhury R, M. Y., Xu L, Li M, Chung HJ, Keum H, McCormick M, Liu P, Zhang YW, Omenetto FG, Huang Y, Coleman T, Rogers JA. Epidermal Electronics. Science. 2011;333:838–843. doi: 10.1126/science.1206157. [DOI] [PubMed] [Google Scholar]
- 9.Takei K, Takahashi T, Ho JC, Ko H, Gillies AG, Leu PW, Fearing RS, Javey Ali. Nanowire active-matrix circuitry for low-voltage macroscale artificial skin. Nature Mater. 2010;9:821–826. doi: 10.1038/nmat2835. [DOI] [PubMed] [Google Scholar]
- 10.Lipomi DJ, Vosgueritchian M, Tee BCK, Hellstrom SL, Lee JA, Fox CH, Bao Z. Skin-like pressure and strain sensors based on transparent elastic films of carbon nanotubes. Nature Nanotech. 2011;6:788–792. doi: 10.1038/nnano.2011.184. [DOI] [PubMed] [Google Scholar]
- 11.Mannsfeld SCB, Tee BC-K, Stoltenberg RM, Chen CVH-H, Barman S, Muir BVO, Sokolov AN, Reese C, Bao Z. Highly sensitive flexible pressure sensors with microstructured rubber dielectric layers. Nature Mater. 2010;9:859–864. doi: 10.1038/nmat2834. [DOI] [PubMed] [Google Scholar]
- 12.Yamada T, Hayamizu Y, Yamamoto Y, Yomogida Y, Najafabadi AI, Futaba DN, Hata K. A stretchable carbon nanotube strain sensor for human-motion detection. Nature Nanotech. 2011;6:296–301. doi: 10.1038/nnano.2011.36. [DOI] [PubMed] [Google Scholar]
- 13.McAlpine MC, Ahmad H, Wang DW, Heath JR. Highly ordered nanowire arrays on plastic substrates for ultrasensitive flexible chemical sensors Nature Mater. 2007;6:379–384. doi: 10.1038/nmat1891. [DOI] [PMC free article] [PubMed] [Google Scholar]
- 14.Sekitani T, Noguchi Y, Hata K, Fukushima T, Aida T, Someya T. A rubberlike stretchable active matrix using elastic conductors. Science. 2008;321:1468–1472. doi: 10.1126/science.1160309. [DOI] [PubMed] [Google Scholar]
- 15.Kim DH, Ahn JH, Choi WM, Kim HS, Kim TH, Song J, Huang YY, Liu Z, Lu C, Rogers JA. Stretchable and foldable silicon integrated circuits Science 320 507-511. 2008 doi: 10.1126/science.1154367. [DOI] [PubMed] [Google Scholar]
- 16.Someya T, Sekitani T, Iba S, Kato Y, Kawaguchi H, Sakurai T. A large-area, flexible pressure sensor matrix with organic field-effect transistors for artificial skin applications. Proc. Natl Acad. Sci. USA. 2004;101:9966–9970. doi: 10.1073/pnas.0401918101. [DOI] [PMC free article] [PubMed] [Google Scholar]
- 17.Someya T, Kato Y, Sekitani T, Iba S, Noguchi Y, Murase Y, Kawaguchi H, Sakura T. Conformable, flexible, large-area networks of pressure and thermal sensors with organic transistor active matrixes. Proc. Natl Acad. Sci. USA. 2005;102:12321–12325. doi: 10.1073/pnas.0502392102. [DOI] [PMC free article] [PubMed] [Google Scholar]
- 18.Keese CR, Giaever I. A biosensor that monitors cell morphology with electrical fields. Mater. Today IEEE Eng. Med. Biol. 1994;13:402–408. [Google Scholar]
- 19.Wegener J, Keese CR, Giaever I. Electric cell substrate impedance sensing (ECIS) as a noninvasive means to monitor the kinetics of cell spreading to artificial surfaces. Exp. Cell Res. 2000;259:158–166. doi: 10.1006/excr.2000.4919. [DOI] [PubMed] [Google Scholar]
- 20.Mamishev AV. Interdigital sensors and transducers. Proc. IEEE. 2004;92:808–845. [Google Scholar]
- 21.Roy R, Chen W, Goodell L, Hu J, Foran DJ, Desai JP. Microarray faciilitated mechanical characterization of breast tissue pathology samples using Atomic Force Microscopy (AFM) Proceedings of 3rd IEEE RAS and EMBS International Conference on Biomedical Robotics and Bioelectronics. 2010:710–715. [Google Scholar]
- 22.Cross SE, Jin YS, Rao J, Gimzewski JK. Optimized technology for the fabrication of piezoresistive pressure sensors Nanomechanical analysis of cells from cancer patient. Nat. Nanotechnol. 2007;2:780–783. doi: 10.1038/nnano.2007.388. [DOI] [PubMed] [Google Scholar]
- 23.Plodinec M, Loparic M, Monnier CA, Obermann EC, Dallenbach RZ, Oertle P, Hyotyla JT, Aebi U, Bentires-Alj M, Lim RYH, Schoenenberger CA. The nanomechanical signature of breast tissue. Nat Nanotechnol. 2012;7:757–765. doi: 10.1038/nnano.2012.167. [DOI] [PubMed] [Google Scholar]
- 24.Suresh S. Biomechanics and biophysics of cancer cells. Acta Mater. 2007;55(10):3989–4014. doi: 10.1016/j.actbio.2007.04.002. [DOI] [PMC free article] [PubMed] [Google Scholar]
- 25.Swift J, Ivanovska IL, Buxboim A, Harada T, Dingal PCDP, Pinter J, Pajerowski JD, Spinler K, Shin J-W, Tewari M, Rehfeldt F, Speicher DW, Discher DE. Nuclear Lamin-A Scales with Tissue Stiffness and Enhances Matrix-directed. Differentiation Science. 2013;341:1240104–1-1240104-16. doi: 10.1126/science.1240104. [DOI] [PMC free article] [PubMed] [Google Scholar]
- 26.Pandya HJ, Roy R, Chen W, Chekmareva M, Foran DJ, Desai JP. Accurate characterization of benign and cancerous breast tissues: Aspecific patient studies using piezoresistive microcantilevers. Biosens. Bioelectron. 2015;63(1):414–424. doi: 10.1016/j.bios.2014.08.002. [DOI] [PMC free article] [PubMed] [Google Scholar]
- 27.American Cancer Society . Cancer Facts & Figures. American Cancer Society; Atlanta: 2015. [Google Scholar]
- 28.Choi WC. Polymer Micromachined Flexible Tactile Sensor for Three-Axial Loads Detection. Trans Electr Electron Mater. 2010;11:130–133. [Google Scholar]
- 29.Chu DT, Creemer JF, Sarro PM. Lateral nano-Newton force sensing piezoresistive cantilever for microparticle handling. J. Micromech. Microeng. 2006;16:102–106. [Google Scholar]
- 30.Su Y, Evans AGR, Brunschweiler A, Ensell E, Koch M. Fabrication of improved piezoresistive silicon cantilever probes for the atomic force microscope. Sens. Actuators A. 1997;60:163–167. [Google Scholar]
- 31.Su Y, Evans AGR, Brunschweiler A. Micromachined silicon cantilever paddles with piezoresistive read-out for flow sensing. J. Micromech. Microeng. 1996;6:69–72. [Google Scholar]
- 32.Chui BW, Stowe TD, Kenny TW, Mamin HJ, Terris BD, Rugar D. Low-stiffness silicon cantilevers for thermal writing and piezoresistive readback with the atomic force microscope. Appl. Phys. Lett. 1996;69:2767–2769. [Google Scholar]
- 33.Ibach H. Adsorbate-induced surface stress. J. Vac. Sci. Technol. A. 1994:2240–2245. [Google Scholar]
- 34.Butt HJ. A Sensitive Method to Measure Changes in the Surface Stress of Solids. J. Colloid Interface Sci. 1996;180:251–260. [Google Scholar]
- 35.Harley JA, Kenny TW. Adsorption induced surface stress and its effects on resonance frequency of microcantilevers. Appl Phys Lett. 1995;77:3618–3622. [Google Scholar]
- 36.Berger R, Delamarche E, Lang HP, Gerber C, Gimzewski JK, Meyer E, Gntherodt HJ. Surface stress in the self-assembly of alkanethiols on gold. Science. 1997;276:2021–2024. [Google Scholar]
- 37.Fritz J, Baller MK, Lang HP, Rothuizen H, Vettiger P, Meyer E, Gntherodt HJ, Gerber CH, Gimzewski JK. Translating biomolecular recognition into nanomechanics. Science. 2000;288:316–318. doi: 10.1126/science.288.5464.316. [DOI] [PubMed] [Google Scholar]
- 38.Despont M, Brugger J, Drechsler U, Drig U, Hberle W, Lutwyche M, Rothuizen H, Stutz R, Widmer R, Binnig G, Rohrer H, Vettiger P. VLSI-NEMS chip for parallel AFM data storage. Sensors Actuat A. 2000;80:103–107. [Google Scholar]
- 39.Abraham M, Ehrfeld W, Lacher M, Mayer K, Noell W, Guthner P, Barenz J. Micromachined aperture probe tip for multifunctional scanning probe microscopy. Ultramicroscopy. 1998;71:93–98. [Google Scholar]
- 40.Lang U, Rust P, Dual J. Towards fully polymeric MEMS: Fabrication and testing of PEDOT/PSS straing gauges. Microelectron Eng. 2008;85:1050–1053. [Google Scholar]
- 41.Liu N, Fang G, Wan J, Zhou H, Long H, Zhao X. Electrospun PEDOT:PSSPVA nanofiber based unltrhigh-strain sensors with controllable electrical conductivity. J. Mater. Chem. 2011;21:18962–18966. [Google Scholar]
- 42.Takamastu S, Takahata T, Muraki M, Iwase E, Matsumoto K, Shimoyama I. Transparent conductive-polymer strain sensors for touch input sheets of flexible displays. J. Micromech. Microeng. 2010;20:075017(1)–075017(6). [Google Scholar]
- 43.Lang U, Rust P, Schoberle B, Dual J. Piezoresistive properties of PEDOT:PSS. Microelectron Eng. 2009;86:330–334. [Google Scholar]
- 44.Mata A, Fleischman A, Roy S. Characterization of polydimethylsiloxane (PDMS) properties for biomedical Micro/Nanosystems. Biomed. Microdevices. 2005;7:281–293. doi: 10.1007/s10544-005-6070-2. [DOI] [PubMed] [Google Scholar]
- 45.Adrega T, Lacour SP. Stretchable gold conductors in PDMS and patterned by photolithography: fabrication and electromechanical characterization. J. Micromech. Microeng. 2010;20:055025(1)–055025(8). [Google Scholar]
- 46.Lang U, Naujoks N, Dual J. Mechanical characterization of PEDOT:PSS thin films. Synthetic Met. 2009;159:473–479. [Google Scholar]
- 47.Tsutsui T, Fujita K. The shift from “Hard” to “Soft” Electronics. Adv Mater. 2002;14:949–952. [Google Scholar]
- 48.Latessa G, Brunetti F, Reale A, Saggio G, Carlo D. piezoresistive behaviour of flexible PEDOT:PSS based sensors. Sens. Actuator B. 2009;139:304–309. [Google Scholar]
- 49.Hutter JL, Bechhoefer J. Calibration Of Atomic-Force Microscope Tips. Review Sci. Instrum. 1993;64:1868–1873. [Google Scholar]
- 50.Roy R, Chen W, Cong L, Goodell L, Foran D, Desai J. Probabilistic Estimation of Mechanical Properties of Biomaterials Using Atomic Force Microscopy. IEEE T Bio-Med Eng. 2014;61:547–556. doi: 10.1109/TBME.2013.2283597. [DOI] [PMC free article] [PubMed] [Google Scholar]
- 51.Rudoy D, Yuen SG, Howe RD, Wolfe PJ. Bayesian Change point Analysis for Atomic Force Microscopy and Soft Material Indentation. J. Roy Statist. Soc. Ser. C. 2010;59:573–593. [Google Scholar]
- 52.Pillarisetti A, Desai J, Ladjal H, Schiffmacher A, Ferreira A, Keefer C. Mechanical Phenotyping of Mouse Embryonic Stem Cells: Increase in Stiffness with Differentiation. Cell Reprogram. 2011;13:371–380. doi: 10.1089/cell.2011.0028. [DOI] [PubMed] [Google Scholar]
- 53.Costar K, Smith A, Yin F. Non-Hertzian Approach to Analyzing Mechanical Properties of Endothelial Cells Probed by Atomic Force Microscopy. J Biomech Eng. 2005:128176–184. doi: 10.1115/1.2165690. [DOI] [PubMed] [Google Scholar]
- 54.Zhang M, Zheng Y, Mak A. Estimating the Effect Youngs Modulus of Soft Tissues from Indentation Tests Nonlinear Finite Element Analysis of Effects of Friction and Large Deformation. Med Eng Phys. 1997;19:512–517. doi: 10.1016/s1350-4533(97)00017-9. [DOI] [PubMed] [Google Scholar]
- 55.Cumpson PJ, Clifford CA, Hedley J. Quantitative analytical atomic force microscopy: a cantilever reference device for easy and accurate AFM spring-constant calibration. Meas. Sci. Tech. 2004;15:1337–1346. [Google Scholar]
- 56.Latessa G, Brunetti F, Reale A, Saggio G, Carlo D. Piezoresistive behaviour of flexible PEDOT:PSS based sensors. Sens. Actuator B. 2009;139:304–309. [Google Scholar]
- 57.Pandya H, Chen W, Goodell L, Foran D, Desai J. Mechanical phenotyping of breast cancer using MEMS: a method to demarcate benign and cancerous breast tissues. Lab Chip. 2014;14(23):4523–4532. doi: 10.1039/c4lc00594e. [DOI] [PMC free article] [PubMed] [Google Scholar]
- 58.Manduca A, Oliphant TE, Dresner MA, Mahowald JL, Kruse SA, Amromin E, Felmlee JP, Greenleaf JF, Ehman RL. Magnetic resonance elastography: Noninvasive mapping of tissue elasticity. Med. Image Anal. 2001;5:237–254. doi: 10.1016/s1361-8415(00)00039-6. [DOI] [PubMed] [Google Scholar]


