

Abstract
Background
Molecular epidemiologic evaluation of HIV-1 transmission networks can elucidate behavioral components of transmission that can be targets for intervention.
Methods
We combined phylogenetic and statistical approaches using pol sequences from patients diagnosed 2004-2011 at a large HIV center in Rhode Island, following 75% of the state’s HIV population. Phylogenetic trees were constructed using maximum likelihood and putative transmission clusters were evaluated using latent class analyses (LCA) to determine association of cluster size with underlying demographic/behavioral characteristics. A logistic growth model was used to assess intra-cluster dynamics over time and predict “active” clusters that were more likely to harbor undiagnosed infections.
Results
Of 1,166 HIV-1 subtype B sequences, 31% were distributed among 114 statistically-supported, monophyletic clusters (range: 2-15 sequences/cluster). Sequences from men who have sex with men (MSM) formed 52% of clusters. LCA demonstrated that sequences from recently diagnosed (2008-2011) MSM with primary HIV infection (PHI) and other sexually transmitted infections (STIs) were more likely to form larger clusters (Odds Ratio 1.62-11.25, p<0.01). MSM in clusters were more likely to have anonymous partners and meet partners at sex clubs and pornographic stores. Four large clusters with 38 sequences (100% male, 89% MSM) had a high-probability of harboring undiagnosed infections and included younger MSM with PHI and STIs.
Conclusions
In this first large-scale molecular epidemiologic investigation of HIV-1 transmission in New England, sexual networks among recently diagnosed MSM with PHI and concomitant STIs contributed to ongoing transmission. Characterization of transmission dynamics revealed actively growing clusters which may be targets for intervention.
INTRODUCTION
The HIV/AIDS epidemic in the United States (US) continues to affect diverse populations including men who have sex with men (MSM)1,2. Understanding HIV transmission patterns is important in the design and implementation of prevention interventions3. Transmission often occurs through local networks of individuals who are epidemiologically linked (e.g. sex partners), resulting in new infections and propagation of the epidemic4-11. Identification and characterization of local transmission networks can reveal important epidemiological information that can benefit outreach, testing programs, partner notification, and other public health interventions as recommended by the US Centers for Disease Control and Prevention (CDC)12-14. Disruption of local transmission networks is an important strategy for the prevention of HIV.
Phylogenetic analyses using HIV-1 pol sequences obtained as part of routine clinical care15-17 offer a unique opportunity to evaluate transmission networks18. HIV-1 pol genotyping at the initiation of care is typically used to evaluate for transmitted drug resistance (TDR), which in the US averages 10-15% of new infections19 and may also be transmitted through these networks20,21. Phylogenetic inference has been reliably used to define clusters of closely related sequences reflecting actual transmission networks through which propagation of the virus may be visualized and investigated4,7,8,22-26. Putative transmission clusters identified by phylogenetic analyses are dynamic entities that can be introduced at any time, actively grow, or become latent5,8,27,28. The size and dynamic nature of these clusters are representative of the extent of a transmission network. It has been shown, for example, that larger clusters tend to actively grow over time8 and to have more members with primary HIV-1 infections (PHI)27-29. PHI, defined as the first six months of HIV infection, is characterized by peak viremia, leading to a highly infectious state30-34 and frequent transmission within epidemiological networks4,5,7,9,24,35.
Evaluation of cluster dynamics (i.e. growing/active versus dormant/latent clusters) and behaviors associated with cluster members can provide important insight on local HIV transmission patterns. Previous investigations of cluster dynamics have examined how cluster sizes change over time27,29 and the duration that clusters tend to exist in a population8. Others have used logistic models to describe cluster growth and latency36. Such cross sectional analyses of longitudinally available data are essential to understand HIV transmission dynamics and are substantially affected by sampling density37.
The goal of the current study was to examine cluster dynamics over time in Rhode Island (RI), the smallest state in the US, where high sampling density can be achieved. We characterize local transmission clusters in the community using a comprehensive statewide dataset of HIV-1 pol sequences from 2004-2011, evaluate demographics and behaviors associated with larger clusters, and use logistic modeling as a novel approach to predict active clusters which are likely to harbor undiagnosed infections. We discuss how this information enhances understanding of HIV-1 transmission in our community and will help guide interventions to disrupt active transmission clusters.
METHODS
Study Population
Data were retrospectively collected from the Lifespan Hospital System, a Brown University teaching affiliate, encompassing major hospitals and the largest outpatient HIV center in RI38. The Center provides care to >1,500 HIV-infected patients, with high sampling density of approximately 75% of the state’s HIV population39,40. Demographic, clinical and laboratory data were collected for all HIV-1 positive individuals with available pol sequences. Data included age, gender, biologic sex, race/ethnicity, risk factor(s) for HIV acquisition, date of diagnosis, antiretroviral treatment history, other sexually transmitted infections (STI) at the time of diagnosis (syphilis, gonorrhea, and chlamydia), current residence, and determination of PHI at diagnosis. PHI was defined by two different methods: 1) Clinical: Recent HIV infection as evident by a negative test or clinical scenario consistent with acute retroviral syndrome in the six months preceding diagnosis ; and 2) Molecular: Fraction of ambiguous nucleotides (e.g. R=A or G; Y=T or C) ≤0.5% in treatment-naïve individuals, suggesting infection <1 year 41. Risk factors for HIV acquisition included MSM, males who have sex with females (MSF), females who have sex with males (FSM), injection drug use (IDU), mother-to-child-transmission (MTCT). Men who identified as both MSM and MSF were categorized as MSM. IDUs who reported MSF or FSM were categorized as IDU. To evaluate trends in demographics and behaviors, three different time periods of HIV diagnoses were evaluated: 1) Before 2004; 2) 2004-2007; 3) 2008-2011. This breakdown was based on the hypothesis that characteristics of recently diagnosed individuals may differ from earlier time periods. The study was approved by the Lifespan institutional review board.
Sequence and Phylogenetic Analyses
HIV-1 pol sequences obtained during routine clinical care were collected from January 2004 to December 2011. Sequencing was performed at Quest Diagnostics (Chantilly, VA) and Viracor Laboratories (Lee’s Summit, MO). For individuals with multiple sequences, the earliest sequence was used. Sequence quality control was performed using the sequence quality analysis tool (SQUAT)42. HIV-1 subtypes were determined using REGA v3.043. Due to the similarity of subtypes B and D, sequences that were called B/D recombinants by REGA were designated as subtype B. TDR was evaluated with the World Health Organization (WHO) surveillance drug resistance mutation list (SDRM)44 using Stanford HIV Sequence Database tools (hivdb.stanford.edu).
Sequences were aligned by multiple sequence comparison by log-expectation (MUSCLE)45 and manually edited to remove gaps and trimmed to identical lengths in BioEdit46. To identify putative transmission clusters, phylogenetic analyses were performed using Molecular Evolutionary Genetics Analysis (MEGA v5.05) software47. Trees were inferred using maximum likelihood and nearest neighbor interchange (NNI) and subtree pruning regrafting (SPR) heuristics based on the general-time reversible (GTR) model of evolution with four discrete gamma categories, selected as the best fitting model with the Akaike information criterion (AIC). Branch supports were based on nonparametric bootstrapping with 1000 replicates. Sequence positions associated with drug resistance were removed to minimize convergent evolution. Trees were rooted using reference subtype C sequences (Genbank accession numbers U46016, U52953, AF067155, AY772699; www.hiv.lanl.gov). Putative transmission clusters were defined using PhyloPart48, as ≥2 sequences with >90% branch support and median genetic distances less than 15% of the entire sample distribution. Evolutionary p-distance was also calculated between each pair of sequences in the dataset using MEGA v5.05 given that this is a reliable distance assessment among closely, within cluster, related sequences. Median average pairwise distance was also calculated for sequences within and not within clusters. Bivariate analyses were performed to determine demographics and behaviors associated with cluster inclusion using the chi-square test. Significance was defined as p-values less than 0.05.
Characteristics of Transmission Clusters
To further characterize putative transmission clusters and examine cluster-size significance, a proportional odds regression model was first used to describe the relationship between cluster size (dependent variable) and demographic/behavioral profiles (independent variables) of cluster members. Cluster size was classified as 1 (not a cluster), 2, and ≥3. To construct the independent variables, latent class analyses (LCA)49,50 was applied to the following categorical covariates: HIV risk factor, year of diagnosis (<1990, 1990-2003, 2004-2007, >2007, unknown), age at diagnosis (<30, 30-39, ≥40 years), another STI at diagnosis (yes/no), clinical PHI (yes/no), gender (male/female), and TDR (yes/no). LCA applies a maximum likelihood approach to generate subgroups (latent classes) based on patterns of data with the goal of grouping individuals with similar characteristics. The latent class model was fit using R version 2.14.2 and number of latent classes selected using AIC. Each individual’s covariate values were translated into class membership probabilities for each latent class. See the Supplemental Appendix for further details on LCA.
Second, to longitudinally examine cluster dynamics, a logistic growth model was used to evaluate clusters with >3 sequences and characterize the rate of new HIV diagnoses over time within individual clusters. The model assumed that in a given year, some individuals in a cluster were not yet infected, some were infected but not yet diagnosed, and some had already been infected and diagnosed. Over time, new diagnoses were observed in a cluster when infected individuals were diagnosed. We used the model to estimate the growth rate of HIV diagnoses in a given cluster at a fixed point in time, the year following data collection. Clusters with larger growth rates (still in the “active” phase of growing) were theorized to harbor more undiagnosed HIV-infected individuals. Clusters were classified based on the model as having a high-probability (≥15%), moderate-probability (5-15%) or low-probability (≤5%) of harboring individuals with undiagnosed infections in the following year. An “active” cluster was defined as having a high-probability of harboring undiagnosed infections. Finally, we examined the association between growth rate and cluster-specific characteristics. See the Supplemental Appendix for additional details on the logistic growth modeling.
Behaviors Associated with Belonging to Identified Clusters
Behaviors of MSM who were diagnosed with HIV from 2008-2011 were reviewed to evaluate behaviors that may be associated with HIV transmission such as use of drugs or alcohol during sex, exchange of drugs or money for sex, sex with anonymous partners, and venues where individuals met sexual partners. Venues included the internet, bathhouses, sex parties, pornographic video stores, rest areas, parks, bars/clubs, and telephone chat rooms. Behaviors were compared between MSM with sequences that formed putative transmission clusters and those that did not form clusters. MSM with sequences that had a high-probability of being in an active cluster were compared to those in moderate- or low-probability clusters. Finally, we compared MSM who were older (≥30 years) versus younger (<30 years), irrespective of cluster status, to examine behavioral differences between age groups51. Chi-square analyses were used to determine significant differences between categorical data.
RESULTS
Population Characteristics
Among the 1,277 patients who had at least one pol sequence available for analysis (Table 1), 71% were male, the average age at diagnosis was 40 years (Range: birth to 79 years), and the year of HIV diagnosis ranged from 1980-2011 (Average 2001; Median 2003). Risk factors for HIV acquisition included 37% MSM, 19% IDU, 17% FSM, 13% MSF, 3% MSM/IDU, 2% MTCT, and 8% other/unknown. Ten percent presented with PHI at diagnosis by clinical history or recent negative HIV test. Forty-seven percent (596) of sequences were from patients who were treatment-naïve at the time of genotyping and 11% (66/596) of these had TDR. There was no significant difference in prevalence of TDR across the three time periods. Individuals diagnosed in the recent time period (2008-2011) were more likely to be male and to report same-sex behavior and less likely to report IDU as the likely risk factor for HIV acquisition compared to patients diagnosed in earlier time periods (p<0.01, Supplemental Figure 1).
Table 1.
Characteristics of HIV-infected patients with available pol sequences (2004-2011) according to HIV diagnosis year
| Characteristic | Years of Diagnosis1 | p-value | |||||||
|---|---|---|---|---|---|---|---|---|---|
| All | ≤2003 | 2004-2007 | 2008-2011 | ||||||
| N | % | N | % | N | % | N | % | ||
| Total | 1277 | 619 | 316 | 295 | |||||
| Sex | |||||||||
| Male | 901 | 71% | 410 | 66% | 226 | 72% | 230 | 78% | <0.01 |
| Female | 371 | 29% | 209 | 34% | 85 | 27% | 65 | 22% | |
| Transgender | 5 | 0% | 0 | 0% | 5 | 2% | 0 | 0% | |
| Age at HIV Diagnosis (years) | |||||||||
| 0-29 | 469 | 37% | 295 | 48% | 92 | 29% | 82 | 28% | <0.01 |
| 30-39 | 420 | 33% | 238 | 38% | 102 | 32% | 80 | 27% | |
| ≥40 | 341 | 27% | 86 | 14% | 122 | 39% | 133 | 45% | |
| Unknown | 47 | 4% | |||||||
| Transmission Risk2 | |||||||||
| MSM | 476 | 37% | 164 | 26% | 146 | 46% | 165 | 56% | <0.01 |
| MSF | 166 | 13% | 71 | 11% | 47 | 15% | 48 | 16% | |
| FSM | 212 | 17% | 98 | 16% | 63 | 20% | 51 | 17% | |
| IDU | 245 | 19% | 196 | 32% | 24 | 8% | 23 | 8% | |
| MSM/IDU | 37 | 3% | 23 | 4% | 13 | 4% | 1 | 0% | |
| Perinatal | 31 | 2% | 23 | 4% | 8 | 3% | 0 | 0% | |
| Unknown | 94 | 7% | 32 | 5% | 11 | 3% | 7 | 2% | |
| Other3 | 16 | 1% | 12 | 2% | 4 | 1% | 0 | 0% | |
| Antiretroviral Treatment (at sequencing) | |||||||||
| Naïve | 596 | 47% | 81 | 13% | 244 | 77% | 271 | 92% | <0.01 |
| Experienced4 | 681 | 53% | 538 | 87% | 72 | 23% | 24 | 8% | |
| Transmitted Drug Resistance (of #Naïve) | |||||||||
| Any | 66 | 11% | 8 | 10% | 25 | 10% | 33 | 12% | 0.73 |
| NRTIs | 24 | 4% | 3 | 4% | 8 | 3% | 13 | 5% | 0.67 |
| NNRTIs | 43 | 7% | 4 | 5% | 18 | 7% | 21 | 8% | 0.69 |
| PIs | 10 | 2% | 1 | 1% | 2 | 1% | 7 | 3% | 0.28 |
N=number; MSM=men who have sex with men; MSF=males who have sex with females; FSM=females who have sex with males; IDU=Injection drug use; NRTI=nucleoside reverse transcriptase inhibitors; NNRTI=non-nucleoside reverse transcriptase inhibitors; PI=protease inhibitors.
Forty-seven individuals did not have an available year of diagnosis and are not included in the categorical breakdown.
Transmission risk: MSM includes both MSM and MSM/MSF. IDU includes IDU, IDU/MSF and IDU/FSM.
Other risk factors include two occupational and ten transfusion related infections (≤2003); and four transfusion related infections (2004-2007).
This category also includes individuals who are likely treated but did not have available data.
Putative Transmission Clusters
The majority of patients (91%; 1,166/1,277) were infected with HIV-1 subtype B. Thirty-one percent (358/1,166) of subtype B sequences formed 114 statistically supported (bootstrap >90%) phylogenetic clusters (Supplemental Figure 2). The average cluster size was 3.1 sequences (Range 2-15 sequences/cluster). The median average pairwise genetic distance of sequences within clusters was 0.71% (Range: 0-3.1%) and of sequences outside clusters 5.3% (Range: 2.6-8.4%). The median time between diagnosis and sequencing was 4.6 years (range: 0.003-29.1 years). Of the 114 clusters, 37% included sequences only isolated from MSM, 18% only from heterosexuals and 7% only from IDUs. The remaining clusters included sequences with mixed risk factors: 18% with at least one MSM, 17% mixed without any MSM and 3% unknown.
Overall, 52% (59/114) of the clusters contained sequences from at least one MSM. Forty percent of sequences from MSM formed clusters, significantly higher compared to other risk groups including FSM (29%, p=0.02), IDU (17%, p<0.01) and MSM/IDU (8%, p<0.01) (Table 2). There was no difference between sequences from MSM and MSF and cluster association. Compared to individuals whose sequences were not in clusters, those in clusters were more likely to be male (80% versus 69%, p<0.01), have PHI (both by clinical and ambiguous nucleotide criteria, p<0.01 for each) and have an STI at HIV diagnosis (6% versus 3%, p<0.01; Table 2). Sixty-four percent (73/114) of individuals with PHI by clinical criteria and who were treatment-naïve during sequencing also had a fraction of ambiguous nucleotides consistent with PHI. Compared to MSM with sequences that did not form clusters, those that did form clusters were more likely to be diagnosed with PHI (40% versus 16% by clinical criterion, 31% versus 11% by ambiguous nucleotide criterion, p<0.01), present with an STI (12% versus 5%, p=0.01), and live in Providence compared to another city (47% versus 32%, p<0.01). MSM in clusters were less likely to have TDR than those not in clusters (10% versus 21%, p<0.01).
Table 2.
Characteristics of HIV-1 infected individuals forming transmission clusters
| All | p | MSM | p-value | |||||||
|---|---|---|---|---|---|---|---|---|---|---|
| Cluster | Non-Cluster | Cluster | Non-Cluster | |||||||
| N | % | N | % | N | % | N | % | |||
| Total | 358 | 808 | 187 | 282 | ||||||
| Male | 285 | 80% | 560 | 69% | <0.01 | 185 | 99% | 280 | 99% | 0.68 |
| Female | 71 | 20% | 245 | 30% | 0 | 0% | 0 | 0% | ||
| Transgender | 2 | 1% | 3 | 0% | 2 | 1% | 2 | 1% | ||
| Age at Diagnosis (years) | ||||||||||
| 0-29 | 129 | 36% | 292 | 36% | 0.30 | 67 | 36% | 100 | 35% | 0.71 |
| 30-39 | 116 | 32% | 273 | 34% | 61 | 33% | 101 | 36% | ||
| ≥40 | 104 | 29% | 207 | 26% | 59 | 32% | 80 | 28% | ||
| Unknown | 9 | 3% | 36 | 4% | 0 | 0% | 1 | 0% | ||
| Risk Factor1 | ||||||||||
| MSM | 187 | 52% | 282 | 35% | REF3 | 187 | 100% | 282 | 100% | |
| MSF | 52 | 15% | 80 | 10% | 0.92 | - | - | |||
| FSM | 50 | 14% | 120 | 15% | 0.02 | - | - | |||
| IDU | 40 | 11% | 198 | 25% | <0.01 | - | - | |||
| MSM/IDU | 3 | 1% | 34 | 4% | <0.01 | - | - | |||
| Perinatal | 11 | 3% | 8 | 1% | 0.12 | - | - | |||
| Unknown | 13 | 4% | 72 | 9% | <0.01 | - | - | |||
| Other2 | 2 | 1% | 14 | 2% | 0.03 | - | - | |||
| Primary HIV Infection | ||||||||||
| Ambiguous | 109 | 30% | 76 | 9% | <0.01 | 74 | 40% | 46 | 16% | <0.01 |
| Clinical | 73 | 20% | 48 | 6% | <0.01 | 57 | 31% | 32 | 11% | <0.01 |
| Naïve | 257 | 72% | 270 | 33% | <0.01 | 166 | 89% | 136 | 48% | <0.01 |
| TDR | 25 | 10% | 41 | 15% | 0.06 | 16 | 10% | 29 | 21% | <0.01 |
| STI | 22 | 6% | 20 | 3% | <0.01 | 22 | 12% | 15 | 5% | 0.01 |
| Place of Residence | ||||||||||
| Rhode Island | 340 | 95% | 756 | 94% | 0.25 | 174 | 93% | 257 | 91% | 0.34 |
| Providence | 175 | 49% | 350 | 43% | 0.08 | 87 | 47% | 91 | 32% | <0.01 |
MSF=males who have sex with females; FSM=females who have sex with males; TDR=transmitted drug resistance; STI=sexually transmitted infection; REF=Reference.
Transmission risk: MSM includes both MSM and MSM/MSF. IDU includes IDU, IDU/MSF and IDU/FSM.
Other risk factors include two transfusion related infections in cluster members, and twelve transfusion related and two occupational related infections in non-cluster members.
The percent of sequences from each risk group in a cluster were compared to those from MSM as the reference group.
Putative Transmission Cluster Dynamics
LCA identified four classes based on lowest AIC criterion that were associated with cluster size (Figure 1). Classes 1 and 2 included a mix of MSM, IDU, and heterosexuals diagnosed prior to 2003; Class 3 was composed of heterosexuals and IDUs diagnosed from 1990-2011; and Class 4 was composed entirely of MSM primarily diagnosed from 2003-2011, evenly distributed across ages at time of diagnoses (30% <30 years, 31% 30-39 years, 39% ≥40 years), 27% with PHI and 11% with another STI at the time of HIV diagnosis. Individuals in class 4 were more likely to be in a larger cluster compared to all other classes (class 4 versus 1, Odds Ratio (OR) 7.5 [5.1-10.9 95% CI], p<0.01; 4 versus 2, OR 11.3 [6.6-19.2 95% CI], p<0.01; 4 versus 3, OR 1.6 [1.2-2.3 95% CI], p<0.01).
Figure 1. Latent Class Analysis (LCA) of HIV-1 infected individuals.
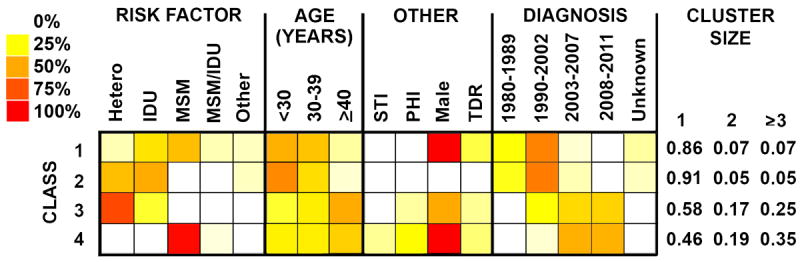
The distribution of participant characteristics within latent class and predicted proportions in each cluster size by latent class are shown. Darker colors represent higher proportion as shown in the legend. MSM=men who have sex with men; Hetero includes both males who have sex with females and females who have sex with males; IDU=Injection drug use; TDR=transmitted drug resistance; PHI = primary HIV-1 infection.
Twenty-four clusters had >3 sequences and were evaluated by logistic growth modeling. Four clusters were identified as having a high-probability of harboring undiagnosed infections in the following year, 10 with moderate-probability and 10 with low-probability (Figure 2). The 38 members with sequences of the high-probability clusters were more likely to be male (100%, p=0.06), MSM (89%, p=0.07), diagnosed in the latest time period 2008-2011 (66%, p=0.02), 0-29 years of age (50%, p=0.04), and have PHI (45%, p=0.02) and another STI (16%, p<0.01) at diagnosis, compared to individuals in moderate- or low-probability clusters (Table 3).
Figure 2. Estimated probabilities of transmission clusters harboring undiagnosed infections in the year following data collection based on a logistic growth model.
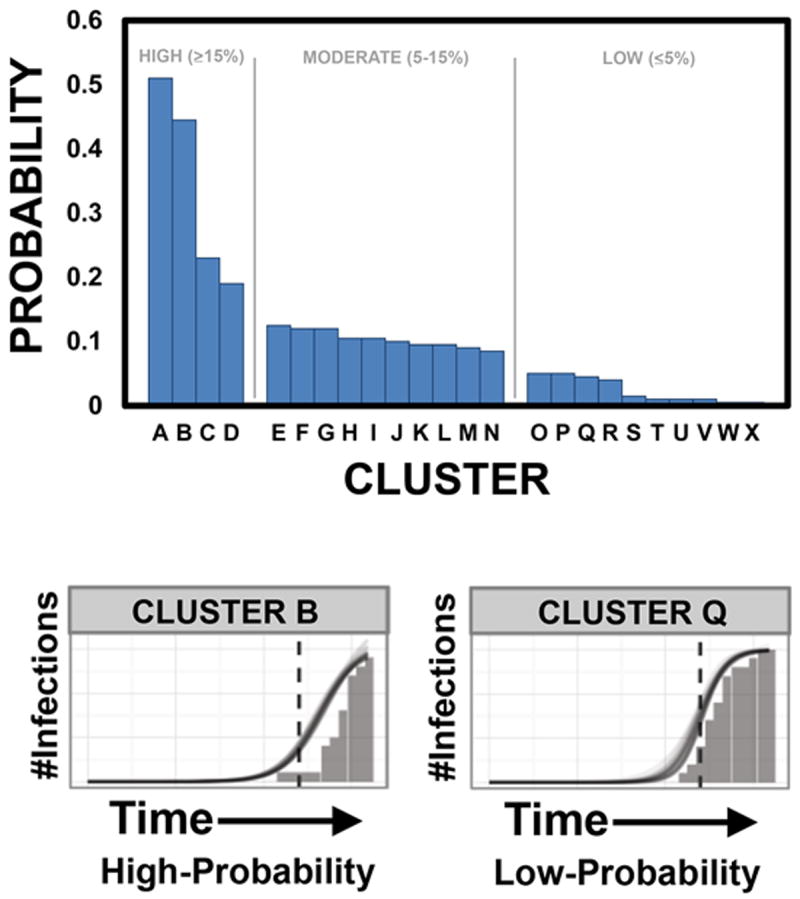
Bars demonstrate the 24 large clusters, ranked in descending order according to the highest probability of including an undiagnosed infection. Clusters with a high-probability (≥15%) of harboring undiagnosed infections in the following year are A-D; moderate-probability (5-15%) E-N; and low-probability (≤5%) O-X. Examples of high (Cluster B) and low (Cluster Q) probability clusters are shown at the bottom of the figure, demonstrating differing growth rates as represented by the slope of the line.
Table 3.
Cluster characteristics based on probability of undiagnosed HIV infections.
| Probability of Undiagnosed HIV Infections | |||||||
|---|---|---|---|---|---|---|---|
| High | Moderate | Low | p-value | ||||
| N | % | N | % | N | % | ||
| Total | 38 | 67 | 64 | ||||
| Male | 38 | 100% | 59 | 88% | 48 | 75% | 0.06 |
| Year of Diagnosis | |||||||
| ≤2003 | 1 | 3% | 4 | 6% | 10 | 16% | 0.02 |
| 2004-2007 | 10 | 26% | 22 | 33% | 25 | 39% | |
| 2008-2011 | 25 | 66% | 37 | 55% | 20 | 31% | |
| Age | |||||||
| 0-29 | 19 | 50% | 23 | 34% | 15 | 23% | 0.04 |
| 30-39 | 13 | 34% | 18 | 27% | 16 | 25% | |
| ≥40 | 4 | 11% | 22 | 33% | 24 | 38% | |
| Unknown | 2 | 5% | 4 | 6% | 1 | 2% | |
| Risk Factor | |||||||
| MSM | 34 | 89% | 41 | 61% | 34 | 53% | 0.07 |
| MSF | 2 | 5% | 13 | 19% | 9 | 14% | |
| FSM | 0 | 0% | 7 | 10% | 6 | 9% | |
| IDU | 0 | 0% | 2 | 3% | 3 | 5% | |
| MSM/IDU | 0 | 0% | 0 | 0% | 2 | 3% | |
| Unknown | 2 | 5% | 4 | 6% | 2 | 3% | |
| PHI (Clinical) | 17 | 45% | 17 | 25% | 8 | 13% | 0.02 |
| STI | 6 | 16% | 1 | 1% | 6 | 9% | <0.01 |
MSM=men who have sex with men; MSF=males who have sex with females; FSM=females who have sex with males; IDU=Injection drug use; TDR=transmitted drug resistance; STI=sexually transmitted infection.
Behaviors Associated with Putative Transmission Clusters
Behavioral data were available for 34% (161/476) of MSM diagnosed in the recent time period (2008-2011; Supplemental Table 1). Compared to MSM with sequences who did not form clusters, MSM from this time period who were in clusters were more likely to have met sexual partners at pornographic video stores (17% versus 6%, p=0.04), telephone chat rooms (7% versus 1%, p=0.11), and sex parties (10% versus 3%, p=0.08), and have anonymous sexual partners (32% versus 17%, p=0.03).
Compared to MSM with a low/moderate probability of harboring undiagnosed infections, MSM in high-probability active clusters were more likely to be in a younger age group 18-29 years (56% versus 27%, p<0.01), present with clinically defined PHI (47% versus 24%, p=0.016), and meet partners at either bars/clubs (32% versus 12%, p=0.11) or online (41% versus 12%, p>0.01).
MSM who were less than 30 years at HIV-1 diagnosis were more likely to have met sexual partners at bars/clubs (41% versus 24%, p=0.03) and less likely to have met sexual partners at bathhouses (27% versus 9%, p<0.01) and video stores (17% versus 2%, p<0.01) compared to MSM who were age 30 or greater, irrespective of cluster status.
DISCUSSION
This is the first large scale molecular epidemiologic investigation of HIV-1 transmission networks in New England, performed at the major HIV center in RI which cares for the majority (75%) of the state’s HIV-infected population. At the end of 2011, approximately 2,046 individuals in RI were living with HIV/AIDS which included those who were unaware of their status, estimated at 20%52. The 1,277 sequences collected as part of this study represented approximately 78% of the total diagnosed HIV positive population in the state. Thirty-one percent of 1,166 individuals diagnosed with HIV-1 subtype B between 1980-2011 had sequences which belonged to putative transmission clusters, comprised primarily of MSM who were more likely to have PHI at diagnosis. Sequences from MSM were more likely than those from other risk groups to belong to transmission clusters with the exception of MSF. Using LCA, we found that recently diagnosed MSM, evenly distributed across ages and with higher STI and PHI rates at HIV diagnosis, had sequences which were more likely to form larger transmission clusters, suggesting a major contribution to new infections. Longitudinal examination of large transmission cluster dynamics using logistic growth modeling identified actively growing clusters that had a high probability of harboring undiagnosed infections, composed mainly of sequences from recently diagnosed, younger MSM, with higher STI and PHI rates at diagnosis. Behavioral practices of MSM in active clusters included meeting partners at local bars, clubs and online. Older MSM tended to meet partners at bathhouses and pornographic video stores. These comprehensive analyses provide unique insights into local transmission dynamics with implications for cluster disruption and prevention interventions.
Our study parallels trends in HIV-1 transmission at the national US level including a majority of new diagnoses among MSM. Our previous work in RI demonstrated the presence of small-scale transmission clusters among sequences from MSM11,53 which were associated with local sex club venues54. In this study, evaluation of putative transmission clusters using a comprehensive set of HIV-1 pol sequences in the entire state, identified significant local sexual transmission patterns among MSM. This study expands on available evidence in the US demonstrating increasingly widespread and enlarging HIV transmission among MSM associated with recent infection and other STIs at HIV diagnosis22,23,55.
Two analytic approaches, LCA and logistic growth modeling, were incorporated into this molecular epidemiological study to evaluate the dynamics and characteristics of HIV transmission clusters. LCA, used mostly in behavioral studies56-67, was recently used in association with phylogeny in the Swiss HIV Cohort, linking demographics and behaviors with clusters of MSM and heterosexuals68. We extend the use of LCA to evaluate the significance of HIV transmission cluster size, and demonstrate that MSM with PHI and other STIs comprise a significant proportion of those who are recently diagnosed and are associated with belonging to larger clusters. This lends further evidence that identification and disruption of large clusters may impact viral transmission, especially among MSM with these characteristics.
Logistic growth modeling, used here to characterize cluster growth rates over time and identify active clusters, has been used to study HIV transmission phylodynamics at the population level69-73. Only one study evaluated cluster dynamics over time using this model, but on a national level (United Kingdom)36. The UK analysis demonstrated multiple HIV-1 subtype B subepidemics within MSM with diverse patterns of growth and latency that follow a logistic growth curve. The logistic growth model assumes an initial period of rapid growth followed by a period of slower growth. This pattern accurately depicts HIV transmission within clusters with an initial period of increasing infections attributed to PHI when viral loads peak32,33,35, followed by a slower phase as individuals are identified and treated36. We expand the function of this model by using growth rates to identify clusters that may still be in the rapid phase of growth and likely to harbor undiagnosed infections. Members of these high-yield clusters are important targets for interventions such as partner notification and contact tracing, early treatment, and evaluation of associated behaviors (e.g. settings for meeting partners).
Original data presented here from Southern New England, supported by LCA and the logistic growth model, strengthen the need to further identify large, active, regional clusters through expanded contact tracing and testing, to identify infected unaware individuals as soon as possible. These findings also suggest that increasing capacity to diagnose acute HIV infection74 and aggressive diagnosis/treatment of other STIs which contribute to HIV transmission may help attenuate new HIV infections among MSM.
We did not find an association between local HIV-1 transmission clusters and TDR in contrast to previous studies7,75. The prevalence of TDR in our community (11%) is stable and slightly lower than other areas of the US19,76-80, which may be due to the lack of circulation of TDR within local networks and the aggressive care of patients once they become aware of infection. However, as antiretrovirals continue to be widely used, continued close monitoring of TDR is warranted81.
Although molecular epidemiology approaches can provide important insights on characteristics of the HIV epidemic in a community, such population-based analyses should not be used to infer direct transmission between two or more individuals or others within transmission clusters. Although we assume high sampling density in our study, the statistical inference we used to assess phylogenetic relationships among pol sequences represents a subset of the overall network given only those with available sequences from 2004-2011 were included, with an increasing use of genotyping during those years, and only a portion of the HIV-1 genome was evaluated. Determination of PHI in this study was limited by the lack of laboratory verification, unexamined dual infection and delay from diagnosis to viral sequencing. Demographic and behavioral data was also not available for all individuals, limiting our ability to characterize all network participants.
In conclusion, we used sequence and behavioral data with phylogenetic and statistical analyses to investigate HIV-1 transmission in our community, identify transmission clusters, demonstrate their dynamic and changing epidemiology and evaluate their potential impact on prevention strategies. Detailed characterization of clusters can identify trends in their growth over time, leading to discovery of actively growing clusters, which may be targeted for intervention. The contribution of PHI and other STIs at HIV diagnosis among MSM to local transmission in our community suggests the need for targeted interventions in this risk group. Future work should focus on exploring how real-time phylogenetic identification of transmission clusters can be used to inform public health prevention interventions, including pre-exposure prophylaxis (PREP).
Supplementary Material
Acknowledgments
P.A.C. and R.K. were supported by grants (1K23AI096923 and R01AI66922, respectively) from the National Institutes of Health. Additional support was provided by the Lifespan/Tufts/Brown Center for AIDS Research funded by the National Institute of Allergy And Infectious Diseases (P30AI042853).
SOURCE OF FUNDING: Supported by the National Institutes of Health (1K23AI096923, R01AI66922, P30AI042853).
Footnotes
CONFLICTS OF INTEREST
No conflicts of interest.
The authors declare that they have no competing interests.
References
- 1.Beyrer C, Sullivan P, Sanchez J, et al. The increase in global HIV epidemics in MSM. AIDS. 2013;27(17):2665–2678. doi: 10.1097/01.aids.0000432449.30239.fe. [DOI] [PubMed] [Google Scholar]
- 2.Johnson AS, Hall HI, Hu X, Lansky A, Holtgrave DR, Mermin J. Trends in diagnoses of HIV infection in the United States, 2002-2011. JAMA. 2014;312(4):432–434. doi: 10.1001/jama.2014.8534. [DOI] [PMC free article] [PubMed] [Google Scholar]
- 3.Brenner B, Wainberg MA, Roger M. Phylogenetic inferences on HIV-1 transmission: implications for the design of prevention and treatment interventions. AIDS. 2013;27(7):1045–1057. doi: 10.1097/QAD.0b013e32835cffd9. [DOI] [PMC free article] [PubMed] [Google Scholar]
- 4.Lewis F, Hughes GJ, Rambaut A, Pozniak A, Leigh Brown AJ. Episodic sexual transmission of HIV revealed by molecular phylodynamics. PLoS Med. 2008;5(3):e50. doi: 10.1371/journal.pmed.0050050. [DOI] [PMC free article] [PubMed] [Google Scholar]
- 5.Ambrosioni J, Junier T, Delhumeau C, et al. Impact of highly active antiretroviral therapy on the molecular epidemiology of newly diagnosed HIV infections. AIDS. 2012;26(16):2079–2086. doi: 10.1097/QAD.0b013e32835805b6. [DOI] [PubMed] [Google Scholar]
- 6.Kouyos RD, von Wyl V, Yerly S, et al. Molecular epidemiology reveals long-term changes in HIV type 1 subtype B transmission in Switzerland. J Infect Dis. 2010;201(10):1488–1497. doi: 10.1086/651951. [DOI] [PubMed] [Google Scholar]
- 7.Bezemer D, van Sighem A, Lukashov VV, et al. Transmission networks of HIV-1 among men having sex with men in the Netherlands. AIDS. 2010;24(2):271–282. doi: 10.1097/QAD.0b013e328333ddee. [DOI] [PubMed] [Google Scholar]
- 8.Brenner BG, Roger M, Stephens D, et al. Transmission clustering drives the onward spread of the HIV epidemic among men who have sex with men in Quebec. J Infect Dis. 2011;204(7):1115–1119. doi: 10.1093/infdis/jir468. [DOI] [PMC free article] [PubMed] [Google Scholar]
- 9.Brenner BG, Roger M, Routy J-P, et al. High rates of forward transmission events after acute/early HIV-1 infection. J Infect Dis. 2007;195(7):951–959. doi: 10.1086/512088. [DOI] [PubMed] [Google Scholar]
- 10.Chan PA, Kazi S, Rana A, et al. Short communication: new HIV infections at Southern New England academic institutions: implications for prevention. AIDS Res Hum Retroviruses. 2013;29(1):25–29. doi: 10.1089/AID.2012.0130. [DOI] [PMC free article] [PubMed] [Google Scholar]
- 11.Chan PA, Tashima K, Cartwright CP, et al. Transmitted Drug Resistance and Molecular Epidemiology in Antiretroviral Naive HIV Type 1-Infected Patients in Rhode Island. AIDS Res Hum Retroviruses. 2011;27:275–281. doi: 10.1089/aid.2010.0198. [DOI] [PMC free article] [PubMed] [Google Scholar]
- 12.Hogben M, McNally T, McPheeters M, Hutchinson AB. The effectiveness of HIV partner counseling and referral services in increasing identification of HIV-positive individuals a systematic review. Am J Prev Med. 2007;33(2 Suppl):S89–S100. doi: 10.1016/j.amepre.2007.04.015. [DOI] [PubMed] [Google Scholar]
- 13.Centers for Disease Control and Prevention (CDC), Health Resources and Services Administration, National Institutes of Health, HIV Medicine Association of the Infectious Diseases Society of America. Incorporating HIV prevention into the medical care of persons living with HIV. Recommendations of CDC, the Health Resources and Services Administration, the National Institutes of Health, and the HIV Medicine Association of the Infectious Diseases Society of America. MMWR Recomm Rep. 2003;52(RR-12):1–24. [PubMed] [Google Scholar]
- 14.Centers for Disease Control and Prevention (CDC) Rapid HIV testing in outreach and other community settings--United States, 2004-2006. MMWR Morb Mortal Wkly Rep. 2007;56(47):1233–1237. [PubMed] [Google Scholar]
- 15.Johnson VA, Calvez V, Günthard HF, et al. 2011 update of the drug resistance mutations in HIV-1. Top Antivir Med. 2011;19(4):156–164. [PMC free article] [PubMed] [Google Scholar]
- 16.Vandamme A-M, Camacho RJ, Ceccherini-Silberstein F, et al. European recommendations for the clinical use of HIV drug resistance testing: 2011 update. AIDS Rev. 2011;13(2):77–108. [PubMed] [Google Scholar]
- 17.Department of Health and Human Services Panel on Antiretroviral Guidelines for Adults and Adolescent. Guidelines for the use of antiretroviral agents in HIV-1-infected adults and adolescents. 2013 Feb; [Google Scholar]
- 18.Grabowski MK, Redd AD. Molecular tools for studying HIV transmission in sexual networks. Curr Opin HIV AIDS. 2014;9(2):126–133. doi: 10.1097/COH.0000000000000040. [DOI] [PMC free article] [PubMed] [Google Scholar]
- 19.Wheeler WH, Ziebell RA, Zabina H, et al. Prevalence of transmitted drug resistance associated mutations and HIV-1 subtypes in new HIV-1 diagnoses, U.S.-2006. AIDS. 2010;24(8):1203–1212. doi: 10.1097/QAD.0b013e3283388742. [DOI] [PubMed] [Google Scholar]
- 20.Audelin AM, Gerstoft J, Obel N, et al. Molecular phylogenetics of transmitted drug resistance in newly diagnosed HIV Type 1 individuals in Denmark: a nation-wide study. AIDS Res Hum Retroviruses. 2011;27(12):1283–1290. doi: 10.1089/AID.2010.0368. [DOI] [PubMed] [Google Scholar]
- 21.Brenner BG, Roger M, Moisi DD, et al. Transmission networks of drug resistance acquired in primary/early stage HIV infection. AIDS. 2008;22(18):2509–2515. doi: 10.1097/QAD.0b013e3283121c90. [DOI] [PMC free article] [PubMed] [Google Scholar]
- 22.Aldous JL, Pond SK, Poon A, et al. Characterizing HIV transmission networks across the United States. Clin Infect Dis. 2012;55(8):1135–1143. doi: 10.1093/cid/cis612. [DOI] [PMC free article] [PubMed] [Google Scholar]
- 23.Dennis AM, Hué S, Hurt CB, et al. Phylogenetic insights into regional HIV transmission. AIDS. 2012;26(14):1813–1822. doi: 10.1097/QAD.0b013e3283573244. [DOI] [PMC free article] [PubMed] [Google Scholar]
- 24.Fisher M, Pao D, Brown AE, et al. Determinants of HIV-1 transmission in men who have sex with men: a combined clinical, epidemiological and phylogenetic approach. AIDS. 2010;24(11):1739–1747. doi: 10.1097/QAD.0b013e32833ac9e6. [DOI] [PubMed] [Google Scholar]
- 25.Hughes GJ, Fearnhill E, Dunn D, Lycett SJ, Rambaut A, Leigh Brown AJ. Molecular phylodynamics of the heterosexual HIV epidemic in the United Kingdom. PLoS Pathog. 2009;5(9):e1000590. doi: 10.1371/journal.ppat.1000590. [DOI] [PMC free article] [PubMed] [Google Scholar]
- 26.Leigh Brown AJ, Lycett SJ, Weinert L, et al. Transmission network parameters estimated from HIV sequences for a nationwide epidemic. J Infect Dis. 2011;204(9):1463–1469. doi: 10.1093/infdis/jir550. [DOI] [PMC free article] [PubMed] [Google Scholar]
- 27.Ragonnet-Cronin M, Ofner-Agostini M, Merks H, et al. Longitudinal phylogenetic surveillance identifies distinct patterns of cluster dynamics. J Acquir Immune Defic Syndr. 2010;55(1):102–108. doi: 10.1097/QAI.0b013e3181e8c7b0. [DOI] [PubMed] [Google Scholar]
- 28.Audelin AM, Cowan SA, Obel N, Nielsen C, Jørgensen LB, Gerstoft J. Phylogenetics of the Danish HIV epidemic: the role of very late presenters in sustaining the epidemic. J Acquir Immune Defic Syndr. 2013;62(1):102–108. doi: 10.1097/QAI.0b013e318276becc. [DOI] [PubMed] [Google Scholar]
- 29.Chibo D, Kaye M, Birch C. HIV transmissions during seroconversion contribute significantly to new infections in men who have sex with men in Australia. AIDS Res Hum Retroviruses. 2012;28(5):460–464. doi: 10.1089/AID.2011.0137. [DOI] [PubMed] [Google Scholar]
- 30.Cohen MS, Shaw GM, McMichael AJ, Haynes BF. Acute HIV-1 Infection. N Engl J Med. 2011;364(20):1943–1954. doi: 10.1056/NEJMra1011874. [DOI] [PMC free article] [PubMed] [Google Scholar]
- 31.Xiridou M, Geskus R, de Wit J, Coutinho R, Kretzschmar M. Primary HIV infection as source of HIV transmission within steady and casual partnerships among homosexual men. AIDS. 2004;18(9):1311–1320. doi: 10.1097/00002030-200406180-00010. [DOI] [PubMed] [Google Scholar]
- 32.Koopman JS, Jacquez JA, Welch GW, et al. The role of early HIV infection in the spread of HIV through populations. J Acquir Immune Defic Syndr Hum Retrovirol. 1997;14(3):249–258. doi: 10.1097/00042560-199703010-00009. [DOI] [PubMed] [Google Scholar]
- 33.Jacquez JA, Koopman JS, Simon CP, Longini IM., Jr Role of the primary infection in epidemics of HIV infection in gay cohorts. J Acquir Immune Defic Syndr. 1994;7(11):1169–1184. [PubMed] [Google Scholar]
- 34.Pinkerton SD, Abramson PR. Implications of increased infectivity in early-stage HIV infection. Application of a Bernoulli-process model of HIV transmission. Eval Rev. 1996;20(5):516–540. doi: 10.1177/0193841X9602000502. [DOI] [PubMed] [Google Scholar]
- 35.Yerly S, Vora S, Rizzardi P, et al. Acute HIV infection: impact on the spread of HIV and transmission of drug resistance. AIDS. 2001;15(17):2287–2292. doi: 10.1097/00002030-200111230-00010. [DOI] [PubMed] [Google Scholar]
- 36.Hué S, Pillay D, Clewley JP, Pybus OG. Genetic analysis reveals the complex structure of HIV-1 transmission within defined risk groups. Proc Natl Acad Sci USA. 2005;102(12):4425–4429. doi: 10.1073/pnas.0407534102. [DOI] [PMC free article] [PubMed] [Google Scholar]
- 37.Novitsky V, Moyo S, Lei Q, DeGruttola V, Essex M. Impact of sampling density on the extent of HIV clustering. AIDS Res Hum Retroviruses. 2014;30(12):1226–1235. doi: 10.1089/aid.2014.0173. [DOI] [PMC free article] [PubMed] [Google Scholar]
- 38.Chan PA, Reitsma MB, Delong A, et al. Phylogenetic and geospatial evaluation of HIV-1 subtype diversity at the largest HIV center in Rhode Island. Infect Genet Evol. 2014 Apr; doi: 10.1016/j.meegid.2014.03.027. [DOI] [PMC free article] [PubMed] [Google Scholar]
- 39.Gillani FS, Zaller ND, Zeller K, et al. Changes in demographics and risk factors among persons living with HIV in an academic medical center from 2003-2007. Med Health R I. 2009;92(7):237–240. [PMC free article] [PubMed] [Google Scholar]
- 40.Rhode Island HIV/AIDS/Viral Hepatitis Epidemiologic Profile with Surrogate Data, 2012. Providence, RI: Division of Infectious Disease and Epidemiology; 2013. Rhode Island Department of Health. [Google Scholar]
- 41.Kouyos RD, von Wyl V, Yerly S, et al. Ambiguous nucleotide calls from population-based sequencing of HIV-1 are a marker for viral diversity and the age of infection. Clin Infect Dis. 2011;52(4):532–539. doi: 10.1093/cid/ciq164. [DOI] [PMC free article] [PubMed] [Google Scholar]
- 42.Delong AK, Wu M, Bennett D, et al. Sequence Quality Analysis Tool for HIV Type 1 Protease and Reverse Transcriptase. AIDS Res Hum Retroviruses. 2011 Oct; doi: 10.1089/AID.2011.0120. [DOI] [PMC free article] [PubMed] [Google Scholar]
- 43.Pineda-Peña A-C, Faria NR, Imbrechts S, et al. Automated subtyping of HIV-1 genetic sequences for clinical and surveillance purposes: performance evaluation of the new REGA version 3 and seven other tools. Infect Genet Evol. 2013;19:337–348. doi: 10.1016/j.meegid.2013.04.032. [DOI] [PubMed] [Google Scholar]
- 44.Bennett DE, Camacho RJ, Otelea D, et al. Drug resistance mutations for surveillance of transmitted HIV-1 drug-resistance: 2009 update. PLoS ONE. 2009;4(3):e4724. doi: 10.1371/journal.pone.0004724. [DOI] [PMC free article] [PubMed] [Google Scholar]
- 45.Edgar RC. MUSCLE: multiple sequence alignment with high accuracy and high throughput. Nucleic Acids Res. 2004;32(5):1792–1797. doi: 10.1093/nar/gkh340. [DOI] [PMC free article] [PubMed] [Google Scholar]
- 46.Hall TA. Bioedit: A user-friendly biological sequence alignment editor and analysis program for Windows 95/98/NT. Nucleic Acids Symp Ser. 1999;41:95–98. [Google Scholar]
- 47.Tamura K, Peterson D, Peterson N, Stecher G, Nei M, Kumar S. MEGA5: molecular evolutionary genetics analysis using maximum likelihood, evolutionary distance, and maximum parsimony methods. Mol Biol Evol. 2011;28(10):2731–2739. doi: 10.1093/molbev/msr121. [DOI] [PMC free article] [PubMed] [Google Scholar]
- 48.Prosperi MCF, Ciccozzi M, Fanti I, et al. A novel methodology for large-scale phylogeny partition. Nat Commun. 2011;2:321. doi: 10.1038/ncomms1325. [DOI] [PMC free article] [PubMed] [Google Scholar]
- 49.Lazarsfeld R, Henry NW. Latent Structure Analysis. Boston: Houghton Mifflin; 1968. [Google Scholar]
- 50.McCutcheon A. Latent Class Analysis. Newbury Park, CA: Sage; 1987. [Google Scholar]
- 51.Bocour A, Renaud TC, Wong MR, Udeagu CCN, Shepard CW. Differences in risk behaviors and partnership patterns between younger and older men who have sex with men in New York City. J Acquir Immune Defic Syndr. 2011;58(4):417–423. doi: 10.1097/QAI.0b013e318230e6d9. [DOI] [PubMed] [Google Scholar]
- 52.Ryan White HIV/AIDS Program, 2011 State Profiles. US Department of Health and Human Services; hab.hrsa.gov/stateprofiles/2011/HIV-AIDS-Epidemic.aspx. [Google Scholar]
- 53.Chan PA, Kazi S, Rana A, et al. New HIV Infections at Southern New England Academic Institutions: Implications for Prevention. AIDS research and human retroviruses. 2012 Jul; doi: 10.1089/AID.2012.0130. [DOI] [PMC free article] [PubMed] [Google Scholar]
- 54.Mayer KH, Ducharme R, Zaller ND, et al. Unprotected sex, underestimated risk, undiagnosed HIV and sexually transmitted diseases among men who have sex with men accessing testing services in a New England bathhouse. J Acquir Immune Defic Syndr. 2012;59(2):194–198. doi: 10.1097/QAI.0b013e31823bbecf. [DOI] [PMC free article] [PubMed] [Google Scholar]
- 55.Smith DM, May SJ, Tweeten S, et al. A public health model for the molecular surveillance of HIV transmission in San Diego, California. AIDS. 2009;23(2):225–232. doi: 10.1097/QAD.0b013e32831d2a81. [DOI] [PMC free article] [PubMed] [Google Scholar]
- 56.Monga N, Rehm J, Fischer B, et al. Using latent class analysis (LCA) to analyze patterns of drug use in a population of illegal opioid users. Drug Alcohol Depend. 2007;88(1):1–8. doi: 10.1016/j.drugalcdep.2006.08.029. [DOI] [PubMed] [Google Scholar]
- 57.Reboussin BA, Song E-Y, Shrestha A, Lohman KK, Wolfson M. A latent class analysis of underage problem drinking: evidence from a community sample of 16-20 year olds. Drug Alcohol Depend. 2006;83(3):199–209. doi: 10.1016/j.drugalcdep.2005.11.013. [DOI] [PMC free article] [PubMed] [Google Scholar]
- 58.Agrawal A, Lynskey MT, Madden PAF, Bucholz KK, Heath AC. A latent class analysis of illicit drug abuse/dependence: results from the National Epidemiological Survey on Alcohol and Related Conditions. Addiction. 2007;102(1):94–104. doi: 10.1111/j.1360-0443.2006.01630.x. [DOI] [PubMed] [Google Scholar]
- 59.Martins SS, Carlson RG, Alexandre PK, Falck RS. Perceived risk associated with ecstasy use: a latent class analysis approach. Addict Behav. 2011;36(5):551–554. doi: 10.1016/j.addbeh.2011.01.013. [DOI] [PMC free article] [PubMed] [Google Scholar]
- 60.Kuramoto SJ, Bohnert ASB, Latkin CA. Understanding subtypes of inner-city drug users with a latent class approach. Drug Alcohol Depend. 2011;118(2-3):237–243. doi: 10.1016/j.drugalcdep.2011.03.030. [DOI] [PMC free article] [PubMed] [Google Scholar]
- 61.Bastard M, Koita Fall MB, Lanièce I, et al. Revisiting long-term adherence to HAART in Senegal using latent class analysis. J Acquir Immune Defic Syndr. 2011 Feb; doi: 10.1097/QAI.0b013e318211b43b. [DOI] [PubMed] [Google Scholar]
- 62.Konda KA, Celentano DD, Kegeles S, Coates TJ, Caceres CF NIMH Collaborative HIV/STD Prevention Trial Group. Latent class analysis of sexual risk patterns among esquineros (street corner men) a group of heterosexually identified, socially marginalized men in urban coastal Peru. AIDS Behav. 2011;15(4):862–868. doi: 10.1007/s10461-010-9772-2. [DOI] [PMC free article] [PubMed] [Google Scholar]
- 63.McCarty-Caplan D, Jantz I, Swartz J. MSM and Drug Use: A Latent Class Analysis of Drug Use and Related Sexual Risk Behaviors. AIDS Behav. 2013 Sep; doi: 10.1007/s10461-013-0622-x. [DOI] [PubMed] [Google Scholar]
- 64.Harrell PT, Mancha BE, Petras H, Trenz RC, Latimer WW. Latent classes of heroin and cocaine users predict unique HIV/HCV risk factors. Drug Alcohol Depend. 2012;122(3):220–227. doi: 10.1016/j.drugalcdep.2011.10.001. [DOI] [PMC free article] [PubMed] [Google Scholar]
- 65.Keiser O, Spycher B, Rauch A, et al. Outcomes of antiretroviral therapy in the Swiss HIV Cohort Study: latent class analysis. AIDS Behav. 2012;16(2):245–255. doi: 10.1007/s10461-011-9971-5. [DOI] [PubMed] [Google Scholar]
- 66.Pharris A, Hoa NP, Tishelman C, et al. Community patterns of stigma towards persons living with HIV: a population-based latent class analysis from rural Vietnam. BMC Public Health. 2011;11:705. doi: 10.1186/1471-2458-11-705. [DOI] [PMC free article] [PubMed] [Google Scholar]
- 67.Wilkerson JM, Smolenski DJ, Horvath KJ, Danilenko GP, Simon Rosser BR. Online and offline sexual health-seeking patterns of HIV-negative men who have sex with men. AIDS Behav. 2010;14(6):1362–1370. doi: 10.1007/s10461-010-9794-9. [DOI] [PMC free article] [PubMed] [Google Scholar]
- 68.Avila D, Keiser O, Egger M, et al. Social meets molecular: Combining phylogenetic and latent class analyses to understand HIV-1 transmission in Switzerland. Am J Epidemiol. 2014;179(12):1514–1525. doi: 10.1093/aje/kwu076. [DOI] [PubMed] [Google Scholar]
- 69.Bello G, Afonso JM, Morgado MG. Phylodynamics of HIV-1 subtype F1 in Angola, Brazil and Romania. Infect Genet Evol. 2012;12(5):1079–1086. doi: 10.1016/j.meegid.2012.03.014. [DOI] [PubMed] [Google Scholar]
- 70.Chen JH-K, Wong K-H, Chan KC-W, To SW-C, Chen Z, Yam W-C. Phylodynamics of HIV-1 subtype B among the men-having-sex-with-men (MSM) population in Hong Kong. PLoS ONE. 2011;6(9):e25286. doi: 10.1371/journal.pone.0025286. [DOI] [PMC free article] [PubMed] [Google Scholar]
- 71.Pybus OG, Rambaut A, Harvey PH. An integrated framework for the inference of viral population history from reconstructed genealogies. Genetics. 2000;155(3):1429–1437. doi: 10.1093/genetics/155.3.1429. [DOI] [PMC free article] [PubMed] [Google Scholar]
- 72.Lemey P, Rambaut A, Pybus OG. HIV evolutionary dynamics within and among hosts. AIDS Rev. 2006;8(3):125–140. [PubMed] [Google Scholar]
- 73.Drummond AJ, Rambaut A, Shapiro B, Pybus OG. Bayesian coalescent inference of past population dynamics from molecular sequences. Mol Biol Evol. 2005;22(5):1185–1192. doi: 10.1093/molbev/msi103. [DOI] [PubMed] [Google Scholar]
- 74.McKellar MS, Cope AB, Gay CL, et al. Acute HIV-1 infection in the Southeastern United States: a cohort study. AIDS Res Hum Retroviruses. 2013;29(1):121–128. doi: 10.1089/AID.2012.0064. [DOI] [PMC free article] [PubMed] [Google Scholar]
- 75.Brenner BG, Roger M, Moisi DD, et al. Transmission networks of drug resistance acquired in primary/early stage HIV infection. AIDS. 2008;22(18):2509–2515. doi: 10.1097/QAD.0b013e3283121c90. [DOI] [PMC free article] [PubMed] [Google Scholar]
- 76.Hightow-Weidman LB, Hurt CB, Phillips G, 2nd, et al. Transmitted HIV-1 drug resistance among young men of color who have sex with men: a multicenter cohort analysis. J Adolesc Health. 2011;48(1):94–99. doi: 10.1016/j.jadohealth.2010.05.011. [DOI] [PubMed] [Google Scholar]
- 77.Youmans E, Tripathi A, Albrecht H, Gibson JJ, Duffus WA. Transmitted antiretroviral drug resistance in individuals with newly diagnosed HIV infection: South Carolina 2005-2009. South Med J. 2011;104(2):95–101. doi: 10.1097/SMJ.0b013e3181fcd75b. [DOI] [PubMed] [Google Scholar]
- 78.Huaman MA, Aguilar J, Baxa D, Golembieski A, Brar I, Markowitz N. Late presentation and transmitted drug resistance mutations in new HIV-1 diagnoses in Detroit. Int J Infect Dis. 2011;15(11):e764–e768. doi: 10.1016/j.ijid.2011.06.007. [DOI] [PubMed] [Google Scholar]
- 79.Truong H-HM, Kellogg TA, McFarland W, et al. Sentinel surveillance of HIV-1 transmitted drug resistance, acute infection and recent infection. PLoS ONE. 2011;6(10):e25281. doi: 10.1371/journal.pone.0025281. [DOI] [PMC free article] [PubMed] [Google Scholar]
- 80.Readhead AC, Gordon DE, Wang Z, et al. Transmitted antiretroviral drug resistance in New York State, 2006-2008: results from a new surveillance system. PLoS ONE. 2012;7(8):e40533. doi: 10.1371/journal.pone.0040533. [DOI] [PMC free article] [PubMed] [Google Scholar]
- 81.Baeten JM, Haberer JE, Liu AY, Sista N. Preexposure prophylaxis for HIV prevention: where have we been and where are we going? J Acquir Immune Defic Syndr. 2013;63(Suppl 2):S122–S129. doi: 10.1097/QAI.0b013e3182986f69. [DOI] [PMC free article] [PubMed] [Google Scholar]
Associated Data
This section collects any data citations, data availability statements, or supplementary materials included in this article.