

Abstract
The practice of Ayurveda, the traditional medicine of India, is based on the concept of three major constitutional types (Vata, Pitta and Kapha) defined as “Prakriti”. To the best of our knowledge, no study has convincingly correlated genomic variations with the classification of Prakriti. In the present study, we performed genome-wide SNP (single nucleotide polymorphism) analysis (Affymetrix, 6.0) of 262 well-classified male individuals (after screening 3416 subjects) belonging to three Prakritis. We found 52 SNPs (p ≤ 1 × 10⁻⁵) were significantly different between Prakritis, without any confounding effect of stratification, after 106 permutations. Principal component analysis (PCA) of these SNPs classified 262 individuals into their respective groups (Vata, Pitta and Kapha) irrespective of their ancestry, which represent its power in categorization. We further validated our finding with 297 Indian population samples with known ancestry. Subsequently, we found that PGM1 correlates with phenotype of Pitta as described in the ancient text of Caraka Samhita, suggesting that the phenotypic classification of India’s traditional medicine has a genetic basis; and its Prakriti-based practice in vogue for many centuries resonates with personalized medicine.
Among the traditional systems of medicine practiced all over the world, Ayurveda of India has a documented history dating back to 1500 BCE1,2. Though contemporary medicine is currently the mainstream of medical practice in India, Ayurveda is extensively used side by side and remains highly popular, especially in South Asia. The basic concepts of Ayurveda are; 1. five elements – panchabhuta – which constitute the physical universe including the human body and; 2. three doshas (Vata, Pitta and Kapha) or constitutional types of every human. These doshas refer broadly to the functions of motion, digestion and cumulation. Though all three doshas exist in every human being one is dominant based on which an individual’s Prakriti is determined. Prakritis are discreet phenotypes and they are determined on the basis of physical, psychological, physiological and behavioural traits, and independent of social, ethnic and geographical variables1,3,4. The etymology of these Sanskrit terms suggests that Vata originates from movement, Pitta from digestion and Kapha from cumulation. Since Prakritis underlie an individual’s predisposition to disease as well as response to treatment, it is imperative in Ayurvedic practice to identify the Prakriti of a patient before treatment5.
Concept of Prakriti in Ayurveda and its relationship with genomics was hypothesized over a decade ago6. Subsequent studies have attempted to correlate Prakriti classification with genetic information and association of single nucleotide polymorphisms (SNPs) in HLA-DRB17, CYP2C198, EGLN19, inflammatory and oxidative stress related genes10, CD markers for various blood cells11,12, DNA methylation alterations13 and risk factors of cardiovascular or inflammatory diseases have been reported14. While these studies have shown the association of specific genes with the phenotype of a particular Prakriti, the association of genomic variations with Prakriti classification was lacking. This is the first attempt to classify the Prakritis using genome-wide SNP markers and to provide a scientific basis for Prakriti classification.
Results and Discussions
A total of 3,416 normal healthy male subjects between 20–30 years of age were recruited by the Institute of Ayurveda and Integrative Medicine (IAIM), Bangalore, Karnataka (‘B’ in tables); Sinhgad College of Engineering (SCE) Pune, Maharashtra (‘P’ in tables); and Shri Dharmasthala Manjunatheshwara College of Ayurveda (SDMCA), Udupi, Karnataka (‘U’ in tables). Since the hormonal fluctuations during premenstrual and menstrual phases result in numerous physical and psychological disturbances, which may have confounding effect at the time of Prakriti assessment, we have excluded females from this study (detailed justification on inclusion of only males is given in the Methods section). However, several studies have included of both male and female subjects for Ayurveda-based studies7,8,15,16. The subjects belonged to diverse ethnic and linguistic groups, and inhabited different geographical regions. The health status of every individual was ascertained by modern as well as Ayurvedic methods (details given in the Methods). The composition of Prakriti was determined by senior Ayurvedic physicians and confirmed independently by ‘AyuSoft’ (http://ayusoft.cdac.in), a software developed based on information from classical Ayurvedic literature. The subjects, whose Prakriti was in concordance between the assessment by Ayurvedic physicians and by AyuSoft were only selected for this study. Of the total 3,416 individuals evaluated, 971 had 60%–93% dominance of one Prakriti (Table S1), of which 262 individuals (94 Vata-dominant, 75 Pitta-dominant and 93 Kapha-dominant) with the highest proportion of one predominant Prakriti were randomly selected and subjected to genome-wide SNP analysis (Affymetrix array, 6.0) and genotypes were fetched using Birdsuite software17. The proportions of each dominant and co-dominant Prakritis are given in Fig. 1; Figure S1.
Figure 1. Box-plot representing the Prakriti proportion of subjects with Vata (94), Pitta (75) and Kapha (93) dominant characteristics.
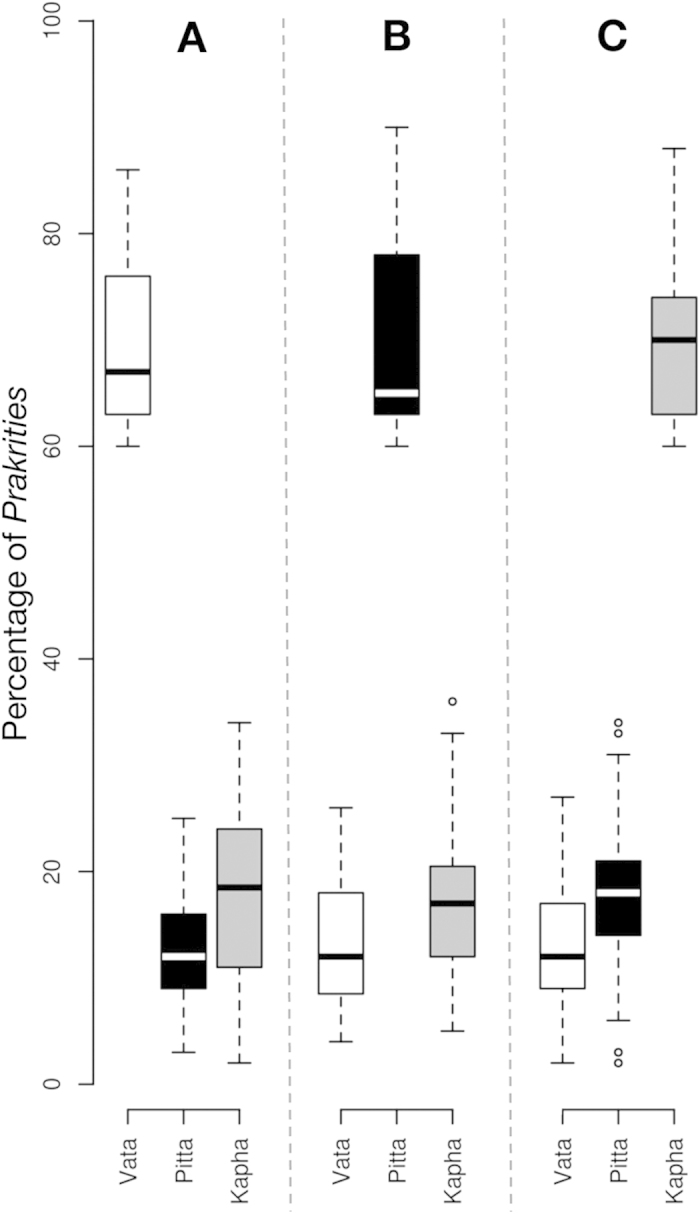
(A) Average percentage of Vata is 67%, while Pita and Kapha are 12% and 18.5%, respectively. (B) Average percentage of Pita is 65%, while Vata and Kapha are 12% and 17%, respectively. (C) Average percentage of Kapha is 70%, while Vata and Pita are 12% and 17%, respectively.
Out of 262 individuals analyzed, 245 passed the quality controls (QC) with the call rate 0.966 ± 0.0162 (Table S2). In order to validate the high-throughput data set, we randomly selected 48 markers from Affymetrix array and genotyped 48 individuals using custom-designed VeraCode GoldenGate Genotyping Assay System (Illumina, San Diego, USA). The call rate of VeraCode analysis was 99.61% and the genotype matched with Affymetrix data set (Table S3), suggesting that the genotypes obtained from Affymetrix array was genuine with minimum error (0.39%). Further, to increase the statistical power, we used Indian population data set as reference and imputation analysis was performed using Beagle (v3.3.1) software18 (Figure S1). As we had demonstrated earlier that Indian population has unique genetic architecture, we were skeptical of using non-Indian samples as a reference for imputation19. To evaluate our assumption, we masked 2%, 5% and 10% genotype of 207 unrelated Dravidian and Indo-European population samples and performed 110 simulations on chromosome 22 with four-reference populations i.e. Indian population (28 trios of Dravidian and Indo-Europeans; IN), different HapMap populations (CEU, YRI, CHB, CHS and JPT; HM), different South-Asian populations of 1000 genome project (BEB, GIH, ITU, PJL and STU; SA) and Indian along with HapMap populations (IH). As expected, imputed genotypes were more accurate with Indian samples (IN) [2% (0.9518 ± 0.0012); 5% (0.95045 ± 0.00109); 10% (0.9476 ± 0.0005)] compared to HM [2% (0.9462 ± 0.0013); 5% (0.9436 ± 0.0017); 10% (0.9396 ± 0.0005)], IH [2% (0.9463 ± 0.0014); 5% (0.9448 ± 0.0016); 10% (0.9417 ± 0.00066)] and SA [2% (0.9481 ± 0.0013); 5% (0.9471 ± 0.00098); 10% (0.9441 ± 0.00061)] samples (Table S4; Figure S2). In all the three masked data (2%, 5% and 10%), IN showed high imputation performance compared to HM, SA and IH. Even with ~10% masked data, the imputed genotypes were more accurate with IN than other references, suggesting that it is appropriate to use Indian data set for imputation. The data set of Gujarati Indians in Houston (GIH) is the only one available in the public domain, which was admixed recently, and hence does not truly represent the ANI-ASI ancestry of Indian population19,20. As the data were not suitable reference for imputation, we prepared our own reference panel of Indian population (http://www.ccmb.res.in/bic/database_pagelink.php?page=snpdata). To achieve this, we followed two steps (i) imputation of 15 trios of Indo-European and 15 trios of Dravidian, and (ii) imputation of 229 unrelated individuals imputed with the reference genotype obtained from step-I. Further, we used this reference for imputing the Prakriti individuals. In the first step, we found 10.5% and 17.8% Mendelian inconsistency in two trios, (Kashmiri Pandit) (Table S5), which were removed from the analysis. Finally, we obtained 791186 SNP markers with 0.95 ≤ R2 ≤ 1, for further analysis.
To make sure that the Prakriti samples were collected randomly and there was no major ancestral bias while collecting samples, we performed the principal component analysis (PCA)21 of 245 Prakriti samples (Figure S3). PCA analysis revealed no significant overall differences among the Prakritis (ANOVA p-value on eigenvector 1 V vs. K-0.434; V vs. P-0.89; P vs. K-0.51; and eigenvector 2 V vs. K-0.09; V vs. P-0.06; P vs. K-0.02). In order to check the ancestry of Prakriti individuals, we used our published data set of 297 Indian population samples with known ancestry19,20. These 297 samples include; 150 Dravidians, 80 Indo-European, 35 Austro-Asiatic, 27 Tibeto-Burman and 5 Great Andamanese (Table S6). We found 7,89,309 SNPs were common between Prakriti and Indian ancestral samples. In order to remove the differentiation on spurious axes21, we pruned 3,76,138 SNPs, which were in strong linkage disequilibrium (LD) (r2 > 0.75), and performed PCA with 4,13,171 SNPs. Our analysis showed that most of the Prakriti samples clustered with Dravidian and Indo-European (the two major ancestral population of India), and only 3 samples seemed to be Tibeto-Burman and admixed recently (Figure S4). Previous studies have shown that stratification could cause spurious association22,23,24,25, hence, PCA was performed21 using 4,05,782 SNPs (3,85,404 SNPs were pruned with r2 > 0.75) for 245 Prakriti samples, of which 40 were outliers and have been removed in 10 iterations with σ ≥ 6 on eigenvector 1 to 10 (Table S7; Figure S3 and S5). ANOVA analysis revealed that the Prakriti groups were not significantly different (p-value: V vs. P - 0.40 ± 0.28; V vs. K - 0.51 ± 0.32 and P vs. K - 0.48 ± 0.29) (Table S8); and 205 Prakriti samples were used for further analysis (Figure S1).
Association analysis was performed using plink software26. Since the present study has no cases and controls (patients and healthy), we considered one Prakriti as case and the remaining two Prakritis as controls, and performed association analyses in three combinations: Vata vs. Kapha and Pitta (V vs. PK); Pitta vs. Kapha and Vata (P vs. VK); Kapha vs. Pitta and Vata (K vs. VP). Prior to association analysis, 3,890; 4,153 and 4,124, respectively, markers were removed from 791186 markers, which were not in Hardy-Weinberg equilibrium (HWE) i.e. p-value < 0.001 in controls of V vs. PK, P vs. VK and K vs. VP; respectively. The three combination association results were further used to identify the SNPs that were significant. Considering the fact that none of the samples represents 100% single Prakriti, we did not expect very low p-value in the association analysis. In this scenario, truly associated loci may co-exist with false positive markers and can be identified by permutation analysis. As expected, we observed that SNPs having approximately same p-value in the extreme tail of theoretical distribution failed to achieve 106 permutations (Table 1). For example, rs2939743 having p-value 7.61 × 10⁻⁵ dropped at 142717th permutation while rs10197747 having p-value 2.50 × 10⁻⁵ achieved 106 permutations, which of course revealed that rs2939743 is false positive. Similarly, we found 52 true positive SNPs achieved 1 million simulations with theoretical p-value ≤ 1 × 10⁻⁵ (details are given in Table 1; Figure S6).
Table 1. Empirical and theoretical distribution of the associated markers (p-value ≤1 × 10⁻⁵) of Vvs. PK, Pvs.VK and Kvs.VP.
| Chr | rsIDs | Gene | Position(hg19) | Minorallele | Theoretical distribution |
Empirical distribution |
|||||||
|---|---|---|---|---|---|---|---|---|---|---|---|---|---|
| MAFPrakriti I | MAFPrakritiII + III | Majorallele | Chi-square | P-value | ODD-ratio | P-value | No.of permutation | Passed inpermutation | |||||
| Vata | |||||||||||||
| 2 | rs10197747 | – | 57644785 | C | 0.06875 | 0 | A | 17.66 | 2.64E–05 | NA | 2.50E–05 | 1000000 | Passed |
| 3 | rs10446349 | VPS8 | 186131720 | G | 0.6 | 0.4 | A | 15.64 | 7.66E–05 | 2.25 | 2.40E–05 | 1000000 | Passed |
| 1 | rs10489167 | NFYC | 40949053 | A | 0.15 | 0.036 | G | 17.13 | 3.49E–05 | 4.725 | 6.57E–05 | 639360 | – |
| 15 | rs10518915 | CGNL1 | 55472117 | C | 0.6062 | 0.372 | A | 21.53 | 3.49E–06 | 2.599 | 4.00E–06 | 1000000 | Passed |
| 5 | rs10866665 | – | 172908297 | G | 0.325 | 0.54 | A | 18.18 | 2.01E–05 | 0.4102 | 3.90E–05 | 1000000 | Passed |
| 10 | rs10882293 | PDE6C | 95401687 | T | 0.6188 | 0.416 | C | 16.04 | 6.19E–05 | 2.278 | 6.60E–05 | 636363 | – |
| 5 | rs11134808 | – | 172909959 | G | 0.325 | 0.536 | A | 17.52 | 2.84E–05 | 0.4168 | 4.55E–05 | 924075 | – |
| 7 | rs11768155 | SEMA3C | 80203792 | C | 0.1062 | 0.016 | T | 16.35 | 5.26E–05 | 7.311 | 8.56E–05 | 490509 | – |
| 10 | rs11815547 | – | 13647633 | T | 0.1688 | 0.044 | A | 18.06 | 2.15E–05 | 4.411 | 8.19E–05 | 513000 | – |
| 2 | rs11902715 | FIGN | 164190114 | G | 0.2062 | 0.068 | A | 17.41 | 3.01E–05 | 3.561 | 3.60E–05 | 1000000 | Passed |
| 10 | rs12266365 | PDE6C | 95398869 | C | 0.6188 | 0.416 | A | 16.04 | 6.19E–05 | 2.278 | 6.60E–05 | 636363 | – |
| 2 | rs12473563 | – | 226605892 | G | 0.2375 | 0.452 | A | 19.29 | 1.12E–05 | 0.3776 | 6.48E–05 | 648351 | – |
| 6 | rs12526892 | PACRG,PACRG–AS1 | 163641063 | A | 0.15 | 0.344 | G | 18.7 | 1.53E–05 | 0.3365 | 6.00E–06 | 1000000 | Passed |
| 10 | rs12781996 | – | 108025031 | A | 0.1 | 0.26 | G | 15.75 | 7.21E–05 | 0.3162 | 3.10E–05 | 1000000 | Passed |
| 2 | rs13006806 | – | 226606872 | C | 0.2375 | 0.452 | G | 19.29 | 1.12E–05 | 0.3776 | 6.48E–05 | 648351 | – |
| 10 | rs1326217 | PDE6C | 95400989 | T | 0.6188 | 0.404 | A | 18.01 | 2.20E–05 | 2.394 | 3.10E–05 | 1000000 | Passed |
| 8 | rs13273017 | RIMS2 | 104994931 | T | 0.4875 | 0.288 | C | 16.74 | 4.30E–05 | 2.352 | 7.83E–05 | 549450 | – |
| 2 | rs13396046 | – | 57707740 | A | 0.06875 | 0 | G | 17.66 | 2.64E–05 | NA | 2.50E–05 | 1000000 | Passed |
| 2 | rs1376616 | – | 79479938 | C | 0.1 | 0.012 | T | 17.1 | 3.56E–05 | 9.148 | 3.60E–05 | 1000000 | Passed |
| 11 | rs1439528 | – | 96115783 | A | 0.625 | 0.408 | G | 18.38 | 1.81E–05 | 2.418 | 1.20E–05 | 1000000 | Passed |
| 2 | rs1440472 | FIGN | 164193843 | T | 0.2625 | 0.108 | C | 16.64 | 4.52E–05 | 2.94 | 2.60E–05 | 1000000 | Passed |
| 15 | rs1664454 | CGNL1 | 55469925 | T | 0.5188 | 0.288 | C | 22.09 | 2.60E–06 | 2.665 | 5.00E–06 | 1000000 | Passed |
| 8 | rs1845928 | RIMS2 | 104977275 | C | 0.4875 | 0.288 | T | 16.74 | 4.30E–05 | 2.352 | 7.83E–05 | 549450 | – |
| 7 | rs1949971 | SEMA3C | 80212278 | A | 0.1062 | 0.016 | G | 16.35 | 5.26E–05 | 7.311 | 8.56E–05 | 490509 | – |
| 1 | rs2744803 | NFYC | 40955692 | T | 0.15 | 0.036 | C | 17.13 | 3.49E–05 | 4.725 | 6.57E–05 | 639360 | – |
| 21 | rs2825953 | – | 20315181 | A | 0.3312 | 0.152 | G | 18.15 | 2.04E–05 | 2.763 | 5.67E–05 | 741000 | – |
| 10 | rs2901714 | PDE6C | 95399009 | A | 0.6125 | 0.4 | T | 17.64 | 2.67E–05 | 2.371 | 2.50E–05 | 1000000 | Passed |
| 4 | rs2939743 | C4orf19 | 37219957 | A | 0.5375 | 0.34 | G | 15.65 | 7.61E–05 | 2.256 | 0.0002943 | 142714 | – |
| 12 | rs3759173 | TBX3 | 113607258 | A | 0.15 | 0.032 | C | 18.88 | 1.39E–05 | 5.338 | 2.30E–05 | 1000000 | Passed |
| 7 | rs41486545 | SEMA3C | 80216538 | G | 0.1062 | 0.016 | A | 16.35 | 5.26E–05 | 7.311 | 8.56E–05 | 490509 | – |
| 8 | rs4463386 | RIMS2 | 104955665 | A | 0.4813 | 0.288 | C | 15.75 | 7.23E–05 | 2.294 | 7.83E–05 | 549450 | – |
| 8 | rs4467913 | RIMS2 | 105104591 | A | 0.4437 | 0.252 | G | 16.3 | 5.39E–05 | 2.368 | 5.46E–05 | 770000 | – |
| 16 | rs4843892 | – | 84627121 | A | 0.6 | 0.4 | G | 15.64 | 7.66E–05 | 2.25 | 7.99E–05 | 525474 | – |
| 3 | rs6443999 | VPS8 | 186056249 | C | 0.6062 | 0.404 | T | 15.98 | 6.40E–05 | 2.271 | 5.96E–05 | 705294 | – |
| 10 | rs6583901 | PDE6C | 95399988 | T | 0.3438 | 0.152 | C | 20.45 | 6.11E–06 | 2.922 | 3.30E–05 | 1000000 | Passed |
| 1 | rs6586471 | – | 104648021 | T | 0.5125 | 0.292 | C | 20.17 | 7.07E–06 | 2.549 | 4.00E–06 | 1000000 | Passed |
| 2 | rs6731290 | FIGN | 164196489 | C | 0.1812 | 0.056 | T | 16.3 | 5.40E–05 | 3.732 | 3.70E–05 | 1000000 | Passed |
| 2 | rs6748662 | – | 57710603 | G | 0.06875 | 0 | A | 17.66 | 2.64E–05 | NA | 2.50E–05 | 1000000 | Passed |
| 5 | rs7447285 | LOC643201 | 175541987 | T | 0.075 | 0.004 | C | 16.02 | 6.27E–05 | 20.19 | 5.79E–05 | 726000 | – |
| 5 | rs7717957 | – | 172914029 | C | 0.325 | 0.54 | G | 18.18 | 2.01E–05 | 0.4102 | 3.70E–05 | 1000000 | Passed |
| 1 | rs823681 | NFYC,MIR30C1 | 41004011 | T | 0.15 | 0.036 | C | 17.13 | 3.49E–05 | 4.725 | 6.57E–05 | 639360 | – |
| 1 | rs9438945 | RIMS3 | 40912171 | C | 0.15 | 0.036 | G | 17.13 | 3.49E–05 | 4.725 | 6.57E–05 | 639360 | – |
| 13 | rs9547240 | LINC00351 | 84973191 | A | 0.1875 | 0.056 | G | 17.61 | 2.71E–05 | 3.89 | 6.75E–05 | 622000 | – |
| 3 | rs9815900 | – | 45321192 | G | 0.4062 | 0.22 | C | 16.35 | 5.27E–05 | 2.426 | 8.03E–05 | 523000 | – |
| 3 | rs9830734 | VPS8 | 186033195 | T | 0.625 | 0.408 | C | 18.38 | 1.81E–05 | 2.418 | 5.00E–06 | 1000000 | Passed |
| 2 | rs986846 | – | 239172751 | T | 0.5813 | 0.36 | C | 19.33 | 1.10E–05 | 2.468 | 1.50E–05 | 1000000 | Passed |
| Pitta | |||||||||||||
| 12 | rs1005375 | – | 3307020 | T | 0.6083 | 0.3862 | C | 16.91 | 3.91E–05 | 2.468 | 9.18E–05 | 457542 | – |
| 16 | rs10163360 | RBFOX1 | 6622152 | A | 0.2833 | 0.1172 | G | 16.92 | 3.89E–05 | 2.977 | 7.79E–05 | 539460 | – |
| 2 | rs10192833 | SLC8A1 | 40480999 | C | 0.3417 | 0.1621 | T | 16.24 | 5.58E–05 | 2.683 | 6.52E–05 | 644000 | – |
| 7 | rs10231685 | LHFPL3 | 103963525 | G | 0.3 | 0.1207 | A | 19.06 | 1.27E–05 | 3.122 | 2.00E–05 | 1000000 | Passed |
| 15 | rs10518915 | CGNL1 | 55472117 | C | 0.3 | 0.531 | A | 18.22 | 1.97E–05 | 0.3785 | 2.90E–05 | 1000000 | Passed |
| 10 | rs10994942 | – | 63260442 | A | 0.525 | 0.3103 | G | 16.72 | 4.33E–05 | 2.456 | 6.05E–05 | 694305 | – |
| 10 | rs10994948 | – | 63270054 | G | 0.5 | 0.2793 | A | 18.32 | 1.87E–05 | 2.58 | 8.00E–06 | 1000000 | Passed |
| 9 | rs11792644 | – | 121598411 | T | 0.09167 | 0.01034 | A | 17.02 | 3.70E–05 | 9.654 | 9.39E–05 | 447104 | – |
| 16 | rs12373036 | – | 54058839 | A | 0.4 | 0.2069 | G | 16.31 | 5.37E–05 | 2.556 | 0.000101 | 416000 | – |
| 3 | rs12490846 | PTPRG | 61700707 | A | 0.2667 | 0.09655 | G | 19.66 | 9.24E–06 | 3.403 | 8.71E–05 | 482000 | – |
| 13 | rs12584835 | – | 104098930 | A | 0.325 | 0.1483 | G | 16.57 | 4.69E–05 | 2.766 | 8.04E–05 | 522477 | – |
| 7 | rs13233643 | LHFPL3 | 103961859 | T | 0.2917 | 0.1207 | C | 17.53 | 2.84E–05 | 3 | 6.12E–05 | 686313 | – |
| 2 | rs13423251 | NCKAP5 | 133952350 | A | 0.3 | 0.131 | G | 16.38 | 5.18E–05 | 2.842 | 0.0001232 | 341000 | – |
| 16 | rs1558564 | RBFOX1 | 6620427 | A | 0.35 | 0.1448 | T | 21.93 | 2.82E–06 | 3.179 | 4.45E–05 | 944000 | – |
| 3 | rs1602754 | – | 104529406 | C | 0.1167 | 0.01724 | T | 18.99 | 1.32E–05 | 7.528 | 6.79E–05 | 619000 | – |
| 6 | rs16890791 | LCA5 | 80244701 | C | 0.375 | 0.1828 | T | 17.25 | 3.29E–05 | 2.683 | 9.71E–05 | 432567 | – |
| 3 | rs17065308 | PTPRG | 61722777 | C | 0.375 | 0.1862 | T | 16.52 | 4.82E–05 | 2.622 | 7.96E–05 | 527472 | – |
| 14 | rs17124831 | C14orf166 | 51523799 | C | 0.4583 | 0.2483 | T | 17.52 | 2.85E–05 | 2.562 | 7.83E–05 | 536463 | – |
| 13 | rs2209540 | – | 94437798 | G | 0.2583 | 0.09655 | T | 18.03 | 2.17E–05 | 3.259 | 5.36E–05 | 783000 | – |
| 1 | rs2269238 | PGM1 | 63890125 | A | 0.075 | 0.2552 | C | 17.07 | 3.61E-05 | 0.2367 | 3.30E–05 | 1000000 | Passed |
| 1 | rs2269239 | PGM1 | 63881947 | C | 0.075 | 0.2586 | G | 17.57 | 2.77E–05 | 0.2324 | 1.90E–05 | 1000000 | Passed |
| 1 | rs2269240 | PGM1 | 63881852 | G | 0.075 | 0.2586 | A | 17.57 | 2.77E–05 | 0.2324 | 1.90E–05 | 1000000 | Passed |
| 1 | rs2269241 | PGM1 | 63881359 | G | 0.075 | 0.2621 | A | 18.07 | 2.12E–05 | 0.2283 | 2.20E–05 | 1000000 | Passed |
| 15 | rs2388017 | – | 91094840 | T | 0.2917 | 0.5276 | C | 19.03 | 1.29E–05 | 0.3687 | 3.00E–05 | 1000000 | Passed |
| 10 | rs2398215 | – | 10425666 | A | 0.2667 | 0.4897 | G | 17.28 | 3.23E–05 | 0.379 | 7.00E–06 | 1000000 | Passed |
| 6 | rs2655668 | LCA5 | 80248839 | C | 0.45 | 0.2345 | T | 18.86 | 1.41E–05 | 2.671 | 1.90E–05 | 1000000 | Passed |
| 6 | rs2655670 | LCA5 | 80251062 | A | 0.3917 | 0.1966 | G | 17.07 | 3.61E–05 | 2.632 | 5.81E–05 | 723000 | – |
| 6 | rs2655688 | – | 80316792 | G | 0.5917 | 0.3724 | C | 16.59 | 4.65E–05 | 2.442 | 8.02E–05 | 524000 | – |
| 21 | rs2835262 | SETD4 | 36349861 | C | 0.1333 | 0.02759 | T | 17.22 | 3.32E–05 | 5.423 | 0.0001224 | 343000 | – |
| 15 | rs2892383 | – | 91093506 | T | 0.3 | 0.5414 | C | 19.85 | 8.38E–06 | 0.3631 | 2.00E–05 | 1000000 | Passed |
| 5 | rs420150 | – | 141164192 | A | 0.275 | 0.1034 | C | 19.21 | 1.17E–05 | 3.287 | 1.30E–05 | 1000000 | Passed |
| 3 | rs4688663 | PTPRG | 61716091 | C | 0.3667 | 0.1793 | T | 16.61 | 4.58E–05 | 2.65 | 8.08E–05 | 520000 | – |
| 17 | rs4789092 | RAB37,CD300LF | 70203226 | C | 0.1917 | 0.05517 | A | 18.37 | 1.82E–05 | 4.061 | 1.50E–05 | 1000000 | Passed |
| 1 | rs619413 | HSD52 | 59394979 | T | 0.2583 | 0.4862 | G | 18.1 | 2.10E–05 | 0.3681 | 1.90E–05 | 1000000 | Passed |
| 2 | rs6546604 | – | 70496311 | A | 0.4 | 0.2 | G | 17.71 | 2.57E–05 | 2.667 | 6.08E–05 | 691308 | – |
| 2 | rs6719806 | SLC8A1 | 40512777 | C | 0.35 | 0.1655 | A | 16.86 | 4.02E–05 | 2.715 | 5.05E–05 | 831000 | – |
| 7 | rs6969323 | LHFPL3 | 104001723 | A | 0.3333 | 0.1483 | C | 18 | 2.21E–05 | 2.872 | 3.50E–05 | 1000000 | Passed |
| 15 | rs7162785 | – | 91094879 | A | 0.3167 | 0.5379 | C | 16.67 | 4.45E–05 | 0.3981 | 8.28E–05 | 507492 | – |
| 16 | rs7200031 | RBFOX1 | 6606974 | C | 0.3083 | 0.1345 | A | 16.99 | 3.76E–05 | 2.869 | 6.77E–05 | 620000 | – |
| 17 | rs739354 | GAS7 | 9945013 | C | 0.1917 | 0.05862 | A | 17.06 | 3.61E–05 | 3.808 | 8.59E–05 | 489000 | – |
| 6 | rs767789 | LCA5 | 80290087 | T | 0.5917 | 0.3655 | C | 17.69 | 2.59E–05 | 2.515 | 3.70E–05 | 1000000 | Passed |
| 6 | rs790607 | – | 91163700 | A | 0.3083 | 0.5276 | G | 16.41 | 5.11E–05 | 0.3992 | 3.70E–05 | 1000000 | Passed |
| 14 | rs8007410 | – | 55637508 | G | 0.375 | 0.1862 | T | 16.52 | 4.82E–05 | 2.622 | 8.49E–05 | 494505 | – |
| 13 | rs9540498 | – | 33802831 | C | 0.375 | 0.1793 | G | 18 | 2.21E–05 | 2.746 | 7.41E–05 | 567000 | – |
| Kapha | |||||||||||||
| 8 | rs10086758 | – | 76924738 | T | 0.1 | 0.2929 | G | 18.55 | 1.66E–05 | 0.2683 | 9.28E–05 | 452547 | – |
| 9 | rs10114425 | – | 110192021 | T | 0.1846 | 0.05357 | C | 17.71 | 2.57E–05 | 4 | 0.000112 | 375000 | – |
| 12 | rs10778435 | CASC18 | 104643081 | A | 0.3077 | 0.1393 | G | 16.19 | 5.74E–05 | 2.746 | 8.72E–05 | 481518 | – |
| 12 | rs10848194 | – | 129791290 | A | 0.2615 | 0.4893 | C | 18.94 | 1.35E–05 | 0.3697 | 1.80E–05 | 1000000 | Passed |
| 12 | rs10861491 | CASC18 | 104643051 | G | 0.3077 | 0.1393 | A | 16.19 | 5.74E–05 | 2.746 | 8.72E–05 | 481518 | – |
| 1 | rs11166345 | – | 100045548 | A | 0.2846 | 0.5107 | G | 18.43 | 1.76E–05 | 0.3812 | 1.70E–05 | 1000000 | Passed |
| 3 | rs11714306 | CLSTN2 | 141227150 | C | 0.6308 | 0.4143 | T | 16.66 | 4.47E–05 | 2.415 | 4.94E–05 | 850149 | – |
| 4 | rs11933940 | C4orf19 | 37238765 | A | 0.2769 | 0.4893 | G | 16.42 | 5.09E–05 | 0.3998 | 0.0001007 | 417000 | – |
| 2 | rs12473563 | – | 226605892 | G | 0.5154 | 0.3 | A | 17.7 | 2.58E–05 | 2.481 | 8.75E–05 | 480000 | – |
| 2 | rs13006806 | – | 226606872 | C | 0.5154 | 0.3 | G | 17.7 | 2.58E–05 | 2.481 | 8.75E–05 | 480000 | – |
| 2 | rs13429987 | – | 184201539 | G | 0.1308 | 0.3179 | A | 16.21 | 5.67E–05 | 0.3229 | 3.90E–05 | 1000000 | Passed |
| 2 | rs1438266 | KYNU | 143363789 | A | 0.4692 | 0.2643 | G | 16.88 | 3.97E–05 | 2.461 | 8.58E–05 | 489510 | – |
| 5 | rs152270 | – | 141123895 | C | 0.02308 | 0.1571 | T | 15.72 | 7.34E–05 | 0.1267 | 8.82E–05 | 476000 | – |
| 5 | rs1553239 | – | 30841081 | T | 0.2077 | 0.06786 | C | 17.43 | 2.98E–05 | 3.601 | 5.78E–05 | 726273 | – |
| 5 | rs17592250 | LOC101929380 | 86526909 | T | 0.09231 | 0.01071 | C | 16.77 | 4.22E–05 | 9.39 | 8.43E–05 | 498501 | – |
| 10 | rs17731 | KLF6 | 3811561 | A | 0.4846 | 0.2464 | G | 23.07 | 1.56E–06 | 2.875 | 2.00E–06 | 1000000 | Passed |
| 18 | rs17804058 | CD226 | 65755221 | G | 0.1615 | 0.03929 | C | 18.44 | 1.75E–05 | 4.711 | 8.72E–05 | 481518 | – |
| 14 | rs1862127 | ADCK1 | 77477049 | T | 0.3385 | 0.15 | C | 19.02 | 1.29E–05 | 2.899 | 2.00E–06 | 1000000 | Passed |
| 14 | rs2105269 | GALNT16 | 68816987 | T | 0.6385 | 0.4214 | C | 16.73 | 4.30E–05 | 2.424 | 6.67E–05 | 629370 | – |
| 1 | rs213490 | SSBP3 | 54627572 | T | 0.5769 | 0.35 | C | 18.74 | 1.50E–05 | 2.532 | 1.90E–05 | 1000000 | Passed |
| 20 | rs2327233 | – | 9808517 | C | 0.5462 | 0.3393 | T | 15.77 | 7.16E–05 | 2.343 | 5.45E–05 | 771000 | – |
| 20 | rs2876175 | – | 9820828 | C | 0.3462 | 0.5607 | T | 16.35 | 5.26E–05 | 0.4148 | 4.21E–05 | 998000 | – |
| 4 | rs2939743 | C4orf19 | 37219957 | A | 0.2462 | 0.4964 | G | 22.87 | 1.73E–06 | 0.3312 | 5.00E–06 | 1000000 | Passed |
| 12 | rs3751176 | – | 127241860 | A | 0.1846 | 0.3821 | G | 15.93 | 6.57E–05 | 0.3661 | 7.84E–05 | 536000 | – |
| 14 | rs4020132 | – | 77481947 | A | 0.3385 | 0.15 | G | 19.02 | 1.29E–05 | 2.899 | 2.00E–06 | 1000000 | Passed |
| 4 | rs4107575 | C4orf19 | 37238678 | A | 0.2769 | 0.4893 | G | 16.42 | 5.09E–05 | 0.3998 | 0.0001007 | 417000 | – |
| 14 | rs4903671 | – | 77481783 | A | 0.3231 | 0.1357 | C | 19.84 | 8.40E–06 | 3.039 | 6.00E–06 | 1000000 | Passed |
| 22 | rs5765425 | FBLN1 | 44271097 | A | 0.3462 | 0.5607 | G | 16.35 | 5.26E–05 | 0.4148 | 4.82E–05 | 872127 | – |
| 20 | rs6039614 | – | 9815136 | C | 0.3462 | 0.5643 | A | 16.9 | 3.94E–05 | 0.4088 | 3.30E–05 | 1000000 | Passed |
| 20 | rs6071392 | – | 58880119 | T | 0.3231 | 0.15 | C | 16.33 | 5.33E–05 | 2.705 | 4.21E–05 | 998000 | – |
| 20 | rs6118782 | – | 9811911 | C | 0.3538 | 0.5679 | T | 16.26 | 5.51E–05 | 0.4167 | 5.02E–05 | 837162 | – |
| 1 | rs6688707 | – | 100040996 | T | 0.2846 | 0.5107 | G | 18.43 | 1.76E–05 | 0.3812 | 1.70E–05 | 1000000 | Passed |
| 2 | rs6733573 | – | 204840871 | T | 0.3308 | 0.1536 | C | 16.82 | 4.12E–05 | 2.724 | 5.29E–05 | 794000 | – |
| 3 | rs6770415 | – | 13242771 | G | 0.3231 | 0.1429 | A | 18.02 | 2.18E–05 | 2.864 | 7.16E–05 | 587000 | – |
| 3 | rs7616568 | – | 2045846 | G | 0.3385 | 0.5643 | A | 18.11 | 2.08E–05 | 0.3951 | 1.20E–05 | 1000000 | Passed |
| 8 | rs7845105 | TRAPPC9 | 140978153 | T | 0.06154 | 0 | G | 17.57 | 2.76E–05 | NA | 6.90E–05 | 609000 | – |
| 15 | rs8026848 | FAM189A1 | 27361149 | C | 0.2231 | 0.07857 | G | 17.02 | 3.70E–05 | 3.367 | 5.58E–05 | 753000 | – |
| 19 | rs8103262 | ZNF808,ZNF701 | 57757626 | C | 0.3 | 0.125 | T | 18.38 | 1.81E–05 | 3 | 3.30E–05 | 1000000 | Passed |
| 6 | rs9466669 | – | 23297836 | A | 0.06154 | 0 | G | 17.57 | 2.76E–05 | NA | 8.16E–05 | 514485 | – |
| 3 | rs9815240 | PLSCR4 | 147394867 | C | 0.1538 | 0.03214 | A | 20.01 | 7.72E–06 | 5.475 | 1.70E–05 | 1000000 | Passed |
| 2 | rs986846 | – | 239172751 | T | 0.3 | 0.5143 | C | 16.5 | 4.87E–05 | 0.4048 | 2.40E–05 | 1000000 | Passed |
It is well known that some markers differ in allele frequency more across ancestral population, compared to other set of markers. Moreover, natural selection might be the reason for this phenomenon because it acts locus-specific manner21. We speculate that the above so-called true positive loci might be artifacts of population stratification because of high probability of false positive results at the p-value, which observed in association analysis. Hence, we performed extensive statistical analyses to control these confounding factors and/or population stratification. Prevailing methods include genomic control and EIGENSTRAT to find such confounding effect of stratification. Genomic control uses uniform inflation factor to correct stratification, which is not sufficient for those SNPs having high frequency differences between ancestors21. Hence, we proceeded with EIGENSTRAT and found p-value did not change drastically (Table S9). To further confirm, we used variance component model (implemented in EMMAX)27 and mixed-linear model of association analysis (implemented in GCTA)28, which can correct sample structure in association, but have different statistics comparative to eigenstrat. Intriguingly, even with this analysis, we did not observe any drastic change in the p-value (Table S9). This has proved that these 52 SNPs were genuine characteristics of Prakriti and not derived from ancestry. Moreover, we also explored the allele frequency differences between centers; however, we did not find any significant difference for these 52 SNPs (Table S10). We further explored the power of 52 SNPs in Prakritis genetic differentiation (Figure S1). In principal component analysis, 19 SNPs were excluded with r2 > 0.75 and, as expected, we found striking separation of subjects according to their Prakriti (Fig. 2A). On eigenvector-1 (eigenvalue = 18.168248) Pitta significantly differentiated against Vata and Kapha (p-value = 1.11022 × 10⁻¹⁶, 4.44089 × 10⁻¹⁶, respectively); while on eigenvector 2 (eigenvalue = 15.890861) Kapha was significantly different compared to Vata and Pitta (p-value = 3.33067 × 10⁻¹⁶ and ~0 respectively).
Figure 2.
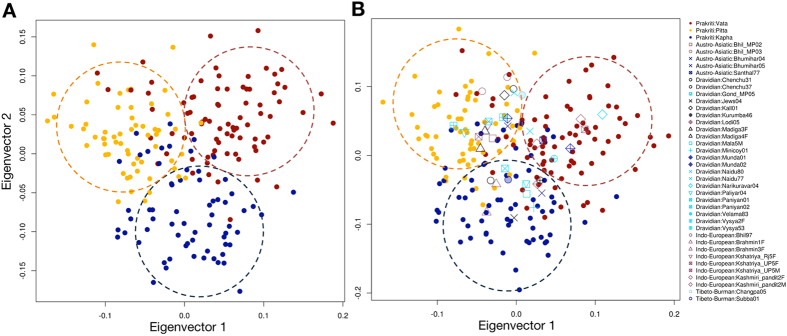
Principal component analysis (PCA) with 52 SNPs that showed p-value of <1 × 10⁻⁵ (A) PCA of Prakriti individuals showing three clusters (Vata, Pitta, Kapha), despite their linguistic, ethnic and geographical diversity. (B) PCA projection of Indian population samples with Prakriti individuals.
To examine the statistical power of these 52 markers for categorizing the samples with unknown Prakriti, we generated a statistical model (see methods). Initially, we applied it on 205 samples and found 23.9% (49 out of 205) were explained by the proposed model (Table S11). Further, we applied it on 297 Indian (population) samples and found 37 individuals (5 Austro-Asiatic; 22 Dravidian; 8 Indo-European and 2 Tibeto-Burman) satisfying the model. According to the model, 7 individuals were Vata, 20 were Pitta and 11 were Kapha. Interestingly, Indian population samples, which belong to one Prakriti were from different ancestry (Table S12), suggesting that these makers could separate the Prakritis, irrespective of their ancestry. To confirm the proposed model, we projected these 37 individuals on eigenvector of Prakriti samples and found that these individuals clustered with Prakriti as predicted in the model (Fig. 2B). It suggests that the cluster is based on Prakriti, and is not due to the ancestry of samples. That would also suggest that the phenotypic variations have a genetic basis, which would be shared by Prakritis of Ayurveda.
Further, we used these 52 markers to find the genotype-phenotype correlations. We observed that 2 markers (rs10518915 and rs986846) were associated with two different Prakriti; rs10518915 with Vata and Pitta, while rs986846 with Kapha and Vata. This observation prompted us to believe that different alleles of the same locus might be influencing different Prakriti (Table 1). In order to correlate the functional relevance of these SNPs, we divided them into genic and non-genic. The SNPs, which are within 10 kb of gene, were considered genic; while others as non-genic29,30. We found 28 were genic SNPs, of which 12 were in Vata (7 genes), 11 in Pitta (7 genes), and 6 in Kapha (7 genes) (Table 1). To correlate the function of these genes with respect to the characteristics of Prakritis, we searched in Kyoto Encyclopedia of Genes and Genomes (KEGG) pathway and Reactome event and found PGM1 gene associated with the Pitta phenotype. In Ayurveda, characteristics of Pitta include digestion, metabolism and energy production. Interestingly, we found PGM1 gene is in the center of many metabolic pathways i.e. glycolysis or gluconeogenesis (hsa00010); pentose phosphate pathway (hsa00030); galactose metabolism (hsa00052); purine metabolism (hsa00230) and; starch and sucrose metabolism (hsa00500) (Figure S7). Our finding suggests that the function of the gene directly correlates with the role of Pitta in metabolism as described in Ayurvedic literature.
In addition, we have checked the PGM1 gene markers in Affymetrix data set and found 4 markers (rs2269241, rs2269240, rs2269239,and rs2269238) were associated with Pitta Prakriti and all are in strong Linkage Disequilibrium (LD) (Figure S8). Therefore, to find the functionally relevant variants, we sequenced the whole exons and UTRs of the PGM1 gene in 78 individuals using Ion Torrent PGM (Life Technologies, USA). We found 23 variations in the gene, of which 8 were novel (Table S13). Interestingly, one non-synonymous; c.1258T > C (p.Tyr420His) (rs11208257) variant was present in the LD block and found in association with Pitta Prakriti (p-value–7.049 × 10⁻³). The frequency of the mutant allele “C” was 5.8% in Pitta and 20% in Kapha Prakriti (Table S14). This result prompted us to replicate the marker (rs11208257) in additional samples. We genotyped this marker (rs11208257) for 665 Prakriti individuals (299 Vata, 164 Pitta and 202 Kapha) using Sanger sequencing method. Initially, we analyzed the distribution of the genotype among participating centres and found “U” samples (collected from Udupi centre) were not in HWE (p-value - 0.04) (Table S15). Hence, we excluded 169 “U” samples from the analysis. Association analysis revealed that allelic and genotype distribution of the marker rs11208257 is significantly different in Pitta Prakriti against Vata and Kapha with p-value- 2.06 × 10⁻²; p-value- 6.16 × 10⁻³, respectively. Further, we explored the association between P vs. V and P vs. K; and found significant p-value - 7.61 × 10⁻³ and 2.35 × 10⁻², respectively. The results would therefore suggest that Vata differs more from the Pitta Prakriti than Kapha (Table S16). We further screened 1108 randomly selected Indians and 992 HapMap samples and found that the frequency of mutant allele “C” was 17.9% among Indians, 15.5–17.6% in the Europeans, 14.5–18.8% in East Asians, 42% in Mexican, 15.3% in admixed Indians (GIH) and 12.8–28.3% in Africans. Indians have comparable frequency with Europeans and GIH (Table S17). Interestingly, we found Pitta has less frequency of mutant “C” allele, and Vata and Kapha have comparable frequency with overall Indian population. To explore the functional relevance of the variant, we used SIFT software and found that the mutation is damaging with 0.01 score and thus substitution at this position may affect the protein function. Our data suggest that the SNP (rs11208257) in PGM1 gene is linked with one of the main features (energy production), which is more homogenous and constant in Pitta than with Vata and Kapha, and a genotype correlation exists for the characteristics of Prakriti classification.
In conclusion, our preliminary study suggests that the Prakriti classification, as a foundation for the practice of Ayurveda, has a genetic basis and does provide clues for further studies.
Methods
Selection of subjects and Prakriti assessment
Selection of subjects and evaluation of the Prakriti (the human classification of Indian ancient medicine) were carried out at three centres; 1. Institute of Ayurveda and Intergrative Medicine (IAIM), Bangalore, Karnataka; 2. Sinhgad College of Engineering (SCE) Pune, Maharashtra; and 3. Shri Dharmasthala Manjunatheshwara College of Ayurveda (SDMCA) Udupi, Karnataka. This study was approved by Institutional Ethics Committees (IECs) of all the collaborative centres and the methods were carried out in accordance with the approved guidelines. We have screened normal and healthy male subjects, who were between 20–30 years. Although several Ayurveda-based studies have included both male and female subjects7,8,15,16, we have excluded female subjects from this study to minimize the confounding variations. Prakriti of an individual is determined based on defined anatomical, physiological psychological and behavioural characteristics. During actual assessment of Prakriti, the Ayurvedic physician needs to factor in these characteristics. One such aspect is the cyclical hormonal changes that occur in women, particularly the menstrual cycle. The hormonal fluctuations result in numerous physical and psychological disturbances, which occur in the premenstrual and menstrual phases. Existing evidence suggest that about 97% of young nulliparous women experience varying degrees of such disturbances31. These elicitable and visible features can confound or obscure the Prakriti assessment process. For example, premenstrual irritability occurring in a woman of Kapha Prakriti is confounding, since Kapha Prakriti individuals normally possess low irritability. Although the Ayurvedic physicians routinely enquire about the menstrual habits of patients while assessing the Prakriti, it would have been difficult for us to make similar enquiries to young, healthy women who volunteered to join this study. The health status of an individual was assessed based on the Ayurvedic criteria, that include; normal desire for food, easy digestion of ingested food, excretion of feces, excretion of urine, excretion of flatus, functioning of sensory organs, comfortable sleep, easy awakening, and attainment of strength, bright complexion and longevity. Subjects with smoking habit, diabetes, hypertension and other chronic diseases were excluded from the study. Blood pressure (BP) was measured for each subject and BP > 130/90 mm of Hg were excluded from the study. Chronic systemic diseases such as rheumatoid arthritis, cancer, etc., and subjects having recent history of acute ailments such as fever due to infections were also excluded.
We followed three steps for the Prakriti assessment of each subjects. In the first stage, senior Ayurvedic physicians assessed the Prakriti of the subjects, applying classical Ayurveda parameters of Prakriti determination. In second stage, the same subjects were assessed using Ayusoft, a Prakriti software (www.ayusoft.cdac.in), which contains a comprehensive questionnaire, which had been developed based on the information from original Ayurvedic literature. In the third stage, another team of Ayurvedic physicians, who were not aware of the outcomes of assessment by senior physicians and Ayusoft, compared the Prakritis analysis. Subjects with ≥60% of single Prakriti dominance and having concordance in all the three stages were selected for the genome-wide analysis. Quantitative analysis of Prakriti was performed using Ayusoft along with traditional ayurvedic measures for the Prakriti assessment. The reason for considering ≥60% of a particular Prakritias a dominant was mainly due to feasibility and concordance. Single dosha Prakriti with high percentage of one dosha rarely exist, hence most of the individuals possess dual-dosha Prakriti12. Therefore, we have considered subjects with ≥60% as single dosha dominantPrakriti. Subjects ≥60% of one dominant Prakriti were selected and blood was drawn after obtaining their informed written consent. A total of 3,416 healthy individuals were screened for their Prakriti, as per the details given above. From the total, 971 subjects who showed a predominant Prakriti of ≥60% were included in the analysis (Figure S1).
High throughput genotyping, their quality control criteria and resequencing
Genotyping
DNA was isolated from the blood samples using standard protocol32. We randomly selected 262 Prakriti individuals for genotyping, using Genome-Wide Human SNP Array from Affymetrix (6.0), following manufacturer’s protocols. About 250 ng of genomic DNA was digested with Nsp I and Sty I restriction enzymes, followed by ligation of Nsp/Styadaptors, using T4 DNA ligase. PCR was performed using the primers that are specific to these adopters. After checking the amplicons on 2% agarose gel, they were purified with deep-well plate using magnetic beads and the fragments were eluted using EB buffer, followed by quantification and fragmentation. The fragmented PCR products (<180 bp) were end-labeled using labeling kit. Labeled fragments were hybridized onto the Affymetrix (6.0) SNP arrays using hybridization cocktail. Hybridization was performed in hybridization oven for about 18 hrs at 50 °C. After hybridization, arrays were washed, stained, scanned and analyzed using Affymetrix Genotyping Console 2.0 and GeneChip® Operating Software (GCOS). The samples which passed the quality controls i.e. call rate >95% and CQC > 0.4 were considered. Affymetrix power tool (apt-geno-qc) was used for calculation of dm (dynamic model) value. The samples having dm.all_qc<0.83 were removed from further analysis and genotypes were fetched with Birdsuite software from Broad Institute17 (Figure S1).
Detection of technical artifacts
In order to validate the Affymetrix data set, we randomly selected 48 markers (Table S3) from Affymetrix array and genotyped 48 individuals, who were already genotyped by Affymetrix array, using custom-designed VeraCode GoldenGate Genotyping Assay System (Illumina, San Diego, USA). Genotyping was performed according to the manufacturer’s (Illumina, San Diego, USA) instructions. The genotypes obtained by both the platforms were compared and checked for accuracy (Figure S1).
Targeted resequencing
We sequenced the whole-exons and UTRs of PGM1 gene (Figure S1) for randomly selected 43 Pitta and 35 Kapha individuals using Ion Torrent (Life Technologies, USA), following protocols of the manufacturer. Primer sequences were manufactured specifically for use with Ion AmpliSeq kits. The costume Ion AmpliSeqTM primer contains 35 amplicons in a single pool. For preparing amplicon libraries, about 10 ng of DNA was amplified (PCR) using AmpliSeqTM primer pools and Ion AmpliSeqTM HiFi master mix (Ion AmpliSeq kit version 2.0 Beta). The amplified products were pooled and treated with 2 μl of FuPa reagent. The amplicons were then ligated with adapters from the Ion XpressTM barcoded adapters 17–64 kit according to the manufacturer’s instructions (Ion Torrent). After ligation, the amplicons were purified by Agencourt® AMPure® XP Reagent and additional amplification was performed to complete linkage between adapters and amplicons. In order to determine the library concentration, an Agilent 2100 Bioanalyzer high-sensitivity DNA kit (Agilent, Santa Clara, CA) was used to visualize the size range of the libraries. Equimolar concentrations of all the libraries were pooled and diluted. Using Ion One TouchTM 200 Template Kit v@ DL (Life Technologies, USA), emulsion PCR was carried out according to the manufacturer’s instructions. Ion Spheres (ISPs) were recovered according to the Ion Sphere Particles 200 recovery protocol. Sequencing was done following the Ion PGMTM 200 Sequencing Kit Protocol (version 6; Ion Torrent). The 318 sequencing chip was loaded and run on an Ion Torrent PGM (Ion Torrent). Base calling and alignment were performed using the Torrent Suite 3.0 software (Ion Torrent). In order to find the significant variation in the PGM1 whole exome data, we performed association analysis using plink software26 and variations are annotated on EnsEMBL-BioMart.
Sanger sequencing
To validate and replicate the Pitta associated SNP (rs11208257), Sanger sequencing was carried out for 496 Prakriti samples (246 Vata, 116 Pitta and 134 Kapha) along with randomly selected 1108 Indian samples. Pair of primers (Forward primer: 5′- GCACGTTTCTTACAGCAGCT-3′ and Reverse primer: 5′-ACCTTACCTTGTACCCCAGC-3′) were designed, synthesized and PCR was performed on the GeneAmp 9700 Thermal Cycler (Applied Biosystems, Perkin-Elmer) using the following cycling conditions: 95 °C for 5 min, 35 cycles at 95 °C for 30 s, 58 °C for 30 s, 72 °C for 2 min and a final extension at 72 °C for 7 min. Amplicons were purified using with USB ExoSAP-IT (Affymetrix) according to the manufacturers instructions. The purified products were directly sequenced using the Big Dye Terminator cycle sequencing kit (Applied Biosystems, Foster City, CA, USA) and analyzed using 3730 DNA Analyzer (Applied Biosystems, Foster City, CA, USA)(Figure S1). The genotypes were noted, and statistical analysis was performed with plink26 and R.
Indian, HapMap and 1000 genome project sample details
For comparative analysis, we used Affymetrix (6.0) array data of 297 well-classified Indian samples with known lingustic and ethnic affiliations i.e. 150 Dravidians, 80 Indo-European, 35 Austro-Asiatic, 27 Tibeto-Burman and 5 Great Andamanese. In addition, 15 trios of Dravidian (Vysya, Madiga, Mala; 5 each) and 15 trios of Indo-European (Kshatriya, Brahmin and Kashmiri Pandit; 5 each) were used for imputation19,20. We followed the same procedure (mentioned above) for extraction of genotypes and CQC measures. The list of population and their details are given in Table S6. We have also used 1184 HapMap (ftp://ftp.ncbi.nlm.nih.gov/hapmap/genotypes/2009-01_phaseIII/plink_format/) and 1000 genome project data (ftp://ftp.1000genomes.ebi.ac.uk/vol1/ftp/release/20130502/) for imputation and comparative analysis.
Imputation and their relationship with ancestry
Imputation was performed for the missing genotypes using Beagle-v3.3.2 software18. In order to check the power of correct imputation, we randomly masked 2%, 5% and 10% genotype of chromosome 22 in 207 unrelated Indian population samples. We imputed masked genotypes with four types of reference i.e. Indian triose (15 trios of Dravidian and 15 trios of Indo-European), HapMap samples (CEU, YRI, CHB, CHS and JPT), Indian + HapMap samples and samples of 1000 genome project with South-Asian ancestry (BEB, GIH, ITU, PJL and STU). Accuracy of imputation was calculated by comparing imputed and true genotype in 110 simulations for 2%, 5% and 10% masked data. To perform the above analysis, we used a perl script.
To impute missing genotype in Prakriti samples, we followed two steps; In the first step, imputation and phasing was done for 15 trios of Dravidian (Vysya, Madiga, Mala; 5 trios each) and 15 trios of Indo-European (Kshatriya, Brahmin and Kashmiri Pandit; 5 trios each) together without reference population. SNPs which do not follow Mendelian rule in trios were checked and masked with Beagle utility program18. Number of SNPs per family, which do not follow Mendelian consistency are given in Table S5. In the second step, we performed imputation of unrelated population samples (Dravidian, Indo-European and Austro-Asiatic), with imputed familial (trios) samples as reference. Further, we imputed Prakriti samples with reference of imputed trios and unrelated Indian population samples and selected only those markers which were having R2 > 0.95 for further analysis.
Population stratification
Principal component analysis was done with Eigensoft Package21. Convertf was used for converting plink ped file to Eigenstrat format. We pruned the SNPs on the basis of their Linkage Disequilibrium (r2 > 0.75) before running PCA by using Eigensoft’s killr2 option. Ten eigenvectors were fetched. To find the ancestry of 245 Prakriti samples, we used 297 known ancestry of Indian population dataset (previously published) and performed the PCA. Stratification was checked and 40 outlier samples were excluded with cutoff sigma value ≥0.6 (default value) on 1–10 eigenvectors in 10 iterations (Figure S1).
Association analysis
Plink was used for association analysis21. Imputed Beagle file were converted into plink ped file. Association analysis was performed for the Prakritis. Since there are no case control groups in the present study, we compared one Prakriti against the other two Prakritis (Vata vs. Pitta and Kapha, Pitta vs. Vata and Kapha, and Kapha vs. Vata and Pitta) and calculated p-value from theoretical distribution. In order to exclude the markers, which could be in association by chance, we also performed adaptive permutation approach (empirical distribution) for maximum 106 iteration withplink and considered only those markers who achieved maximum 106 permutations and have p-value ≤ 1 × 10⁻⁵ in theoretical distribution (Figure S1).
Addressing issue of population stratification as possible confounder in association analysis
Even subtle stratification can cause spurious association; hence we used EIGENSTRAT software21 for correcting association chi-square value on 10 eigenvector and to find its confounding effect. Initially we excluded 385, 404 SNPs with r2 > 0.75 and calculated eigenvector with remaining 405, 782 SNPs with SMARTPCA. Further we used these same 10 eigenvector for correction of chi-square value with EIGENSTRAT (Figure S1).
To address this issue, we also used EMMAX and GCTA tools27,28. Both statistical methods consider genetic structure in association analysis. Hence, we expected major changes in p-value of 52 SNPs. First, we generated IBS matrix implemented in EMMAX and then used it with 10 eigenvector (generated with SMARTPCA) as covariate to calculate p-value with variance component model (implemented in EMMAX). To calculate mixed-model association p-value (implemented in GCTA), first, we calculated genetic relationship matrix and 10 eigenvectors with GCTA; and used it in calculation of p-value (Figure S1).
Statistical determination of Prakriti in subjects
In order to prove the power of these markers in samples of unknown Prakriti percentage, we generated a statistical model (Figure S1). First, this model applied to 205 Ayur samples and then replicated in Indian population data set with unknown Prakriti. For this, we calculated the weight for the genotype of each marker associated with the Prakriti. Suppose, if the frequency of genotype g in Prakriti p is fp then the weight of g(Wgp) can be calculated with equation (1)
 |
Un-standardized total weight of the Prakriti Wvs for a sample s with n number of associated markers for p Prakriti can be calculated using equation (2)
 |
Hence, for a single sample there will be 3 weights Wvs, Wps and Wks corresponding to Vata, Pitta and Kapha using equation (2). For making weights comparable, we standardized by subtracting with mean and dividing it by standard deviation. Mean and standard deviation were calculated from total weight of each sample for each markers corresponding to each Prakriti. If total number of sample is N then standardized weight can be calculated using equation (3)
 |
Prakriti is relative proposition (tridosha), so we calculated the differences of standardized weight for all 6 permutations; ΔVP, ΔVK, ΔPV, ΔPK, ΔKP and ΔKP for each samples and calculated representative statistics Rp. For example, representative statistics for Kapha Rk can be calculated using equation (4)
 |
Since multiplication of 2 negative values is positive, the Rp value could be positive for 2 negative Δ values. Hence, we considered only those Rp values, which have both Δ value positive. Moreover, we consider only those samples which have Rp ≥ 3 to find dominant Prakriti. We applied this model to Indian population and selected 37 samples on the basis of Rp and Δ values.
Phenotype and genotype correlation
We considered markers within 10 kb flanking region of gene as genic and other as non-genic. Physical location of the genes (knownGene.txt.gz) and SNPs (snp135.txt.gz) were fetched from http://hgdownload.soe.ucsc.edu/goldenPath/hg19/database/ and; windowbed(Bedtools: https://code.google.com/p/bedtools/) was used to find the SNPs within 10 kb flanking region of the genes. Only genic markers were used for genotype-phenotype correlation. Genic SNPs were selected and considered for further analysis. To correlate the function of associated markers with characteristics of the individual Prakriti, we checked in KEGG (Kyoto Encyclopedia of Genes and Genomes) pathway and Reactome event using NCBI2R R package.We used SIFT algorithm (http://sift.jcvi.org) for predicting the effects of non-synonomous variant (rs11208257) on protein function.
Additional Information
How to cite this article: Govindaraj, P. et al. Genome-wide analysis correlates Ayurveda Prakriti. Sci. Rep. 5, 15786; doi: 10.1038/srep15786 (2015).
Supplementary Material
Acknowledgments
This work was supported by the Office of the Principal Scientific Advisor to the Government of India; Department of Science and Technology (DST), Government of India (PRNSA/ADV/AYURVEDA/4/2007). KT was also supported by CSIR Network project - GENESIS (BSC0121), Government of India. We acknowledge the help of Dr. Ketaki Bapat for her constant support throughout the project tenure. We thank Dr. David Reich for his valuable suggestions.
Footnotes
Author Contributions M.V.S.V., K.S. and K.T. conceived the idea. K.T. design the study and provided reagents. K.T., K.S., M.V.S.V., P.K., B.P. and P.M.G. supervised the study. J.N., B.K.B., B.V.P., A.P.D., R.B., G.G.G. and S.K.N. screened and selected the Prakriti samples. H.R., R.R., P.S., M.S. and K.S.J. collected blood samples and extracted DNA. P.G. performed genotyping and DNA sequencing with help of S.N., A.S. and V.J.. S.N. analyzed data under supervision of K.T.. P.G., S.N. and K.T. wrote manuscript and all the authors reviewed the manuscript.
References
- Sharma P. V. Caraka Samhita. (Chaukhamba Orientalia, Varanasi, India,(1994). [Google Scholar]
- Dwarakanath C. The Fundamental Principles of Ayurveda. (Krishnadas Academy, Varanasi, India, 1952). [Google Scholar]
- Hankey A. Ayurvedic physiology and etiology: Ayurvedo Amritanaam. The doshas and their functioning in terms of contemporary biology and physical chemistry. J. Altern.Complement Med. 7, 567–574 (2001). [DOI] [PubMed] [Google Scholar]
- Hankey A. A test of the systems analysis underlying the scientific theory of Ayurveda's Tridosha. J. Altern.Complement Med. 11, 385–390 (2005). [DOI] [PubMed] [Google Scholar]
- Jayasundar R. Ayurveda: a distinctive approach to health and disease. Curr. Sci. 98, 908–914 (2010). [Google Scholar]
- Patwardhan B. AyuGenomics–Integration for customized medicine. Indian J. Nat. Prod. Resour. 19, 16–23 (2003). [Google Scholar]
- Bhushan P., Kalpana J. & Arvind C. Classification of human population based on HLA gene polymorphism and the concept of Prakriti in Ayurveda. J. Altern. Complement Med. 11, 349–353 (2005). [DOI] [PubMed] [Google Scholar]
- Ghodke Y., Joshi K. & Patwardhan B. Traditional Medicine to Modern Pharmacogenomics: Ayurveda Prakriti Type and CYP2C19 Gene Polymorphism Associated with the Metabolic Variability. Evid. Based Complement. Alternat. Med. 2011, 249528 (2011). [DOI] [PMC free article] [PubMed] [Google Scholar]
- Aggarwal S. et al. EGLN1 involvement in high-altitude adaptation revealed through genetic analysis of extreme constitution types defined in Ayurveda. Proc. Natl. Acad. Sci. 107, 18961–18966 (2010). [DOI] [PMC free article] [PubMed] [Google Scholar]
- Juyal R. C. et al. Potential of ayurgenomics approach in complex trait research: leads from a pilot study on rheumatoid arthritis. PloS one. 7, e45752 (2012). [DOI] [PMC free article] [PubMed] [Google Scholar]
- Rotti H. et al. Immunophenotyping of normal individuals classified on the basis of human dosha prakriti. J. Ayurveda Integr. Med. 5, 43–49 (2014). [DOI] [PMC free article] [PubMed] [Google Scholar]
- Rotti H. et al. Determinants of prakriti, the human constitution types of Indian traditional medicine and its correlation with contemporary science. J. Ayurveda Integr. Med. 5, 167–175 (2014). [DOI] [PMC free article] [PubMed] [Google Scholar]
- Rotti H. et al. DNA methylation analysis of phenotype specific stratified Indian population. J. Transl. Med. 13, 151 (2015). [DOI] [PMC free article] [PubMed] [Google Scholar]
- Mahalle N. P., Kulkarni M. V., Pendse N. M. & Naik S. S. Association of constitutional type of Ayurveda with cardiovascular risk factors, inflammatory markers and insulin resistance. J. Ayurveda Integr. Med. 3, 150–157 (2012). [DOI] [PMC free article] [PubMed] [Google Scholar]
- Prasher B. et al. Whole genome expression and biochemical correlates of extreme constitutional types defined in Ayurveda. J. Transl. Med. 6, 48 (2008). [DOI] [PMC free article] [PubMed] [Google Scholar]
- Bhalerao S., Deshpande T. & Thatte U. Prakriti (Ayurvedic concept of constitution) and variations in platelet aggregation. BMC Complement. Altern. Med. 12, 248 (2012). [DOI] [PMC free article] [PubMed] [Google Scholar]
- Korn J. M. et al. Integrated genotype calling and association analysis of SNPs, common copy number polymorphisms and rare CNVs. Nat. Genet. 40, 1253–1260 (2008). [DOI] [PMC free article] [PubMed] [Google Scholar]
- Browning B. L. & Browning S. R. A unified approach to genotype imputation and haplotype-phase inference for large data sets of trios and unrelated individuals. Am. J. Hum. Genet. 84, 210–223 (2009). [DOI] [PMC free article] [PubMed] [Google Scholar]
- Reich D., Thangaraj K., Patterson N., Price A. L. & Singh L. Reconstructing Indian population history. Nature 461, 489–494 (2009). [DOI] [PMC free article] [PubMed] [Google Scholar]
- Moorjani P. et al. Genetic evidence for recent population mixture in India. Am. J. Hum. Genet. 93, 422–438 (2013). [DOI] [PMC free article] [PubMed] [Google Scholar]
- Patterson N., Price A. L. & Reich D. Population structure and eigenanalysis. PLoS Genet. 2, e190 (2006). [DOI] [PMC free article] [PubMed] [Google Scholar]
- Freedman M. L. et al. Assessing the impact of population stratification on genetic association studies. Nat. Genet. 36, 388–393 (2004). [DOI] [PubMed] [Google Scholar]
- Marchini J., Cardon L. R., Phillips M. S. & Donnelly P. The effects of human population structure on large genetic association studies. Nat. Genet. 36, 512–517 (2004). [DOI] [PubMed] [Google Scholar]
- Helgason A., Yngvadottir B., Hrafnkelsson B., Gulcher J. & Stefansson K. An Icelandic example of the impact of population structure on association studies. Nat. Genet. 37, 90–95 (2005). [DOI] [PubMed] [Google Scholar]
- Campbell C. D. et al. Demonstrating stratification in a European American population. Nat. Genet. 37, 868–872 (2005). [DOI] [PubMed] [Google Scholar]
- Purcell S. et al. PLINK: a tool set for whole-genome association and population-based linkage analyses. Am. J. Hum. Genet. 81, 559–575 (2007). [DOI] [PMC free article] [PubMed] [Google Scholar]
- Kang H. M. et al. Variance component model to account for sample structure in genome-wide association studies. Nat. Genet. 42, 348–354 (2010). [DOI] [PMC free article] [PubMed] [Google Scholar]
- Yang J., Lee S. H., Goddard M. E. & Visscher P. M. GCTA: a tool for genome-wide complex trait analysis. Am. J. Hum. Genet. 88, 76–82 (2011). [DOI] [PMC free article] [PubMed] [Google Scholar]
- Huang R. S. et al. Identification of genetic variants contributing to cisplatin-induced cytotoxicity by use of a genomewide approach. Am. J. Hum. Genet. 81, 427–437 (2007). [DOI] [PMC free article] [PubMed] [Google Scholar]
- Jorgenson E. & Witte J. S. A gene-centric approach to genome-wide association studies. Nat. Rev. Genet. 7, 885–891 (2006). [DOI] [PubMed] [Google Scholar]
- Kumar P. & Malhotra N. Jeffcoate's Principles of Gynecology 7th edn. (Jaypee Brothers Medical Publications, New Delhi, India, 2008). [Google Scholar]
- Thangaraj K. et al. CAG repeat expansion in the androgen receptor gene is not associated with male infertility in Indian populations. J. Androl. 23, 815–818 (2002). [PubMed] [Google Scholar]
Associated Data
This section collects any data citations, data availability statements, or supplementary materials included in this article.