

Abstract
IMPORTANCE
Brain imaging and fluid biomarkers are characterized in children at risk for autosomal dominant Alzheimer disease (ADAD).
OBJECTIVE
To characterize and compare structural magnetic resonance imaging (MRI), resting-state and task-dependent functional MRI, and plasma amyloid-β (Aβ) measurements in presenilin 1 (PSEN1) E280A mutation–carrying and noncarrying children with ADAD.
DESIGN, SETTING, AND PARTICIPANTS
Cross-sectional measures of structural and functional MRI and plasma Aβ assays were assessed in 18 PSEN1 E280A carriers and 19 noncarriers aged 9 to 17 years from a Colombian kindred with ADAD. Recruitment and data collection for this study were conducted at the University of Antioquia and the Hospital Pablo Tobon Uribe in Medellin, Colombia, between August 2011 and June 2012.
MAIN OUTCOMES AND MEASURES
All participants had blood sampling, structural MRI, and functional MRI during associative memory encoding and resting-state and cognitive assessments. Outcome measures included plasma Aβ1-42 concentrations and Aβ1-42:Aβ1-40 ratios, memory encoding–dependent activation changes, resting-state connectivity, and regional gray matter volumes. Structural and functional MRI data were compared using automated brain mapping algorithms and search regions related to AD.
RESULTS
Similar to findings in adult mutation carriers, in the later preclinical and clinical stages of ADAD, mutation-carrying children were distinguished from control individuals by significantly higher plasma Aβ1-42 levels (mean [SD]: carriers, 18.8 [5.1] pg/mL and noncarriers, 13.1 [3.2] pg/mL; P < .001) and Aβ1-42:Aβ1-40 ratios (mean [SD]: carriers, 0.32 [0.06] and noncarriers, 0.21 [0.03]; P < .001), as well as less memory encoding task–related deactivation in parietal regions (eg, mean [SD] parameter estimates for the right precuneus were −0.590 [0.50] for noncarriers and −0.087 [0.38] for carriers; P < .005 uncorrected).
Unlike carriers in the later stages, mutation-carrying children demonstrated increased functional connectivity of the posterior cingulate cortex with medial temporal lobe regions (mean [SD] parameter estimates were 0.038 [0.070] for noncarriers and 0.190 [0.057] for carriers), as well as greater gray matter volumes in temporal regions (eg, left parahippocampus; P < . 049, corrected for multiple comparisons).
CONCLUSIONS AND RELEVANCE
Children at genetic risk for ADAD have functional and structural brain changes and abnormal levels of plasma Aβ1-42. The extent to which the underlying brain changes are either neurodegenerative or developmental remains to be determined. This study provides additional information about the earliest known biomarker changes associated with ADAD.
Keywords: Alzheimer's disease, presenilin-1, preclinical, biomarkers, MRI
Introduction
Alzheimer disease (AD) is now conceptualized as a sequence of physiological changes that begins during preclinical stages of the disease and becomes more severe in clinical stages of the disorder.1-4 Proposed research diagnostic criteria for preclinicalADuse imaging and molecular biomarkers to identify asymptomatic individuals with cerebral amyloidosis and evidence of early neurodegeneration for potential intervention trials.5,6 We and others have suggested that there may be even earlier brain alterations in persons at risk for AD, some of which may be developmental and provide a foothold for fibrillar amyloid-β (Aβ) deposition and other progressive physiological changes associatedwithAD.4,7
Autosomal dominant AD (ADAD) mutation carriers will develop early-onset AD in the future with near 100% certainty, and because noncarriers from the same kindred are virtually certain to be free from AD at younger ages, ADAD kindreds provide a unique opportunity to characterize the earliest biological changes associated with predisposition to develop AD.
Presenilin 1 (PSEN1) mutations predispose individuals to develop early-onset AD in adulthood.8 As part of the Alzheimer Prevention Initiative's efforts, we have begun to use brain imaging and other biomarkers to detect and track changes in preclinical PSEN1 E280A (Glu280Ala) mutation carriers from the largest known ADAD kindred. Residing in Antioquia, Colombia, this kindred is estimated to consist of approximately 5000 living relatives including about 1500 mutation carriers.9
Carriers from this kindred have an estimated median age of 44 years (95% CI, 43-45) at onset of mild cognitive impairment (MCI) and 49 years (95% CI, 49-50) at onset of dementia.10 While late-onset AD (LOAD) and ADAD have many clinical, neuropathological, and biomarker features in common,11,12 they also have several differences. For instance, LOAD has been suggested to be associated with reduced clearance of Aβ1-42, while ADAD has been suggested to be associated with overproduction of this peptide. Consistent with this possibility, studies of persons affected by or at risk for LOAD have commonly reported reduced plasmaAβ1-42 levels.13-15 In contrast, our previous study of young PSEN1 E280A mutation carriers and the Dominantly Inherited Alzheimer Network Study of a different ADAD cohort revealed elevated plasma Aβ1-42 levels in carriers that were not associated with age and age-associated reductions in cerebrospinal fluid (CSF) Aβ1-42 levels.11, 12
Our previous work also showed that young adult PSEN1 E280A mutation carriers have alterations in magnetic resonance imaging (MRI) measurements of brain structure (eg, reduced gray matter in AD-related brain regions).4,16 Furthermore, task-dependent changes in brain activity (eg, greater medial temporal lobe [MTL] activation and less precuneus deactivation) have been reported by our group, along with CSF and plasma biomarker evidence of Aβ overproduction. These findings were observed more than 2 decades prior to the kindred's respective median ages at MCI and even prior to positron emission tomographic evidence of fibrillar Aβ burden (mean age, 28 years).4
In the present study, to characterize some of the earliest brain changes in preclinical ADAD, we sought to extend our findings of elevated plasma Aβ and structural and functional MRI abnormalities to children with the PSEN1 E280A mutation.
Methods
Study Design and Participants
Between August 2011 and June 2012, cross-sectional structural MRI, resting-state and task-dependent functional MRI, and plasma Aβ measurements were assessed in children and adolescents with and without the PSEN1 E280A mutation from the world's largest known ADAD kindred. Thirty-seven volunteers were recruited from the Colombian Alzheimer Prevention Initiative registry, which currently includes more than 3900 living members of the PSEN1 E280A kindred. The mutation carriers and noncarriers who were 9 to 17 years of age, had no history of learning or intellectual disabilities, and descended from a common ancestor were invited to participate in the study. Nineteen participants were PSEN1 mutation carriers (mean [SD] age, 13.7 [2.6] years) and 18 were PSEN1 mutation noncarriers from the same kindred, who were matched to the carriers by age, sex, and education and who served as control individuals (mean [SD] age, 13.6 [2.6] years). Potential participants were screened in advance for the presence of neurological and psychiatric disorders, drug use, and MRI scanner compatibility. Imaging with positron emission tomography and lumbar punctures were not performed because of the participants’ young age.
Clinical history and neurological examination were performed by a neurologist or a physician trained in assessment of neurodegenerative disorders. Cognitive testing was conducted by neuropsychologists and psychologists trained in neuropsychology. Clinical data were recorded on the Systematized Information System for the Neuroscience Group of Antioquia. All participants’ parents provided written informed consent. The ethics committee of the University of Antioquia (Colombia) approved this study.
Procedures
All participants had clinical and neuropsychological evaluations, family history, neurological examination, PSEN1 and apolipoprotein E (APOE) genotyping, functional MRI during resting-state and face-name associative encoding task, and structural MRI assessment.
Clinical and neuropsychological assessments were undertaken at the University of Antioquia, Medellin, Colombia. Testing was done using a Spanish version of the Wechsler Intelligence for Children Scale, 3rd edition.
Plasma samples were also taken at the University of Antioquia. Venipunctures for blood collection were performed in the morning after an overnight fast. Plasma samples were processed, stored in polypropylene tubes, frozen at –80°C, and shipped on dry ice to Washington University (St Louis, Missouri) for biomarker analysis. Plasma Aβ1-40 and Aβ1-42 concentrations were quantified by INNO-BIA Plasma Aβ Forms Multiplex Assay (Innogenetics) by the Knight Alzheimer Disease Research Center Biomarker Core at Washington University. For genetic analyses, genomic DNA was extracted from blood by standard protocols, and PSEN1 E280A and APOE characterization was done as previously described.4,17
Every participant had structural and functional MRI done at the Hospital Pablo Tobon Uribe, Medellin, Colombia. Functional and structural MRI pulse sequenceswere acquired on a 1.5-T Siemens Avanto scanner. Functional MRI data were acquired using a T2*-weighted gradient echoplanar blood oxygen level–dependent pulse sequence (repetition time, 2 seconds; echo time, 40 milliseconds; flip angle, 90°; field of view, 200 × 200) during a face-name associative memory encoding task involving 3 conditions: novel face-name pairs, a control task involving repeated face-name pairs, and visual fixation, as previously described.2 Following the scanning session, recognition memory was assessed in response to previously viewed and new pairs using a discrimination index (percentage of hits – percentage of false alarms) and the median reaction time to correctly recognized pairs. Functional MRI (fMRI) data were also acquired during resting state (1 run of 8 minutes with eyes open). Structural data were acquired using two 3-dimensional T1-weighted MRI images (T1 free-flow eletrophoresis; repetition time, 2530 milliseconds, echo time, 3.39 milliseconds; flip angle, 7°; field of view, 256 × 256; 1.0 × 1.0 × 1.0 mm; 176 slices). Plasma samples were analyzed independently from the analysis of brain images. Researchers were blinded to the genetic status of the participants during data collection and all data analyses and preprocessing prior to the statistical analysis.
Statistical Analysis
Both task-related activation and resting-state fMRI data were preprocessed with SPM8 software (Wellcome Department of Cognitive Neurology, London, England). Each run was slice time corrected, realigned to the first volume within a run using INRIAlign toolbox18 to correct for variance due to susceptibility-by-movement interactions, spatially normalized into standard Montreal Neurological Institute space, and spatially smoothed using a 6-mm full-width at half maximum gaussian filter.
For resting-state functional connectivity analysis of the default-mode network (DMN), we used seed regions taken from a prior report17 and included seed regions in the (1) right lateral temporal cortex, (2) left lateral temporal cortex, (3) medial prefrontal cortex, (4) posterior cingulate cortex, (5) left inferior parietal lobule, and (6) right inferior parietal lobule. Connectivity measurements were made by computing the pairwise correlations between these seeds and then compared between mutation carrier and noncarrier groups. To further explore whole-brain changes in DMN-associated functional connectivity with respect to genetic status, we computed whole-brain seed maps using the posterior cingulate cortex seed for each individual.
For the analysis of task-dependent changes in regional fMRI measurements (ie, regional changes in brain activity during a face-name memory encoding paradigm), a block design was used, such that each epoch of trials is modeled using a boxcar function convolved with a hemodynamic response function. Individual participant contrasts generated from the first level models were then carried forward to group-level analyses. The main contrast of interest was novel face-name pairs vs repeated face-name pairs.
We used SPM8 with voxel-based morphometry, the DARTELprotocol,19, 20 Jacobian modulation, and an 8-mm full-width at half maximum gaussian filter to generate segmented gray matter maps for all participants in the Montreal Neurological Institute brain atlas coordinate space and compare regional gray matter volumes in PSEN1 carriers and noncarriers.
Results
Table 1 shows the demographic characteristics, clinical ratings, and Wechsler Intelligence for Children Scale, 3rd edition test scores for participants. PSEN1 mutation carriers and noncarriers did not differ significantly in their age, sex, education, neuropsychological performance, or proportion of APOE ε4 carriers.
Table 1.
Research Participant Characteristics
| Non-Carriers | PSEN1 Mutation Carriers | P-value+ | |
|---|---|---|---|
| Number of subjects | 19 | 18 | |
| Age (range), years | 13±3 (9-17) | 13±2 (9-17) | 0.97 |
| Sex (M/F) | 9/10 | 6/12 | 0.38 |
| Education (years) | 7±3 | 7±3 | 0.78 |
| APOE genotype | |||
| 2/3 | 3 | 5 | |
| 3/3 | 13 | 11 | |
| 3/4 | 3 | 2 | |
| Wechsler Intelligence Scale for Children, 3rd Edition (WISC-III) | |||
| VIQ | 86±11 | 85±11 | 0.75 |
| PIQ | 91±10 | 86±11 | 0.19 |
| WMIQ | 88±14 | 88±13 | 0.86 |
| PSIQ | 84±13 | 92±14 | 0.09 |
| TOTAL IQ | 84±11 | 86±12 | 0.68 |
Data are number, mean ± (SD). PSEN1: Presenilin 1.VIQ: Verbal Intelligence Quotient.PIQ: Perceptual Intelligence Quotient. WMIQ: Working Memory Intelligence Quotient. PSIQ: Processing Speed Intelligence Quotient.
Calculated using Mann-Whitney tests to compare groups for age, educational level, and WISC-III scores, and Chi-square tests to compare the groups for gender.
Figure 1 shows plasma measurements from mutation carriers and noncarriers. As predicted, mutation carriers had significantly higher plasma Aβ1-42 levels (mean [SD], 18.8 [5.1] pg/mL) than noncarriers (mean [SD], 13.1 [3.2] pg/mL) (P < .001), as well as significantly higher plasma Aβ1-42:Aβ1-40 ratios (mean [SD]: carriers, 0.32 [0.06] and noncarriers, 0.21 [0.03]; P < .001). The groups did not differ significantly in their plasma Aβ1-40 levels (P = .31).
Figure 1. Plasma Amyloid-β Concentrations in Presenilin 1 (PSEN1) E280A Mutation Carriers and Noncarriers.
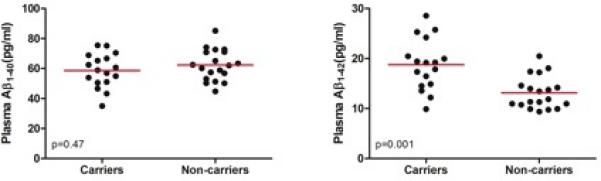
Shown are between-group cross-sectional comparisons between PSEN1 mutation carriers and noncarriers. P values were calculated using Mann-Whitney U tests. The red lines indicate means.
Mutation carriers and noncarriers did not differ in their postscan face-name pair recognition performance. The mean (SD) discrimination index was 0.68 (0.09) for noncarriers and 0.65 (0.13) for PSEN1 mutation carriers (P = .56); their respective median (SD) reaction times to respond correctly to previously seen face-name pairs were 1447 (441) milliseconds and 1379 (253) milliseconds (P = .57). Encoding of novel facename pairs was associated in both groups with activation in the bilateral fusiform gyrus, MTL, and prefrontal regions, as well as deactivations in posterior parietal regions. Compared with noncarriers, mutation carriers appeared to have less deactivation in posterior parietal regions (P = .005 uncorrected, P value was not significant after correcting for multiple regional comparisons; Table 2; Figure 2A). For the novel greater than repeated contrast, the mean(SD) parameter estimates for the right precuneus were −0.590 (0.50) for noncarriers and −0.087 (0.38) for carriers (Figure 2B). There were no significant differences between groups in MTL activation, either when controlling for age or when looking at age-related slopes.
Table 2.
Location and magnitude of the most significant functional and structural brain measures in PSEN1 E280A mutation carriers compared with non-carriers
| Brain Region | Hemisphere | Atlas Coordinatesa Millimeters | P-valueb | ||
|---|---|---|---|---|---|
| X | Y | Z | |||
| Locations with less deactivation during associative memory encoding | |||||
| Precuneus | Right | 6 | −49 | 71 | 3.6E-05 |
| Precuneus | Right | 3 | −73 | 50 | 6.9E-04 |
| ParietalSup | Left | −21 | −79 | 50 | 5.7E-05 |
| ParietalSup | Left | −9 | −79 | 50 | 1.3E-03 |
| Cuneus | Left | −12 | −82 | 29 | 1.0E-05 |
| Cuneus | Right | 12 | −76 | 41 | 1.6E-04 |
| Cuneus | Right | 18 | −82 | 44 | 4.0E-04 |
| Locations with greater gray matter volume | |||||
| Precuneus | Left | −4 | −51 | 62 | 1.4E-04 |
| Posterior Cingulate | Right | 2 | −42 | 13 | 8.5E-05 |
| Hippocampus | Left | −32 | −27 | −5 | 5.5E-04 |
| Parahippocampal* | Left | −22 | 3 | −27 | 1.1E-03 |
| Temporal Pole* | Right | 40 | 11 | −21 | 5.1E-05 |
Atlas coordinates were obtained from Talairach and Tournoux (41). X is the distance to the right (+) or left (-) of the midline, Y is the distance anterior (+) or posterior (-) to the anterior commissure, and Z is the distance superior (+) or inferior (-) to a horizontal plane through the anterior and posterior commissures.
Listed locations correspond to the magnitude of the t-score for that given location P≤0.005, uncorrected for multiple comparisons.
Remained significant after correcting for multiple comparisons in the postulated search regions (parahippocampal: 0.049; temporal pole; 0.014).
Figure 2. Functional Brain Measures in Presenilin 1 (PSEN1) E280A Mutation Carriers Compared With Noncarriers.
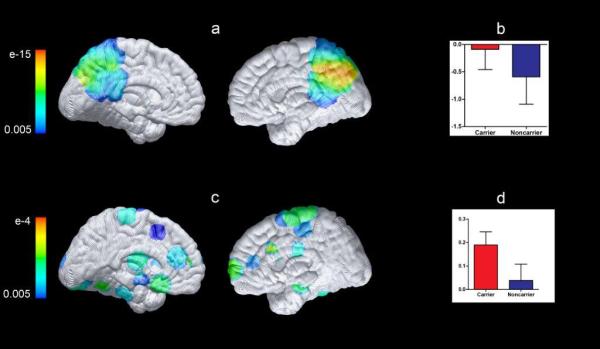
Statistical maps were projected onto the medial surfaces of a spatially standardized brain. The color scale represents the between-group difference significance in the postulated search regions. A, Results show main effect of mutation during the contrast novel face-name pairs vs repeated face-name pairs. Compared with non-carriers, carriers had significantly less deactivation bilaterally in the precuneus and parietal regions (P = .005, uncorrected for multiple regional comparisons). B, Parameter estimates extracted as a sphere with a radius of 5 mm and centered at the coordinate 6, −49, 71 from the right precuneus for the contrast novel pairs vs repeated pairs for PSEN1 mutation carriers and noncarriers. For the novel greater than repeated contrast, the mean (SD) parameter estimates in this region were −0.590 (0.502) for noncarriers and −0.087 (0.372) for PSEN1 carriers. C, Map displays group differences in functional default-mode network connectivity for carriers vs noncarriers. PSEN1 mutation carriers showed increased functional connectivity between the posterior cingulate cortex and bilateral medial temporal lobe regions (P = .005, uncorrected for multiple regional comparisons). D, Mean functional connectivity of the posterior cingulate cortex region with an anatomical mask of bilateral medial temporal lobe regions. The mean (SD) parameter estimates were 0.038 (0.070) for noncarriers and 0.190 (0.057) for carriers.
As expected, highly significant resting-state functional connectivity was observed within the DMN in both the mutation carriers and noncarriers. There were no differences between groups in functional connectivity in the whole network metric (6 predefined nodes). However, PSEN1 mutation carriers showed paradoxically greater functional connectivity between the posterior cingulate cortex and bilateral MTL regions (P = .005 uncorrected, P value was not significant after correcting for multiple regional comparisons) (Figure 2C). The mean (SD) parameter estimates were 0.038 (0.070) for noncarriers and 0.190 (0.057) for carriers (Figure 2D). PSEN1 mutation carriers did not show reduced functional connectivity when compared with noncarriers, as previously reported in the later preclinical and clinical stages of AD.21-23
Table 2 and Figure 3 show significant differences between mutation carriers and noncarriers in MRI measurements of regional gray matter volume. Mutation carriers had paradoxically greater gray matter volumes in the hippocampus, parahippocampus, and parietal and temporal lobe regions (P = .005, uncorrected for multiple regional comparisons). Greater volumes in the parahippocampal gyrus and temporal pole remained significant after correcting for multiple comparisons in the postulated search regions (P = .049 and P = .01, respectively).
Figure 3. Structural Brain Measures in PSEN1 E280A Mutation Carriers Compared With Noncarriers.
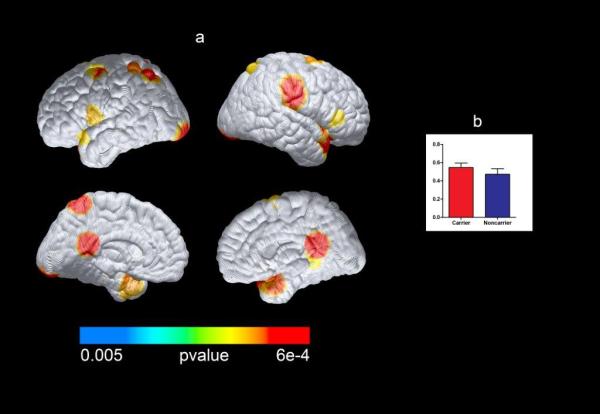
Compared with noncarriers, PSEN1 mutation carriers had significantly greater gray matter volume in the bilateral parietal and temporal regions and the posterior cingulate cortex (P < .005, uncorrected for multiple regional comparisons). Differences in the parahippocampal gyrus and temporal pole remained significant after correcting for multiple comparisons. A, Statistical maps were projected onto the lateral and medial surfaces of a spatially standardized brain. B, The peak gray matter difference between carriers and noncarriers in the temporal pole at 40, 11, −21 (Talairach) is also displayed. The mean (SD) parameter estimates were 0.57 (0.07) for noncarriers and 0.66 (0.06) for carriers.
PSEN1 mutation carriers did not show any reductions in brain regions when compared with noncarriers, as previously reported in the later preclinical and clinical stages of AD.
Discussion
This study describes some of the earliest brain changes associated with the predisposition to ADAD. As observed in the later preclinical and clinical stages of ADAD and in our previous study of young adults from the same kindred, 9- to 17-yearold PSEN1 E280A mutation carriers were distinguished from noncarriers by plasma biomarker evidence of Aβ1-42 overproduction and by reduced posterior parietal deactivation during a memory encoding task. In contrast to findings in the later preclinical and clinical stages of AD, the carriers were also distinguished from noncarriers by greater brain volumes and resting-state functional connectivity in some of the brain regions that are preferentially affected by AD.
As we previously reported in young adult PSEN1 E280A mutation carriers, 9- to 17-year-old mutation carriers were distinguished from noncarriers by significantly higher plasma Aβ1-42 levels and Aβ1-42:Aβ1-40 ratios and by less fMRI deactivation of posterior parietal regions during a memory encoding task. Findings were noted at a younger age than the earliest evidence of fibrillarAβ deposition (ie, florbetapir standard uptake value ratio increases beginning at the mean age of 28 years and CSF Aβ1-42 declines beginning at the mean age of 24 years) in this kindred.1,24 With regard to brain changes, our results should be interpreted with caution given that not all of the tests survived correction for multiple comparisons. Notwithstanding this limitation, less fMRI deactivation of parietal regions, seen in the absence of MTL alterations, supportthe hypothesis that functional abnormalities in key regions of the DMN (eg, parietal regions) may precede MTL changes in early disease.
Findings of greater gray matter volume in temporal and parietal regions are partly consistent with abnormalities that have been reported in APOE4 infant carriers. APOE4 infant carriers showed thicker cortex in frontal regions7 and greater gray matter volumes in posterior parietal, frontal, and occipital cortices.25 These common findings between PSEN1 and APOE4 carriers are consistent with the notion of a common mechanism.
Unlike the infant studies, we did not find any significant reductions in brain volume in regions preferentially affected by AD, although we cannot exclude the possibility that the negative finding is attributable to limited statistical power in our smaller sample. Our findings are also partly consistent with an independent study done with older PSEN1 mutation carriers.26 They studied 11 32- to 55-year-old carriers and reported that they had greater cortical thickness in the caudate, precuneus, and parietotemporal regions when compared with noncarriers. The pathophysiological mechanisms underlying these morphometric differences within AD related regions remain to be defined. However, our data and those of others suggest that presenilin 1 function is altered in mutation carriers at a very early age, resulting in gray matter developmental changes. Presenilin 1 function is known to be essential for both neural and vascular development in animal models.27-29
Additional studies are needed to clarify the role of PSEN1 in neuronal and synaptic development and whether and how it may be related to differential pruning, compensation, or other developmental changes. Whether these neurodevelopmental processes may be relevant for the progressive pathological changes that begin to occur in young adult mutation carriers with ADAD and whether these processes are affected by any of the other genetic risk factors for AD (eg, APOE) remain to be established.
The strengths of the present study were the use of brain imaging and blood biomarkers in members from a large homogeneous ADAD kindred, with a single-gene mutation,with characterized ages at the onset of MCI(mean [SD], 44 [5] years) and dementia (mean [SD], 49 [5] years) and characterized associations between brain imaging and CSF biomarker measurements in adulthood.1,4,10,24 Studies of PSEN1 mutation carriers allow us to examine cognitively normal individuals who will go on to develop AD in the future with virtual certainty. Our findings add to the growing evidence that suggests brain MRIs, in combination with molecular markers, have the potential to identify presymptomatic changes in individuals at a higher risk for developing sporadic AD.
Studies have not yet resolved whether there are changes in cognitive functioning associated with genetic risk for AD. In our study, we only used a measure of intellectual functioning and did not find differences between mutation-carrying children and age-matched control individuals. Our findings underscore the need for larger cross-sectional and longitudinal studies to characterize and compare performance across cognitive domains, with a special focus on learning skills and executive functioning.
This study also had several limitations including relatively small sample sizes, reduced statistical power for imaging findings, and uncertainty in the extent to which our findings may be generalizable to other AD-causing mutations as well as LOAD. While the present results are based on a relatively small sample size compared with studies of MCI or sporadic AD, the present sample represents one of the largest of its kind. While our findings are limited to PSEN1 E280A carriers, we have sought to harmonize our biomarker measurements and perform biological fluid assays in the same laboratory used in the study of many other ADAD mutation carriers and noncarriers from the Dominantly Inherited Alzheimer Network,11,30 thus providing complementary data and converging evidence in the preclinical study of ADAD. Most of our imaging findings did not survive correction for multiple comparisons and need to be considered as exploratory; however, the pattern of the gray matter and fMRI changes, their bilateral nature, the convergence of findings using different MRI measurements, and other studies suggesting few type I errors at P < .05 reduce the chance of type I errors. Finally, we could not rule out the possibility that some of the biomarker changes occurred in the presence of fibrillar plaques or potentially neurotoxic soluble Aβ effects that were not detected in the previous CSF and positron emission tomographic studies.
Conclusions
PSEN1 E280A mutation–carrying children have functional and structural MRI changes, along with plasma biomarker findings consistent with Aβ1-42 overproduction. This study demonstrates some of the earliest known brain changes in ADAD, it suggests that these changes may begin before biomarker evidence of Aβ plaque deposition, and it underscores the need for studies to clarify the earliest brain changes associated with the predisposition to AD. Further research is needed to determine the meaning and relevance of these changes for early detection of the disease and to evaluate them as reliable preclinical markers of AD. Longitudinal studies of this kindred may provide answers about progression and prevention of the disease. Further research is also needed to define how the presenilin variants might modify brain development and how these neurodevelopmental changes may or may not be related to present or future pathophysiological changes associated with the predisposition to AD.
ACKNOWLEDGMENTS
The authors thank the Hospital Pablo Tobon Uribe staff for their help with data acquisition. We thank the PSEN1 Colombian families for contributing their valuable time and effort, without which this study would not have been possible.
Funding/Support:
This study was supported by a grant from an Anonymous Foundation (EMR, FL) and by the Banner Alzheimer's Foundation, the Nomis Foundation, the National Institute of Health- Office of the Director (DP5OD019833 [YTQ]), the National Institute on Aging (R01 AG031581 [EMR], P30 AG19610 [EMR], RF1AG041705 [EMR, PNT, FL], and 2UF1 AG032438 [AMF]), the NEY021624 [JFA-V], and Colciencias-Colombia (1115-408-20512 fl, 1115-545-31651 fl).
Role of the Funder/Sponsor:
This study was designed and conducted by investigators from the Massachusetts General Hospital, Banner Alzheimer's Institute and Universidad de Antioquia. The funding sources had no role in the design and conduct of the study; collection, management, analysis, and interpretation of the data; preparation, review, or approval of the manuscript; and decision to submit the manuscript for publication.
Footnotes
Author Contributions:
Dr. Quiroz had full access to all the data in the study and takes responsibility for the integrity of the data and the accuracy of the data analysis.
Study concept and design: YTQ, BCD, RAS, PNT, FL, EMR
Study supervision: YTQ, EMR, FL
Acquisition of data: YTQ, AMF, CM, DR, VT, MG, NA-B, GG, FL
Analysis and interpretation of data: YTQ, AS, KC, ASF, JBL, AMF, AR, JFAV, PT, MB, HP, BCD, RAS, FL, EMR
Statistical analysis: YTQ, KC, AS, HP, AR, PT
Drafting the manuscript: YTQ, KC, EMR
Preparation of figures and tables: YTQ, KC, HP, AS, AR, PT, MM
Obtained funding: FL, PNT, EMR
Critical revision of the manuscript for important intellectual content: YTQ, AS, KC, HP, MB, ASF, JBL, PT, AMF, AR, MM, JFAV, CM, GG, NAB, MG, DR, PNT, BCD, RAS, FL, EMR
Conflicts of Interest and Funding Sources
YTQ: Consultant for MedAvante
AS: none
KC: none
HP: none
MB: none
ASF: Consultant for: Eli Lilly, AVID, Merck, Grifols, Quintiles, Biogen. Invited Speaker: Quintiles, Avid, and Lilly CME grant programs. DSMB membership: NIA, Merck, Pfizer. Grant Funding: NIA, Eli Lilly. Sponsored Studies: Merck, Roche, Genentech, Pfizer, Avanir, Takeda, Lilly, BMS, Baxter, Neuroptix, Wyeth. Full time employee of Eli Lilly as of April 2014
JBL: none
PT: none
AMF: Member of the Scientific Advisory Boards of IBL International and Roche and Consultant for AbbVie.
ARS: none
MM: none
JFAV: none
CM: none
GG: none
NAB: none
MG: none
VT: none
DR: none
PNT: Consulting fees: Abbott Laboratories, AC Immune, Adamas, Allergan, Avanir, Boehringer-Ingelheim, Chase Pharmaceuticals, Chiesi, Eisai, Inc., Elan, Medavante, Merz, Neuroptix, Novartis, Otsuka, Sanofi-Aventis, Schering-Plough, and Worldwide Clinical Trials.
Consulting fees and research support from AstraZeneca, Avid, Bristol Myers Squibb, Genentech, GlaxoSmithKline, Janssen, Eli Lilly, Medivation, Merck and Company, Pfizer Inc., Roche, Toyama, and Wyeth Laboratories. Research support only: Baxter Healthcare Corp., Functional Neuromodulation (f(nm)), GE, Targacept.Other research support: NIA, NIMH, Alzheimer's Association, Arizona Department of Health Services. Investments: Stock options in Medavante, Adamas. Patents: “Biomarkers of Alzheimer's”.
BCD: none
RAS: Consulting fees: Genentech, Roche, Isis, Janssen. Research support from Eli Lilly, Avid, Janssen, and Eisai
FL: none
EMR: research funding from AVID and a paid consultation role for Eli Lilly
References
- 1.Fleisher AS, Chen K, Quiroz YT, et al. Florbetapir PET analysis of amyloid-beta deposition in the presenilin 1 E280A autosomal dominant Alzheimer's disease kindred: a cross-sectional study. Lancet neurology. 2012;11:1057–1065. doi: 10.1016/S1474-4422(12)70227-2. [DOI] [PMC free article] [PubMed] [Google Scholar]
- 2.Quiroz YT, Budson AE, Celone K, et al. Hippocampal hyperactivation in presymptomatic familial Alzheimer's disease. Annals of neurology. 2010;68:865–875. doi: 10.1002/ana.22105. [DOI] [PMC free article] [PubMed] [Google Scholar]
- 3.Quiroz YT, Ally BA, Celone K, et al. Event-related potential markers of brain changes in preclinical familial Alzheimer disease. Neurology. 2011;77:469–475. doi: 10.1212/WNL.0b013e318227b1b0. [DOI] [PMC free article] [PubMed] [Google Scholar]
- 4.Reiman EM, Quiroz YT, Fleisher AS, et al. Brain imaging and fluid biomarker analysis in young adults at genetic risk for autosomal dominant Alzheimer's disease in the presenilin 1 E280A kindred: a case-control study. Lancet neurology. 2012;11:1048–1056. doi: 10.1016/S1474-4422(12)70228-4. [DOI] [PMC free article] [PubMed] [Google Scholar]
- 5.Dubois B, Feldman HH, Jacova C, et al. Revising the definition of Alzheimer's disease: a new lexicon. Lancet neurology. 2010;9:1118–1127. doi: 10.1016/S1474-4422(10)70223-4. [DOI] [PubMed] [Google Scholar]
- 6.Sperling RA, Aisen PS, Beckett LA, et al. Toward defining the preclinical stages of Alzheimer's disease: recommendations from the National Institute on Aging-Alzheimer's Association workgroups on diagnostic guidelines for Alzheimer's disease. Alzheimer's & dementia : the journal of the Alzheimer's Association. 2011;7:280–292. doi: 10.1016/j.jalz.2011.03.003. [DOI] [PMC free article] [PubMed] [Google Scholar]
- 7.Dean DC, 3rd, Jerskey BA, Chen K, et al. Brain differences in infants at differential genetic risk for late-onset Alzheimer disease: a cross-sectional imaging study. JAMA neurology. 2014;71:11–22. doi: 10.1001/jamaneurol.2013.4544. [DOI] [PMC free article] [PubMed] [Google Scholar]
- 8.Karran E, Mercken M, De Strooper B. The amyloid cascade hypothesis for Alzheimer's disease: an appraisal for the development of therapeutics. Nat Rev Drug Discov. 2011;10:698–712. doi: 10.1038/nrd3505. [DOI] [PubMed] [Google Scholar]
- 9.Lopera F, Ardilla A, Martinez A, et al. Clinical features of early-onset Alzheimer disease in a large kindred with an E280A presenilin-1 mutation. JAMA : the journal of the American Medical Association. 1997;277:793–799. [PubMed] [Google Scholar]
- 10.Acosta-Baena N, Sepulveda-Falla D, Lopera-Gomez CM, et al. Pre-dementia clinical stages in presenilin 1 E280A familial early-onset Alzheimer's disease: a retrospective cohort study. Lancet neurology. 2011;10:213–220. doi: 10.1016/S1474-4422(10)70323-9. [DOI] [PubMed] [Google Scholar]
- 11.Bateman RJ, Xiong C, Benzinger TL, et al. Clinical and biomarker changes in dominantly inherited Alzheimer's disease. The New England journal of medicine. 2012;367:795–804. doi: 10.1056/NEJMoa1202753. [DOI] [PMC free article] [PubMed] [Google Scholar]
- 12.Fleisher AS, Chen K, Quiroz YT, et al. Associations Between Biomarkers and Age in the Presenilin 1 E280A Autosomal Dominant Alzheimer Disease Kindred: A Cross-sectional Study. JAMA neurology. 2015;72:316–324. doi: 10.1001/jamaneurol.2014.3314. [DOI] [PMC free article] [PubMed] [Google Scholar]
- 13.Chouraki V, Beiser A, Younkin L, et al. Plasma amyloid-beta and risk of Alzheimer's disease in the Framingham Heart Study. Alzheimer's & dementia : the journal of the Alzheimer's Association. 2015;11:249–257. e241. doi: 10.1016/j.jalz.2014.07.001. [DOI] [PMC free article] [PubMed] [Google Scholar]
- 14.Rembach A, Watt AD, Wilson WJ, et al. Plasma amyloid-beta levels are significantly associated with a transition toward Alzheimer's disease as measured by cognitive decline and change in neocortical amyloid burden. Journal of Alzheimer's disease : JAD. 2014;40:95–104. doi: 10.3233/JAD-131802. [DOI] [PubMed] [Google Scholar]
- 15.Graff-Radford NR, Crook JE, Lucas J, et al. Association of low plasma Abeta42/Abeta40 ratios with increased imminent risk for mild cognitive impairment and Alzheimer disease. Archives of neurology. 2007;64:354–362. doi: 10.1001/archneur.64.3.354. [DOI] [PubMed] [Google Scholar]
- 16.Quiroz YT, Stern CE, Reiman EM, et al. Cortical atrophy in presymptomatic Alzheimer's disease presenilin 1 mutation carriers. Journal of neurology, neurosurgery, and psychiatry. 2013;84:556–561. doi: 10.1136/jnnp-2012-303299. [DOI] [PMC free article] [PubMed] [Google Scholar]
- 17.Lendon CL, Martinez A, Behrens IM, et al. E280A PS-1 mutation causes Alzheimer's disease but age of onset is not modified by ApoE alleles. Human mutation. 1997;10:186–195. doi: 10.1002/(SICI)1098-1004(1997)10:3<186::AID-HUMU2>3.0.CO;2-H. [DOI] [PubMed] [Google Scholar]
- 18.Freire L, Roche A, Mangin JF. What is the best similarity measure for motion correction in fMRI time series? IEEE transactions on medical imaging. 2002;21:470–484. doi: 10.1109/TMI.2002.1009383. [DOI] [PubMed] [Google Scholar]
- 19.Ashburner J. A fast diffeomorphic image registration algorithm. NeuroImage. 2007;38:95–113. doi: 10.1016/j.neuroimage.2007.07.007. [DOI] [PubMed] [Google Scholar]
- 20.Ashburner J, Andersson JL, Friston KJ. Image registration using a symmetric prior--in three dimensions. Human brain mapping. 2000;9:212–225. doi: 10.1002/(SICI)1097-0193(200004)9:4<212::AID-HBM3>3.0.CO;2-#. [DOI] [PMC free article] [PubMed] [Google Scholar]
- 21.Thomas JB, Brier MR, Bateman RJ, et al. Functional connectivity in autosomal dominant and late-onset Alzheimer disease. JAMA neurology. 2014;71:1111–1122. doi: 10.1001/jamaneurol.2014.1654. [DOI] [PMC free article] [PubMed] [Google Scholar]
- 22.Chhatwal JP, Schultz AP, Johnson K, et al. Impaired default network functional connectivity in autosomal dominant Alzheimer disease. Neurology. 2013;81:736–744. doi: 10.1212/WNL.0b013e3182a1aafe. [DOI] [PMC free article] [PubMed] [Google Scholar]
- 23.Chen G, Ward BD, Chen G, Li SJ. Decreased effective connectivity from cortices to the right parahippocampal gyrus in Alzheimer's disease subjects. Brain connectivity;2014;4:702–708. doi: 10.1089/brain.2014.0295. [DOI] [PMC free article] [PubMed] [Google Scholar]
- 24.Fleisher A. JAMA neurology. In Press. [Google Scholar]
- 25.Knickmeyer RC, Wang J, Zhu H, et al. Common variants in psychiatric risk genes predict brain structure at birth. Cereb Cortex. 2014;24:1230–1246. doi: 10.1093/cercor/bhs401. [DOI] [PMC free article] [PubMed] [Google Scholar]
- 26.Fortea J, Sala-Llonch R, Bartres-Faz D, et al. Increased cortical thickness and caudate volume precede atrophy in PSEN1 mutation carriers. Journal of Alzheimer's disease : JAD. 2010;22:909–922. doi: 10.3233/JAD-2010-100678. [DOI] [PubMed] [Google Scholar]
- 27.Saura CA, Choi SY, Beglopoulos V, et al. Loss of presenilin function causes impairments of memory and synaptic plasticity followed by age-dependent neurodegeneration. Neuron. 2004;42:23–36. doi: 10.1016/s0896-6273(04)00182-5. [DOI] [PubMed] [Google Scholar]
- 28.Louvi A, Artavanis-Tsakonas S. Notch signalling in vertebrate neural development. Nature reviews Neuroscience. 2006;7:93–102. doi: 10.1038/nrn1847. [DOI] [PubMed] [Google Scholar]
- 29.Xia D, Watanabe H, Wu B, et al. Presenilin-1 Knockin Mice Reveal Loss-of-Function Mechanism for Familial Alzheimer's Disease. Neuron. 2015;85:967–981. doi: 10.1016/j.neuron.2015.02.010. [DOI] [PMC free article] [PubMed] [Google Scholar]
- 30.Bateman RJ, Aisen PS, De Strooper B, et al. Autosomal-dominant Alzheimer's disease: a review and proposal for the prevention of Alzheimer's disease. Alzheimer's research & therapy. 2011;3:1. doi: 10.1186/alzrt59. [DOI] [PMC free article] [PubMed] [Google Scholar]