

Abstract
The function of each renal tubule segment depends on the genes expressed therein. High-throughput methods used for global profiling of gene expression in unique cell types have shown low sensitivity and high false positivity, thereby limiting the usefulness of these methods in transcriptomic research. However, deep sequencing of RNA species (RNA-seq) achieves highly sensitive and quantitative transcriptomic profiling by sequencing RNAs in a massive, parallel manner. Here, we used RNA-seq coupled with classic renal tubule microdissection to comprehensively profile gene expression in each of 14 renal tubule segments from the proximal tubule through the inner medullary collecting duct of rat kidneys. Polyadenylated mRNAs were captured by oligo-dT primers and processed into adapter–ligated cDNA libraries that were sequenced using an Illumina platform. Transcriptomes were identified to a median depth of 8261 genes in microdissected renal tubule samples (105 replicates in total) and glomeruli (5 replicates). Manual microdissection allowed a high degree of sample purity, which was evidenced by the observed distributions of well established cell–specific markers. The main product of this work is an extensive database of gene expression along the nephron provided as a publicly accessible webpage (https://helixweb.nih.gov/ESBL/Database/NephronRNAseq/index.html). The data also provide genome-wide maps of alternative exon usage and polyadenylation sites in the kidney. We illustrate the use of the data by profiling transcription factor expression along the renal tubule and mapping metabolic pathways.
Keywords: nephron, transcriptional profiling, transcription factors, collecting ducts
The mammalian kidney is made up of thousands of individual nephron units that consist of a glomerulus that generates an ultrafiltrate of blood followed by a long epithelial tubule that modifies the ultrafiltrate by transporting substances into and out of it to form the final urine. The renal tubule is comprised of many segments, each with distinct cell types and functions. Beginning with the work by Burg et al.,1 physiologists have investigated the aggregate function of the kidney by microdissection and study of its component renal tubule segments. Most studies have produced targeted readouts (e.g., transport rates for particular substances, enzyme activities, and content of individual mRNA species). A broader goal, identification of all genes expressed in each cell type, has been pursued with serial analysis of gene expression (SAGE) to identify mRNA transcripts in microdissected tubules.2,3 This method, however, has limited sensitivity, requiring very large numbers of tubules per sample and limiting the transcriptomic depth (i.e., the number of genes identified per sample). The advent of deep-sequencing (next generation sequencing) technology has provided a quantum leap in sensitivity.4 This technology, when used for deep sequencing of RNA species (RNA-seq),5 is sensitive enough to allow large-scale mRNA identification and quantification in a small number of cells.6,7 In this study, we have used RNA-seq for comprehensive, multireplicate identification of transcriptomes in each of 14 renal tubule segments from rat. These data have been used to create an online resource (https://helixweb.nih.gov/ESBL/Database/NephronRNAseq/index.html). Using this database, we identified unique patterns of distribution of region–specific transcription factors, G protein–coupled receptors, and metabolic enzymes along the renal tubule.
Results
We dissected 14 different renal tubule segments from rat kidneys (Figure 1A). Preliminary RNA-seq runs confirmed successful dissection of specific segments without significant contamination by other cell types (Supplemental Figure 1). However, for a significant number of genes, reads continued beyond the annotated 3′ ends of Ref-seq transcripts (Supplemental Figure 2). To correct these annotations, baseline studies were carried out to map polyadenylation sites in kidney using polyadenylated mRNA sequencing (PA-seq)8 (Supplemental Datasets 1 and 2).
Figure 1.

The distribution of RPKM values for several marker genes match prior knowledge, documenting the precision of the technique and the accuracy of segment identification. (A) Nomenclature for renal tubule segments. (B) Median RPKMs for segment-specific markers. Aqp1, aquaporin-1; Aqp2, aquaporin-2; Slc4a1 (AE1), anion exchanger 1; Slc12a1 (NKCC2), bumetanide–sensitive Na+-K+-2Cl− cotransporter; Slc12a3 (NCC), thiazide–sensitive Na+-Cl− cotransporter; Slc14a2 (UT-A), urea transporter A; Slc22a6 (OAT1), organic anion transporter 1; Slc34a1 (NaPi-IIa), sodium-phosphate cotransporter IIa.
We analyzed a total of 105 replicates from 14 renal tubule segments (Supplemental Dataset 1). Gene expression levels of all genes determined by median reads per kilobase of exon model per million mapped reads (RPKM)9 are provided as a publicly accessible webpage (https://helixweb.nih.gov/ESBL/Database/NephronRNAseq/All_transcripts.html) and spreadsheets (Supplemental Dataset 1). Table 1 summarizes selected characteristics of the data relevant to data quality. The high percentage of mapped reads and the depth of the transcriptomes obtained are consistent with what would be expected for high-quality datasets.9,10 Reproducibility was documented by hierarchical clustering of all replicates (Figure 2, Supplemental Figure 3). Replicates from the same tubule segment clustered more closely with each other than with those from other segments.
Table 1.
General characteristics of RNA-seq experiments in microdissected renal tubule segments
| Segment | No. of Replicates | Dissected Lengths (mm) | Reads Mapped (%) | Ref-Seq Transcripts with RPKM>0 (without PA-Seq)a | Ref-Seq Transcripts with RPKM>0 (with PA-Seq)a |
|---|---|---|---|---|---|
| G | 5 | 20b | 89.0–91.8 | 11,860 | 12,141 |
| S1 | 7 | 0.6–11.8 | 74.2–93.3 | 7323 | 8238 |
| S2 | 7 | 2.2–13.0 | 74.9–90.5 | 7375 | 8261 |
| S3 | 7 | 1.8–23.6 | 77.1–91.8 | 7705 | 8502 |
| SDL | 10 | 0.8–10.8 | 77.7–91.2 | 6305 | 6995 |
| LDLOM | 9 | 2.6–12.8 | 75.2–91.7 | 6125 | 6933 |
| LDLIM | 4 | 1.4–5.1 | 83.9–89.1 | 9005 | 9649 |
| tAL | 7 | 0.6–8.4 | 70.0–91.3 | 8757 | 9600 |
| mTAL | 7 | 2.6–9.5 | 83.7–92.5 | 5895 | 6659 |
| cTAL | 7 | 1.2–12.2 | 72.3–92.1 | 11,146 | 11,653 |
| DCT | 8 | 2–23b | 76.9–92.9 | 9453 | 10,219 |
| CNT | 6 | 1.2–11.8 | 70.0–91.1 | 7573 | 8409 |
| CCD | 11 | 1.6–12.4 | 81.5–91.5 | 8302 | 9119 |
| OMCD | 7 | 0.8–14.4 | 82.6–92.3 | 6880 | 7601 |
| IMCD | 8 | 0.8–6.7 | 73.0–92.7 | 8966 | 9581 |
Nomenclature of tubule segments is shown in Figure 1A.
Median numbers.
Number of dissected structures.
Figure 2.
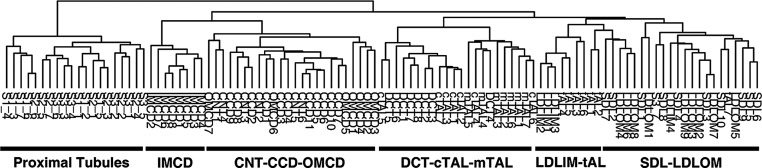
A dendrogram created by hierarchical clustering of 105 replicates of microdissected renal tubule segments demonstrates reproducibility among replicates from the same segment. (Supplemental Figure 3 shows the full heat map representation). Replicates from 14 different renal tubule segments were found to form six distinct clusters according to their anatomic and functional organization. Terminology is the same as in Figure 1A.
Although not the focus of this study, data from microdissected glomeruli are also provided as a webpage (https://helixweb.nih.gov/ESBL/Database/NephronRNAseq/glomerulus.html) and spreadsheets (Supplemental Dataset 1). Classic glomerular markers, such as nephrin (Nphs1) and podocin (Nphs2), were found to have high RPKM values in all replicates from glomeruli.
For renal tubule samples, RPKM values ranged over at least four orders of magnitude. For example, in the cortical collecting duct, the water channel aquaporin-2 (Aqp2) has a median RPKM of 6776, β-actin (Actb) has a median RPKM of 724, and protein kinase A catalytic subunit-β1 (Prkacb) has a median RPKM of 11. All of these gene products have important functional roles, despite the wide range of expression levels.
Figure 1B shows median RPKMs of several water and solute transporters plotted as a function of the position along the renal tubule. The distribution of RPKMs of each transcript exactly matched prior knowledge.11,12 These data provide further documentation for the precision of the technique and the accuracy of segment identification. The renal tubule distributions obtained using RNA-seq showed a high degree of concordance with distributions found using single-tubule RT-PCR for several targets (viz., all three subunits of the epithelial sodium channel [Scnn1a, Scnn1b, and Scnn1g], the basolateral chloride channel ClC-K2 [Clcnkb], the urea channel UT-A [Slc14a2], and the parathyroid hormone receptor [Pth1r]) (Supplemental Material, Supplemental Figure 4).
The single–tubule RNA-seq data provide valuable qualitative information by mapping alternative exon usage for many genes. Figure 3 shows two physiologically important examples. Figure 3A depicts differential use of 5′-end exons between two isoforms of Fxyd2 that encode the γ-subunit of the Na+/K+-ATPase. The Na+/K+-ATPase drives most of the active transepithelial transport across renal tubule segments. The γ-subunit modulates the affinity of the pump for Na+, K+, and ATP.13 The data show that all the segments that display regulated Na+-Cl− transport against significant transepithelial gradients (mTAL, cTAL, DCT, CNT, and CCD) use the first alternative initial exon (Fxyd2b). In contrast, the segments that do not carry out substantial transepithelial Na+-Cl− transport (thin limbs of Henle and IMCD) or carry out unregulated isosmotic Na+-Cl− transport (proximal tubule segments) tend to use the second alternative initial exon (Fxyd2a). This alternative use of first exons has been suggested to play a role in post-transcriptional regulation of Fxyd2b transcripts.14
Figure 3.

Mapping of deep sequencing reads to gene structure reveals alternative exon usage in different renal tubule segments for some genes. (A) Alternative initial (5′ end) exon usage in the γ-subunit of Na+-K+ ATPase (Fxyd2). (B) Alternative terminal (3′ end) exon usage in glutaminase (Gls).
Figure 3B shows two glutaminase (Gls) isoforms with alternative carboxyl–terminal amino acid sequences and 3′-untranslated regions. The short isoform predominates in segments downstream from the proximal tubule, but the long isoform is more abundant in proximal tubule. In rats, the 3′-untranslated region of the long isoform contains an AU-rich, pH-responsive element that destabilizes the transcript in the absence of acidosis in some cell types,15 consistent with the idea that glutaminase enzyme activity is present throughout the renal tubule but regulated only in the proximal tubule.16
Table 2 provides a thumbnail view of gene expression along the renal tubule, showing only the transcripts with the highest median RPKM values for each segment in specific gene categories. In addition to water channels and transporters with distributions that are highly consistent with prior knowledge, Table 2 contains a few genes that have no known roles in renal physiology. For example, there are no known roles for the growth hormone–releasing hormone receptor (Ghrhr). Ghrhr is strongly expressed in the thin descending limb of Henle (SDL and LDLOM). Another example is found among transcripts coding for secreted proteins, namely the abundant expression of defensin-β1 (Defb1) in collecting duct segments. Defb1 is an antibacterial protein that is part of the innate immune system.17
Table 2.
Transcripts with the highest expression levels in specific categories
| Segment | All Nonhousekeeping Genesa | Transporters | G Protein–Coupled Receptors | Protein Kinases | Secreted Proteins |
|---|---|---|---|---|---|
| S1 | Gpx3 | Slc34a1 | Pth1r | Map3k7 | Sepp1 |
| S2 | Kap | Slc34a1 | Pth1r | Pink1 | Kap |
| S3 | Kap | Slc7a13 | Pth1r | Pim3 | Kap |
| SDL | Spp1 | Aqp1 | Ghrhr | Tgfbr2 | Spp1 |
| LDLOM | S100a6 | Aqp1 | Ghrhr | Tgfbr2 | Spp1 |
| LDLIM | Spp1 | Aqp1 | Gprc5a | Map3k7 | Spp1 |
| tAL | Akr1b1 | Cldn4 | Gprc5c | Pim3 | Clu |
| mTAL | Umod | Slc12a1 | Ptger3 | Map3k7 | Umod |
| cTAL | Umod | Clcnkb | Casr | Map3k7 | Umod |
| DCT | Map3k7 | Slc12a3 | Ptger3 | Map3k7 | Defb1 |
| CNT | Aqp2 | Aqp2 | Avpr2 | Map3k7 | Defb1 |
| CCD | Aqp2 | Aqp2 | Avpr2 | Map3k7 | Defb1 |
| OMCD | Aqp2 | Aqp2 | Avpr2 | Sgk1 | Defb1 |
| IMCD | S100a6 | Aqp2 | Avpr2 | Sgk1 | Guca2a |
Highest RPKM values in each segment. See https://helixweb.nih.gov/ESBL/Database/NephronRNAseq/index.html for a full report of all categories.
Housekeeping genes are those with expression of RPKM>1 in all segments.
Cell Type–Specific Transcription Factors
Cell type–specific gene expression depends largely on what combinations of transcription factors are expressed in the cell. For this study, we defined transcription factors as proteins that bind to DNA through a sequence–specific DNA–binding domain and regulate transcription.18 Of 456 Ref-seq–annotated transcription factors expressed in at least one segment, a subset of highly abundant transcription factors showed distinct patterns of distribution along the renal tubule (Figure 4, Supplemental Figure 5). Several of these showed region-specific expression (Figure 4A), including hepatocyte nuclear factor 4a (Hnf4a) in proximal tubule segments; Iroquois homeobox 5 (Irx5) in thin limbs of the loop of Henle; Irx2 in the thick ascending limbs; and forkhead box i1 (Foxi1), H6 homeobox 2 (Hmx2), and GATA-binding protein 2 (Gata2) in collecting duct segments. Other transcription factors were expressed in two contiguous regions (Figure 4B), including three that had been implicated in cell type–specific gene expression, namely spalt–like transcription factor 1 (Sall1), homeobox D10 (Hoxd10), and homeobox B7 (Hoxb7). The pattern seen for Hoxb7 is interesting, because this gene is widely considered to be expressed only in the collecting duct system.19 In fact, the Hoxb7 promoter is used to target expression to ureteric bud–derived segments in mice. Other transcription factors showed a bimodal pattern, in which there was a skipped region between two regions of high expression (Figure 4, C and D). Most often, these were expressed in thin limbs and collecting ducts. Some of these showed expression in thin limbs and all parts of the collecting duct, including those in the cortical region (Figure 4C). Others showed expression in thin limbs, but collecting duct expression was limited to the inner medullary collecting duct (Figure 4D). This last group has a plausible connection to physiologic factors related to the countercurrent mechanism, namely high osmolality and low oxygen tension.
Figure 4.

Transcription factors show distinct patterns of expression along the renal tubule. The distributions can be mapped to general regions (proximal region [S1, S2, and S3], thin-limb region, thick-limb/DCT region [mTAL, cTAL, and DCT], and collecting duct region [CNT, CCD, OMCD, and IMCD]). (A) Transcription factors specific to a renal tubule region. (B) Transcription factors expressed in two contiguous regions. (C) Transcription factors with bimodal pattern of expression. (D) Transcription factors with bimodal pattern but expression only in the inner medulla.
Critical Enzymes in Metabolic Pathways
Another class of genes for which a deeper analysis of transcript distribution is worthwhile is metabolic enzymes. Although energy metabolism is well understood in proximal tubule segments, few studies have been done in the other renal tubule segments, especially the thin limbs of Henle and the distal convoluted tubule. In a heat map showing the expression of critical enzymes for selected metabolic pathways (Figure 5), the proximal tubule segments stand out as having a unique profile. As is generally accepted, key glycolytic enzymes (hexokinase Hk1; phosphofructokinases Pfkm, Pfkl, and Pfkp; and pyruvate kinase Pkm) are missing in the proximal tubule, consistent with the view that the proximal tubule does not use glucose for energy metabolism.20 Also consistent with the generally accepted view, the proximal tubule strongly expresses mRNAs for enzymes that are critical for gluconeogenesis. Glycogen synthase (Gys1) was absent, and the enzyme complex that dephosphorylates glucose (G6pc and Slc37a4) was present, indicating that gluconeogenesis likely results in net glucose production rather than glycogen accumulation. In contrast to the lack of glycolytic enzymes, the key enzymes for fructolysis, namely ketohexokinase (fructokinase Khk) and dihydroxyacetone kinase 2 (triokinase Dak), are strongly expressed in the proximal tubule. The expression of carnitine palmitoyltransferases was particularly high in the thick ascending limb and distal convoluted tubule, suggesting that fatty acid oxidation may be important in these segments. In addition, argininosuccinate synthase (Ass1), necessary for arginine synthesis, was expressed chiefly in the proximal tubule, suggesting that the proximal tubule is responsible for arginine synthesis by the kidney, the major producer of arginine in the body.21 Little or nothing is known about metabolic processes in thin limb segments. The data suggest that ATP production in the thin limbs, like the more distal segments, is based on glucose metabolism. Hexokinase 1 and phosphofructokinases, critical for glycolysis, are expressed in all segments beyond the proximal tubule. Lactate is also an important substrate in the kidney.22–24 Isoforms of lactate dehydrogenase showed distinct patterns of expression along the renal tubule (Supplemental Figure 6). The so-called heart isoform, Ldhb, that is generally associated with lactate use25 predominates in the proximal tubule, the thick ascending limb of Henle, and the distal convoluted tubule. The skeletal muscle isoform, Ldha, associated with lactate production25 predominates in all thin limb segments and all collecting duct segments, consistent with the observation that lactate accumulates in the renal medulla.26 In addition, the adjacency of the lactate–producing thin descending limbs in the outer medulla to lactate–using medullary thick ascending limbs may be critical to the maintenance of the high rates of active sodium chloride transport in the medullary thick ascending limb needed to drive the countercurrent multiplier mechanism.27
Figure 5.

Genes coding for metabolic enzymes are expressed in patterns along the renal tubule that correlate with function. Expression of metabolic enzymes critical for specific metabolic pathways are presented as a heat map showing specific metabolic pathways.
Genes Specific to the Nephron and Collecting Duct
The renal tubule is classically divided into two regions on the basis of their developmental origins, namely the nephron (metanephric mesenchyme derived) and the collecting duct (ureteric bud derived). Hierarchical clustering (Concise Methods) identified nephron- or collecting duct–specific transcripts (Figure 6A, Supplemental Dataset 3). One important group of proteins that discriminates between the two regions is secreted proteins. Several secreted proteins seemed to be selectively expressed in the collecting duct segments, namely Defb1, glycoprotein hormone-α2 (Gpha2), gremlin-1 (BMP antagonist 1 Grem1), and guanylate cyclase activator 2a (guanylin Guca2a). Each of these has a plausible functional role (Supplemental Dataset 3). Nephron-specific transcripts include a number of abundant secreted proteins, including osteopontin (Spp1), kidney androgen–regulated protein (Kap), clusterin (Clu), activin-binding protein (Fst), and trefoil factor 3 (Tff3). Interestingly, among nephron-specific transcripts, there were several transcripts for proteins involved in glutathione metabolism and oxidation using molecular oxygen, reflecting known proximal tubule functions (Supplemental Dataset 3).
Figure 6.

Some transcripts are selectively expressed in developmentally or anatomically defined renal elements. (A) Transcripts selectively expressed in nephron- and collecting duct–derived segments. (B) Transcripts selectively expressed in the cortex and the medulla.
Genes Enriched in the Medulla
The renal medulla has a parallel structure involving loops of Henle and collecting ducts that is important in the urinary concentrating mechanism. Transcripts enriched in the renal medulla were identified by hierarchical clustering (Figure 6B). In addition to markers of specific cell types (the urea channel Slc14a2 in thin limbs and IMCD23 and sodium– and chloride–dependent betaine transporter Slc6a12 in thin limbs28), this heat map shows less well known genes, such as G protein–coupled receptors (Ghrhr and Gprc5a) and extracellular region–associated proteins (Fst, Ccl7, and Cxcl1). Gene-enrichment analysis (DAVID)29,30 using 928 genes selectively expressed in the medulla revealed several Gene Ontology (GO) terms (Supplemental Dataset 4), including the extracellular region group. Genes in this group (n=45) included cytokines/chemokines, growth factors, extracellular matrix–associated proteins, proteases, protease inhibitors, ligand antagonists, and hormones (Figure 7). Among these, Wnt7b is of particular interest, because it plays a crucial role in the development of the corticomedullary axis and the elongation of the loop of Henle.31 In our dataset, Wnt7b was virtually exclusively expressed in the thin limbs of the loop of Henle and inner medullary collecting ducts.
Figure 7.

Forty-five medulla-enriched genes are associated with the GO cellular component term ‘extracellular region’.
Discussion
Here, we report the transcriptomic profiling of 14 different renal tubule segments using a combination of classic manual microdissection and RNA-seq. The resulting online database and the data deposited in the Gene Expression Omnibus (GEO) provide useful resources for future studies of renal systems biology, physiology, and development. For example, it can predict labeling patterns for new, previously uncharacterized antibodies, it can provide information about alternative exon usage, it can predict roles for previously unstudied proteins, and it can help us to understand an unexpected phenotype of a transgenic animal. In separate studies, we have reported genome-wide mapping of polyadenylation sites for genes expressed in the kidney, providing reference data for future RNA-seq studies in the kidney.
RNA-seq offers important advantages over other approaches to kidney transcriptomics, such as DNA microarrays using biochemically isolated segments32,33 or SAGE of microdissected renal tubule segments.2,3 Compared with biochemical isolation techniques,34–36 manual dissection virtually eliminates contamination from neighboring segments. RNA-seq does not depend on hybridization and therefore, eliminates false positivity caused by cross-hybridization in microarray studies. Compared with SAGE, RNA-seq offers an approximately two orders of magnitude increase in sensitivity, allowing deep profiling in a few millimeters of microdissected tubules.
This paper provides a limited number of examples of bioinformatic analyses to illustrate some uses of the database. Of particular interest were the profiles of transcription factor expression along the nephron and expression profiles of genes coding for metabolic enzymes. These examples show how transcriptomic profiling along the nephron can fill in the gaps, providing comprehensive information in renal tubules segments that are poorly studied, including the thin limb segments of Henle’s loop and the distal convoluted tubule. Also of interest was the identification of genes specific to the renal medulla, genes specific to segments derived from the ureteric bud, and genes specific to segments derived from the metanephric mesenchyme. The data can potentially provide useful information for developmental studies, because the adult kidney is the end point of the developmental process.
Concise Methods
Microdissection of Renal Tubule Segments
We followed the standard protocol for microdissection of renal tubule segments from rat kidney.37 Male Sprague–Dawley rats weighing 200–250 g (Animal Study Protocol No. H-0110R2; approved by the Animal Care and Use Committee, National Heart, Lung, and Blood Institute) were euthanized and processed for microdissection as described in Supplemental Material.
RNA-Seq
Reverse transcription with an oligo-dT primer and cDNA amplification were done following the single–cell RNA-seq protocol.38 cDNAs were sonicated into approximately 200-bp fragments (Covaris) and made into adapter–ligated cDNA libraries using an Ovation Ultralow Library System (NuGen). cDNAs ranging from 200 to 400 bp were selected on 2% agarose gel and sequenced on a HiSeq2000 platform (Illumina) to generate 50-bp paired-end FASTQ sequences. The raw FASTQ sequences were mapped to the rat reference genome (rn5) using STAR 2.3.0.39 Only uniquely mapped reads were included in the downstream analysis. RPKMs for Ref-seq transcripts were calculated using the HOMER software.40 Mapped reads were visualized on the UCSC Genome Browser. RNA-seq library quality was assessed as described by Adiconis et al.41 Basically, RNA-seq library quality in small samples is assessed in terms of the fraction of mapped reads versus total number of reads and the fraction of reads mapped to genomic features (in our case, exons). We used a threshold of 70% of total reads mapped to the reference genome (Supplemental Dataset 1). In this study, 110 of 134 samples met this criterion and are reported in this paper.
PA-Seq
Polyadenylation sites of renal tubule transcripts were identified using a PA-seq protocol reported previously.8 Ten micrograms DNA–free total RNA prepared from a rat kidney were made into cDNA libraries and sequenced using an Illumina HiSeq2000 platform. RNA-seq reads mapped to the interval between the Ref-seq–annotated 3′ end of the transcript and the tallest PA-seq peak within 5,000 bp downstream from the Ref-seq–annotated 3′ end were included in the calculation of revised RPKM values.
Data Analyses
To identify region–specific gene expression, we calculated the variance of log-transformed RPKMs across the renal tubule segments that we intended to cluster. Transcripts with the highest variances were selected for hierarchical cluster analysis. Euclidian distances were calculated between log2-transformed RPKMs, and the complete clustering method was used. For transcription factor analysis, we downloaded a list of rat transcription factors from an online resource (available at http://www.bioguo.org/AnimalTFDB/index.php)18 and analyzed only Ref-seq–annotated transcription factors (n=456). Graphs and heat maps were drawn using R (http://www.r-project.org) packages ggplot2 and pheatmap. GO term analysis was performed using DAVID.29 For DAVID analysis of nephron/collecting duct– and cortex/medulla-enriched genes, transcripts at least moderately expressed in either compartment (i.e., mean of RPKMs>10 in either compartment) were used as background (n=3339 for nephron versus collecting duct in Supplemental Dataset 3; n=6943 for cortex versus medulla in Supplemental Dataset 4). In cortex versus medulla, transcripts enriched in GO terms related to the extracellular region (n=91; e.g., ‘extracellular region’, ‘extracellular space’, ‘extracellular matrix’, etc.) were further inspected to remove redundant or misannotated transcripts.
Data Availability
The FASTQ sequences and metadata have been deposited in NCBI’s GEO (accession no. GSE56743; http://www.ncbi.nlm.nih.gov/geo/query/acc.cgi?acc=GSE56743).
Disclosures
None.
Supplementary Material
Acknowledgments
We thank Fahad Saeed for assistance with website construction. Next generation sequencing was done in the National Heart, Lung and Blood Institute (NHLBI) DNA Sequencing and Genomics Core Facility (Jun Zhu, Director).
The work was funded by Division of Intramural Research, NHLBI Projects ZIA-HL001285 and ZIA-HL006129 (to M.A.K.).
Some results were presented at the Annual Meeting of the American Society of Nephrology on October 30–November 4, 2012 (San Diego, CA) and November 5–10, 2013 (Atlanta, GA).
Footnotes
Published online ahead of print. Publication date available at www.jasn.org.
See related editorial, “A Transcriptional Map of the Renal Tubule: Linking Structure to Function,” on pages 2603–2605.
This article contains supplemental material online at http://jasn.asnjournals.org/lookup/suppl/doi:10.1681/ASN.2014111067/-/DCSupplemental.
References
- 1.Burg M, Grantham J, Abramow M, Orloff J: Preparation and study of fragments of single rabbit nephrons. Am J Physiol 210: 1293–1298, 1966 [DOI] [PubMed] [Google Scholar]
- 2.Chabardès-Garonne D, Mejéan A, Aude JC, Cheval L, Di Stefano A, Gaillard MC, Imbert-Teboul M, Wittner M, Balian C, Anthouard V, Robert C, Ségurens B, Wincker P, Weissenbach J, Doucet A, Elalouf JM: A panoramic view of gene expression in the human kidney. Proc Natl Acad Sci U S A 100: 13710–13715, 2003 [DOI] [PMC free article] [PubMed] [Google Scholar]
- 3.Cheval L, Pierrat F, Dossat C, Genete M, Imbert-Teboul M, Duong Van Huyen JP, Poulain J, Wincker P, Weissenbach J, Piquemal D, Doucet A: Atlas of gene expression in the mouse kidney: New features of glomerular parietal cells. Physiol Genomics 43: 161–173, 2011 [DOI] [PubMed] [Google Scholar]
- 4.Koboldt DC, Steinberg KM, Larson DE, Wilson RK, Mardis ER: The next-generation sequencing revolution and its impact on genomics. Cell 155: 27–38, 2013 [DOI] [PMC free article] [PubMed] [Google Scholar]
- 5.Wang Z, Gerstein M, Snyder M: RNA-Seq: A revolutionary tool for transcriptomics. Nat Rev Genet 10: 57–63, 2009 [DOI] [PMC free article] [PubMed] [Google Scholar]
- 6.Saliba AE, Westermann AJ, Gorski SA, Vogel J: Single-cell RNA-seq: Advances and future challenges. Nucleic Acids Res 42: 8845–8860, 2014 [DOI] [PMC free article] [PubMed] [Google Scholar]
- 7.Tang F, Barbacioru C, Wang Y, Nordman E, Lee C, Xu N, Wang X, Bodeau J, Tuch BB, Siddiqui A, Lao K, Surani MA: mRNA-Seq whole-transcriptome analysis of a single cell. Nat Methods 6: 377–382, 2009 [DOI] [PubMed] [Google Scholar]
- 8.Ni T, Yang Y, Hafez D, Yang W, Kiesewetter K, Wakabayashi Y, Ohler U, Peng W, Zhu J: Distinct polyadenylation landscapes of diverse human tissues revealed by a modified PA-seq strategy. BMC Genomics 14: 615, 2013 [DOI] [PMC free article] [PubMed] [Google Scholar]
- 9.Mortazavi A, Williams BA, McCue K, Schaeffer L, Wold B: Mapping and quantifying mammalian transcriptomes by RNA-Seq. Nat Methods 5: 621–628, 2008 [DOI] [PubMed] [Google Scholar]
- 10.Sultan M, Schulz MH, Richard H, Magen A, Klingenhoff A, Scherf M, Seifert M, Borodina T, Soldatov A, Parkhomchuk D, Schmidt D, O’Keeffe S, Haas S, Vingron M, Lehrach H, Yaspo ML: A global view of gene activity and alternative splicing by deep sequencing of the human transcriptome. Science 321: 956–960, 2008 [DOI] [PubMed] [Google Scholar]
- 11.Agre P, Nielsen S, Knepper MA: Aquaporin water channels in mammalian kidney. In: The Kidney: Physiology and Pathophysiology, edited by Seldin DW, Giebisch G, Philadelphia, Lippincott, 2000, pp 363–378 [Google Scholar]
- 12.Berger UV, Peng J-B, Hediger MA: The membrane transporter families in mammals. In: The Kidney: Physiology and Pathophysiology, edited by Seldin DW, Giebisch G, Philadelphia, Lippincott, 2000, pp 107–138 [Google Scholar]
- 13.Arystarkhova E, Wetzel RK, Asinovski NK, Sweadner KJ: The gamma subunit modulates Na(+) and K(+) affinity of the renal Na,K-ATPase. J Biol Chem 274: 33183–33185, 1999 [DOI] [PubMed] [Google Scholar]
- 14.Sweadner KJ, Pascoa JL, Salazar CA, Arystarkhova E: Post-transcriptional control of Na,K-ATPase activity and cell growth by a splice variant of FXYD2 protein with modified mRNA. J Biol Chem 286: 18290–18300, 2011 [DOI] [PMC free article] [PubMed] [Google Scholar]
- 15.Ibrahim H, Lee YJ, Curthoys NP: Renal response to metabolic acidosis: Role of mRNA stabilization. Kidney Int 73: 11–18, 2008 [DOI] [PMC free article] [PubMed] [Google Scholar]
- 16.Wright PA, Knepper MA: Phosphate-dependent glutaminase activity in rat renal cortical and medullary tubule segments. Am J Physiol 259: F961–F970, 1990 [DOI] [PubMed] [Google Scholar]
- 17.Crovella S, Antcheva N, Zelezetsky I, Boniotto M, Pacor S, Verga Falzacappa MV, Tossi A: Primate beta-defensins—structure, function and evolution. Curr Protein Pept Sci 6: 7–21, 2005 [DOI] [PubMed] [Google Scholar]
- 18.Zhang HM, Chen H, Liu W, Liu H, Gong J, Wang H, Guo AY: AnimalTFDB: A comprehensive animal transcription factor database. Nucleic Acids Res 40: D144–D149, 2012 [DOI] [PMC free article] [PubMed] [Google Scholar]
- 19.Srinivas S, Goldberg MR, Watanabe T, D’Agati V, al-Awqati Q, Costantini F: Expression of green fluorescent protein in the ureteric bud of transgenic mice: A new tool for the analysis of ureteric bud morphogenesis. Dev Genet 24: 241–251, 1999 [DOI] [PubMed] [Google Scholar]
- 20.Schmid H, Scholz M, Mall A, Schmidt U, Guder WG, Dubach UC: Carbohydrate metabolism in rat kidney: Heterogeneous distribution of glycolytic and gluconeogenic key enzymes. Curr Probl Clin Biochem 8: 282–289, 1977 [PubMed] [Google Scholar]
- 21.Brosnan ME, Brosnan JT: Renal arginine metabolism. J Nutr 134[10 Suppl]: 2791S–2795S, 2004 [DOI] [PubMed] [Google Scholar]
- 22.Uchida S, Endou H: Substrate specificity to maintain cellular ATP along the mouse nephron. Am J Physiol 255: F977–F983, 1988 [DOI] [PubMed] [Google Scholar]
- 23.Klein KI, Wang MS, Torikai S, Davidson W, Kurokawa K: Substrate oxidation by defined single nephron segments of rat kidney. Int J Biochem 12: 53–54, 1980 [DOI] [PubMed] [Google Scholar]
- 24.Nonaka T, Stokes JB: Metabolic support of Na+ transport by the rabbit CCD: Analysis of the use of equivalent current. Kidney Int 45: 743–752, 1994 [DOI] [PubMed] [Google Scholar]
- 25.Markert CL: Lactate dehydrogenase. Biochemistry and function of lactate dehydrogenase. Cell Biochem Funct 2: 131–134, 1984 [DOI] [PubMed] [Google Scholar]
- 26.Scaglione PR, Dell RB, Winters RW: Lactate concentration in the medulla of rat kidney. Am J Physiol 209: 1193–1198, 1965 [DOI] [PubMed] [Google Scholar]
- 27.Hervy S, Thomas SR: Inner medullary lactate production and urine-concentrating mechanism: A flat medullary model. Am J Physiol Renal Physiol 284: F65–F81, 2003 [DOI] [PubMed] [Google Scholar]
- 28.Zhou Y, Holmseth S, Hua R, Lehre AC, Olofsson AM, Poblete-Naredo I, Kempson SA, Danbolt NC: The betaine-GABA transporter (BGT1, slc6a12) is predominantly expressed in the liver and at lower levels in the kidneys and at the brain surface. Am J Physiol Renal Physiol 302: F316–F328, 2012 [DOI] [PubMed] [Google Scholar]
- 29.Huang W, Sherman BT, Lempicki RA: Bioinformatics enrichment tools: Paths toward the comprehensive functional analysis of large gene lists. Nucleic Acids Res 37: 1–13, 2009 [DOI] [PMC free article] [PubMed] [Google Scholar]
- 30.Huang W, Sherman BT, Lempicki RA: Systematic and integrative analysis of large gene lists using DAVID bioinformatics resources. Nat Protoc 4: 44–57, 2009 [DOI] [PubMed] [Google Scholar]
- 31.Yu J, Carroll TJ, Rajagopal J, Kobayashi A, Ren Q, McMahon AP: A Wnt7b-dependent pathway regulates the orientation of epithelial cell division and establishes the cortico-medullary axis of the mammalian kidney. Development 136: 161–171, 2009 [DOI] [PMC free article] [PubMed] [Google Scholar]
- 32.Yu MJ, Miller RL, Uawithya P, Rinschen MM, Khositseth S, Braucht DW, Chou CL, Pisitkun T, Nelson RD, Knepper MA: Systems-level analysis of cell-specific AQP2 gene expression in renal collecting duct. Proc Natl Acad Sci U S A 106: 2441–2446, 2009 [DOI] [PMC free article] [PubMed] [Google Scholar]
- 33.Uawithya P, Pisitkun T, Ruttenberg BE, Knepper MA: Transcriptional profiling of native inner medullary collecting duct cells from rat kidney. Physiol Genomics 32: 229–253, 2008 [DOI] [PMC free article] [PubMed] [Google Scholar]
- 34.Balaban RS, Soltoff SP, Storey JM, Mandel LJ: Improved renal cortical tubule suspension: Spectrophotometric study of O2 delivery. Am J Physiol 238: F50–F59, 1980 [DOI] [PubMed] [Google Scholar]
- 35.Chamberlin ME, LeFurgey A, Mandel LJ: Suspension of medullary thick ascending limb tubules from the rabbit kidney. Am J Physiol 247: F955–F964, 1984 [DOI] [PubMed] [Google Scholar]
- 36.Stokes JB, Grupp C, Kinne RK: Purification of rat papillary collecting duct cells: Functional and metabolic assessment. Am J Physiol 253: F251–F262, 1987 [DOI] [PubMed] [Google Scholar]
- 37.Wright PA, Burg MB, Knepper MA: Microdissection of kidney tubule segments. Methods Enzymol 191: 226–231, 1990 [DOI] [PubMed] [Google Scholar]
- 38.Tang F, Barbacioru C, Nordman E, Li B, Xu N, Bashkirov VI, Lao K, Surani MA: RNA-Seq analysis to capture the transcriptome landscape of a single cell. Nat Protoc 5: 516–535, 2010 [DOI] [PMC free article] [PubMed] [Google Scholar]
- 39.Dobin A, Davis CA, Schlesinger F, Drenkow J, Zaleski C, Jha S, Batut P, Chaisson M, Gingeras TR: STAR: Ultrafast universal RNA-seq aligner. Bioinformatics 29: 15–21, 2013 [DOI] [PMC free article] [PubMed] [Google Scholar]
- 40.Heinz S, Benner C, Spann N, Bertolino E, Lin YC, Laslo P, Cheng JX, Murre C, Singh H, Glass CK: Simple combinations of lineage-determining transcription factors prime cis-regulatory elements required for macrophage and B cell identities. Mol Cell 38: 576–589, 2010 [DOI] [PMC free article] [PubMed] [Google Scholar]
- 41.Adiconis X, Borges-Rivera D, Satija R, DeLuca DS, Busby MA, Berlin AM, Sivachenko A, Thompson DA, Wysoker A, Fennell T, Gnirke A, Pochet N, Regev A, Levin JZ: Comparative analysis of RNA sequencing methods for degraded or low-input samples. Nat Methods 10: 623–629, 2013 [DOI] [PMC free article] [PubMed] [Google Scholar]
Associated Data
This section collects any data citations, data availability statements, or supplementary materials included in this article.
Supplementary Materials
Data Availability Statement
The FASTQ sequences and metadata have been deposited in NCBI’s GEO (accession no. GSE56743; http://www.ncbi.nlm.nih.gov/geo/query/acc.cgi?acc=GSE56743).