Abstract
Purpose.
To characterize by Fourier-domain optical coherence tomography (FD-OCT) the loss of nerve fiber layer (NFL) and ganglion cell complex (GCC) in nonarteritic ischemic optic neuropathy (NAION).
Methods.
Patients diagnosed with NAION were enrolled and categorized into “superior field loss (SFL),” “inferior field loss (IFL),” and “bihemispheric field loss (BFL)” groups based on the Swedish interactive threshold algorithm 30-2 achromatic visual field (VF) tests. Six months after presentation, they were scanned by FD-OCT to map peripapillary NFL and macular GCC thicknesses. Age-matched normals were selected from participants in the Advanced Imaging for Glaucoma Study (www.AIGStudy.net). Deviation maps were defined as the difference between the thickness maps and the average normal maps. Pearson's correlation coefficient was used to assess the correlation between VF and OCT measurements.
Results.
Twenty-five NAION eyes in 20 subjects were analyzed. Most (2/3) SFL cases showed inferior NFL loss with variable sparing of inferonasal losses. All (4/4) IFL cases showed superior NFL loss with variable inferonasal extension. The GCC maps demonstrated clear hemispheric loss pattern in agreement with VFs. NFL and GCC losses could be detected even in the less affected hemispheres (P < 0.001). NFL and GCC were highly correlated (P < 0.001) with VF in terms of both overall averages and superior–inferior hemispheric differences.
Conclusions.
NFL and GCC losses correlated well with VF losses in both magnitude and location. Hemispheric GCC loss correlated with altitudinal VF loss and this pattern may be of diagnostic value. FD-OCT is useful in the evaluation of NAION.
Peripapillary nerve fiber layer and macular ganglion cell complex maps as evaluated by Fourier-domain optical coherence tomography showed characteristic patterns of loss that correlated with altitudinal visual field loss in nonarteritic anterior ischemic optic neuropathy.
Introduction
Nonarteritic anterior ischemic optic neuropathy (NAION) is the most common optic neuropathy in the elderly after glaucoma.1 The incidence of NAION has been estimated to be 2–10/100,000 in the United States.1,2 Classically, NAION presents with painless, unilateral, sudden onset, and loss of vision in people older than 50 years of age. Optic nerve function is compromised and there is an afferent pupillary defect. Altitudinal visual field defect is a hallmark of NAION. Visual acuity may be mildly or severely impacted depending on whether the visual field (VF) defect includes fixation.
NAION is caused by ischemia of the optic nerve head (ONH) in the region of the lamina cribrosa. It leads to apoptosis of retinal ganglion cells and optic nerve atrophy.3 Optic nerve pallor, observed on fundus examination, is a subjective method of assessing the loss of ganglion cells and axons.
There have been only a few histologic studies of NAION.4–6 Due to the limitations on the number of sections in each eye and the number of eyes that can be practically examined by histology, there remains some ambiguity regarding the distribution of anatomic changes caused by the infarcts in NAION. Optical coherence tomography (OCT), a noncontact high-resolution imaging technique, provides an objective method to characterize the nerve fiber layer (NFL) loss in NAION.7 With the recent advent of Fourier-domain optical coherence tomography (FD-OCT) technology, which is much faster than conventional time-domain OCT, we can now also map the thickness of the macular ganglion cell complex (GCC).8 In this prospective case series, we used FD-OCT to analyze the patterns of GCC and NFL loss in NAION patients and correlate them with patterns of VF loss.
Methods
Data Collection
All patients diagnosed with NAION at the Doheny Eye Institute from March 2007 to March 2009 were considered for enrollment in the study. The study protocol adhered to the tenets of the Declaration of Helsinki. The University of Southern California Institutional Review Board approved the study protocol, and informed consent was obtained from all subjects who participated in the study.
The diagnosis of NAION was made on the basis of comprehensive ophthalmologic examination, including detailed history, visual acuity assessment with the Snellen chart, optic nerve function tests, fundus examination, and VF defects consistent with NAION. The time lag between the ischemic event and the OCT scan was at least 6 months to eliminate the effects of optic disc and NFL edema observed in the acute phase.
VFs were assessed with a commercial VF analyzer (Humphrey Visual Field Analyzer; Carl Zeiss Meditech, Inc., Dublin, CA) using the Swedish interactive threshold algorithm (SITA) 30-2 program. Only patients with reliable VFs (defined as fixation losses and false-positive and false-negative results less than 33%) were included in the study.
The patients were categorized according to the location of VF loss into three groups: “inferior field loss” (IFL), “superior field loss” (SFL), and “bihemispheric field loss” (BFL).9 We assumed arcuate, quadrantile, and altitudinal defects in the same hemifield to be a part of one category.7
Fourier-Domain Optical Coherence Tomography
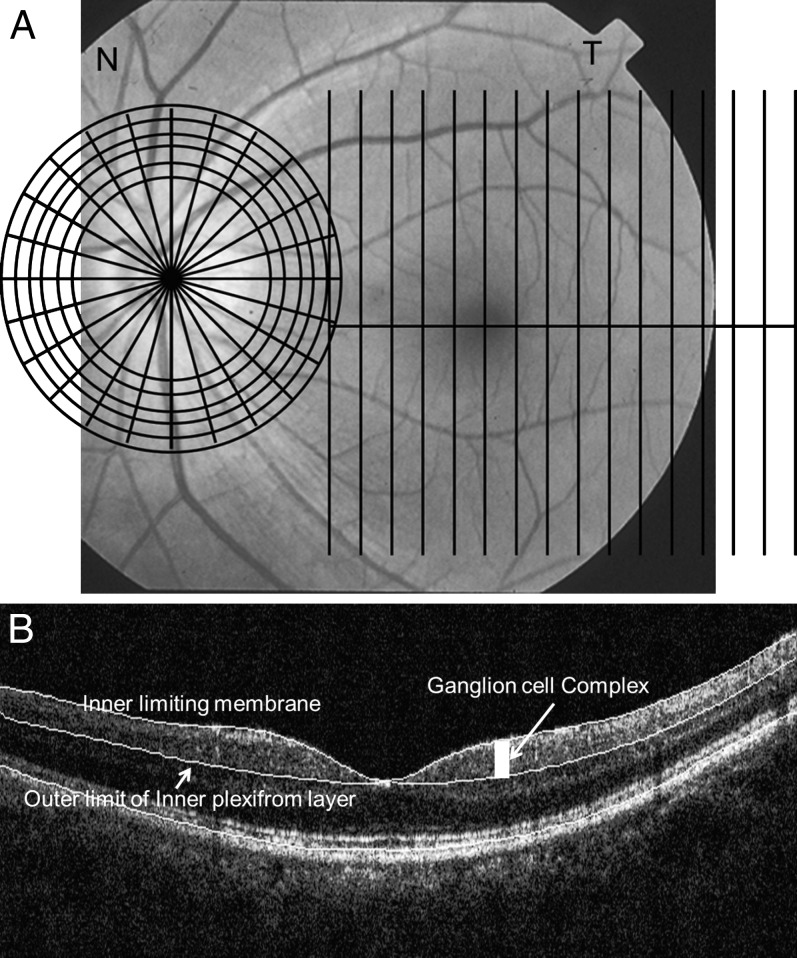
Twenty-seven patients were scanned with an FD-OCT instrument (RTVue, v. 3.0; Optovue, Inc., Fremont, CA), used for image acquisition. The GCC and ONH scan patterns were used (Fig. 1). The GCC scan covered a 7 × 7 mm rectangular area of the macula centered 0.75 mm temporal to the fixation point.10 The ONH scan was a combination of radial and circular scans and covered the optic disc and surrounding region.11 Each eye was scanned three times for the ONH scan and once for the GCC scan. The OCT images were exported and reviewed by coauthor Tan. Images with signal strength index (SSI) less than 42 were excluded. Images with inaccurate fixation or the retina out of view were also excluded. The images were then analyzed by automated image-processing software developed by coauthor Tan to obtain GCC and NFL maps. The image-processing software is similar to the software (RTVue, v. 4.0) derived from coauthor Tan's software. Details of the software were described in our previous publication.8,11 Briefly, the maximum gradient of intensity was used to detect the boundaries of retinal layers. Neighbor constraint and a knowledge model were used to classify the boundaries. The inner limiting membrane (ILM) and outer NFL boundary were detected for the ONH scan. The outer limit of the inner plexiform layer (IPL) boundary and ILM were detected for the GCC scan. We used our custom software rather than commercial software to directly access point-by-point map data and perform efficient batch processing. Because the algorithm in the commercial software was adapted from our custom software, the same results can be obtained using commercial software.
Figure 1.
(A) The GCC and ONH scan patterns. The GCC scans consisted of 15 vertical line scans covering a 7 × 7 mm rectangular area temporal to fixation. The ONH scan patterns consisted of radial and circular scans on and around the ONH. The patterns were overlaid on a fundus photograph of a left eye. (B) OCT image overlaid with detected boundaries for GCC scan.
Nerve Fiber Layer Map
The NFL thickness map was generated from the six circular scans around the disc in the ONH scan pattern. A thickness profile was calculated from each circular scan. The NFL map was then calculated by interpolation between the circular scans. The map spanned the 2.5 - 4.0-mm annulus covered by the six rings. Three NFL thickness maps were averaged from three repeated scans for each eye in this study.
Ganglion Cell Complex Map
The GCC thickness was measured between the ILM and the outer boundary of the IPL. The macular GCC thickness maps were interpolated from the 15 thickness profiles of 15 vertical line scans in the GCC scan pattern. The 1.5-mm-diameter foveal area was excluded from the map because the GCC was absent or too thin in this central region. The region outside the 6-mm-diameter circle was also cropped because the peripheral retina was not reliable.
Normative Reference
For normal references, we used data from the University of Southern California Clinical Study Center of Advance Image for Glaucoma (AIG) Study. Briefly, the normal subjects were between 40 and 79 years of age, had no family history of glaucoma, and were normal based on comprehensive eye examination and VFs. The detailed inclusion and exclusion criteria are available from the manual of procedures posted on the website (www.AIGStudy.net) and other published studies.8,10,12 Age-matched control subjects were selected from the normal group of the AIG study. One eye of each control subject was randomly selected for analysis. GCC and NFL maps were averaged to obtain the normal average maps. This allowed us to calculate GCC and NFL deviation maps by subtracting the normal thickness maps from the maps of interest.
Mirror-Image Display of Right Eyes
By convention, left eyes are used in all figures. Data from right eyes were left–right flipped to obtain mirror-image maps. These maps were averaged and analyzed together with data from left eyes. This process also avoids the necessity for readers to mentally flip the maps for comparison.
Statistics
Pearson's correlation coefficient (R2) was used to assess correlations between VF variables and OCT-derived variables. These variables included overall and hemispheric averages. For GCC and NFL, averaging was performed on the micrometer thickness scale with uniform weighting by area. For VF, averaging was performed on the decibel (dB) scale, with uniform weighting by measurement points. To account for multiple comparisons, P < 0.01 was used as the criterion for statistical significance. The statistical analysis was performed with a commercial toolbox program (Matlab 7.1, curve fitting toolbox v. 1.1.4 and statistic toolbox, v. 5.1; The MathWorks, Natick, MA).
Results
Thirty-one eyes from 27 patients affected with NAION were enrolled in this study. We excluded one eye from analysis because of a ptosis artifact observed in the VF. We also excluded two eyes with epiretinal membranes, one eye with macular edema, and two eyes with epiretinal membrane and macular edema found on OCT imaging. These conditions could have affected the accuracy of GCC and NFL thickness measurements. Thus 25 NAION eyes from 20 patients with valid VF and OCT measurements were analyzed. Twenty-five age-matched (61 ± 6 years [±SD]) normal eyes (68% female) were used for statistical comparison.
Demographic data of the NAION patients in the three different VF groups and the normal group are summarized in Table 1. BFL (68%) was the most common NAION group, followed by IFL (16%) and SFL (12%).
Table 1.
Characteristics of Study Subjects
|
SFL NAION |
IFL NAION |
BFL NAION |
All NAION |
Normal Control |
|
| Subjects (n) | 3 | 4 | 15 | 20* | 25 |
| Eyes (n) | 3 | 4 | 18 | 25 | 25 |
| Age ± SD (y) | 61 ± 21 | 51 ± 13 | 64 ± 13 | 61 ± 14 | 61 ± 6 |
| Female | 33% | 0% | 27% | 25% | 68% |
Two subjects had different diagnoses for left and right eyes.
The NAION subjects in the three groups had significantly thinner GCCs and NFLs compared with those of normal controls (P < 0.001, Table 2). It is notable that the GCC and NFL losses were significant in both the affected hemispheres and nominally unaffected hemispheres (i.e., superior hemispheric NFL and GCC in SFL cases; inferior hemispheric NFL and GCC in IFL cases). There was severe VF depression in the affected hemisphere and slight reduction in the less affected hemisphere.
Table 2.
Ganglion Cell Complex Thickness, Nerve Fiber Layer Thickness, and Visual Field Comparison
|
Area |
SFL |
IFL |
BFL |
Normal |
|
| GCC ± SD (μm) | Overall | 70.5 ± 6.9 | 63.9 ± 7.8 | 59.6 ± 10.6 | 95.7 ± 7.2 |
| Superior | 79.3 ± 11.8 | 50.6 ± 8.3 | 58.1 ± 12.0 | 95.6 ± 7.8 | |
| Inferior | 61.7 ± 11.3 | 77.2 ± 7.4 | 61.2 ± 10.6 | 95.9 ± 7.3 | |
| NFL ± SD (μm) | Overall | 71.8 ± 17.2 | 54.1 ± 6.6 | 44.2 ± 9.0 | 94.1 ± 9.5 |
| Superior | 87.6 ± 15.7 | 35.1 ± 6.6 | 44.2 ± 12.0 | 109.5 ± 10.2 | |
| Inferior | 56.0 ± 19.0 | 73.2 ± 10.7 | 44.3 ± 9.4 | 116.7 ± 15.1 | |
| VF TD ± SD (dB) | Overall | −9.5 ± 3.9 | −12.4 ± 5.1 | −17.5 ± 5.7 | 0 ± 1.2 |
| Superior | −16.7 ± 6.5 | −2.0 ± 2.1 | −14.9 ± 6.5 | N/A | |
| Inferior | −2.2 ± 2.8 | −22.7 ± 8.2 | −20.0 ± 9.5 | N/A |
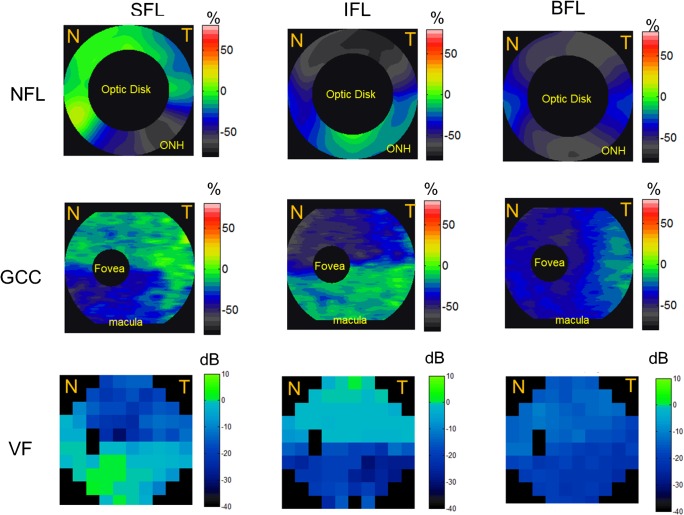
NAION eyes with superior VF defects had greater loss of NFL and GCC in the inferior hemisphere (Table 2), as expected. Similarly, NAION eyes with inferior VF defects had greater loss of NFL and GCC in the superior hemisphere. This pattern of neural tissue loss could be visualized on vertical cross-sectional OCT images of the macula (Fig. 2) and on the averaged NFL and GCC maps of the SFL and IFL eyes (Fig. 3).
Figure 2.
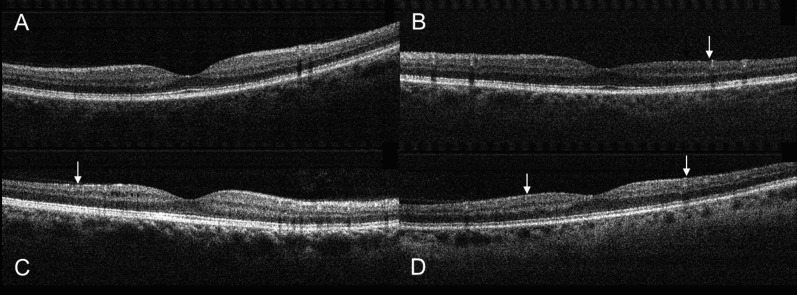
Vertical OCT scans centered on the fovea. (A) A normal eye. (B) An eye with SFL showed inferior thinning (arrow) of the GCC. (C) An eye with IFL showed superior GCC thinning (arrow). (D) An eye with BFL showed both superior and inferior GCC thinning (arrows). The examples shown were randomly picked from the three groups.
Figure 3.
The average NFL, GCC, and VF loss patterns in the SFL, IFL, and BFL groups. SFL eyes demonstrated more loss of NFL and GCC in the inferior hemisphere and vice versa. Top row: NFL. Middle row: GCC. Bottom row: VF loss pattern. Left column: SFL group. Middle column: IFL group. Right column: BFL group. NFL loss map is around the 4-mm region of the optic disc, the GCC loss map covers the 7-mm macula region, and VF covers both ONH and macula nasal (N) and temporal (T) areas. Undefined regions of GCC loss, NFL loss, and VF were marked in black. Red and orange corresponded to GCC and NFL thickening; green corresponded to no loss; and blue and gray corresponded to GCC and NFL loss.
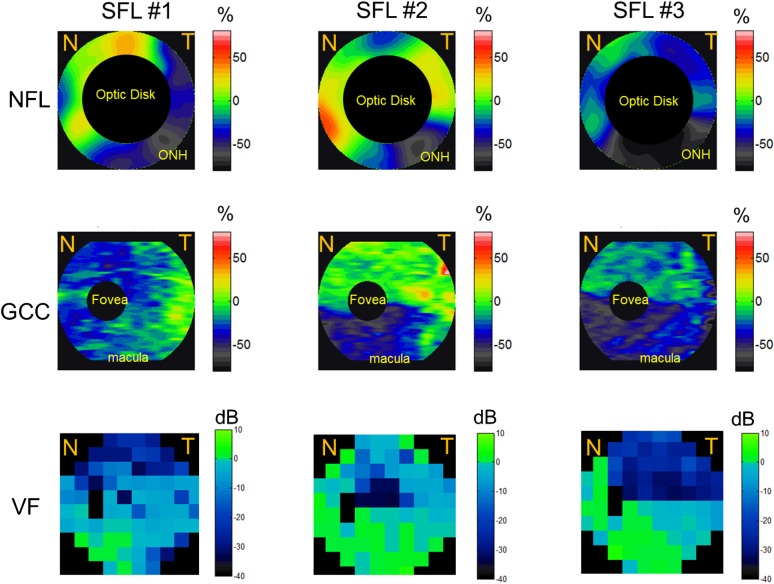
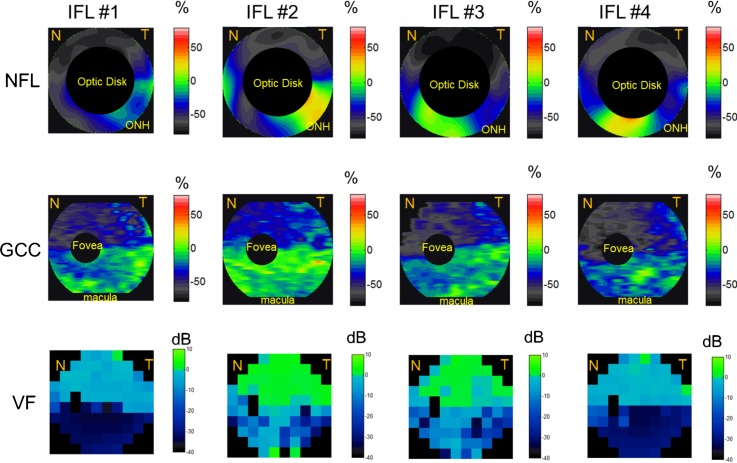
Most of the individual altitudinal field loss cases (both SFL and IFL) showed good point-to-point correspondence between NFL and GCC thinning and VF loss (Figs. 4, 5). In the SFL cases (Fig. 4), two of the three showed an inferior altitudinal (hemispheric) GCC loss pattern. The NFL loss was also predominantly in the inferior hemisphere in the same two cases, but there appeared to be sparing of the inferonasal losses. In the single SFL case that showed bihemispheric NFL and GCC losses (Fig. 4, left panels), the VF also showed small areas of inferior defects. In the IFL cases (Fig. 5), all four showed superior altitudinal GCC loss patterns. The NFL loss was predominantly in the superior hemisphere of all four cases. However, there was crossover inferonasal NFL damage in two of the four IFL cases. In the BFL cases, severe NFL thinning was present at the superior and inferior poles (Fig. 3), with relative sparing of losses nasally and temporally.
Figure 4.
The NFL, GCC, and VF loss patterns of the three eyes with SFL. SFL eyes showed NFL and GCC loss predominantly in the inferior hemisphere. The NFL loss map is around the 4-mm region of the optic disc, the GCC loss map covers the 7-mm macula region, and VF covers both ONH and macula nasal (N) and temporal (T) areas. Undefined regions of GCC loss, NFL loss, and VF were marked in black. Red and orange corresponded to GCC and NFL thickening; green corresponded to no loss; and blue and gray corresponded to GCC and NFL loss.
Figure 5.
The NFL, GCC, and VF loss patterns of all four eyes with IFL. IFL eyes showed NFL and GCC loss predominantly in the inferior hemisphere. The NFL loss map is around the 4-mm region of the optic disc, the GCC loss map covers the 7-mm macula region, and VF covers both ONH and macula nasal (N) and temporal (T) areas. Undefined regions of GCC loss, NFL loss, and VF were marked in black. Red and orange corresponded to GCC and NFL thickening; green corresponded to no loss; and blue and gray corresponded to GCC and NFL loss.
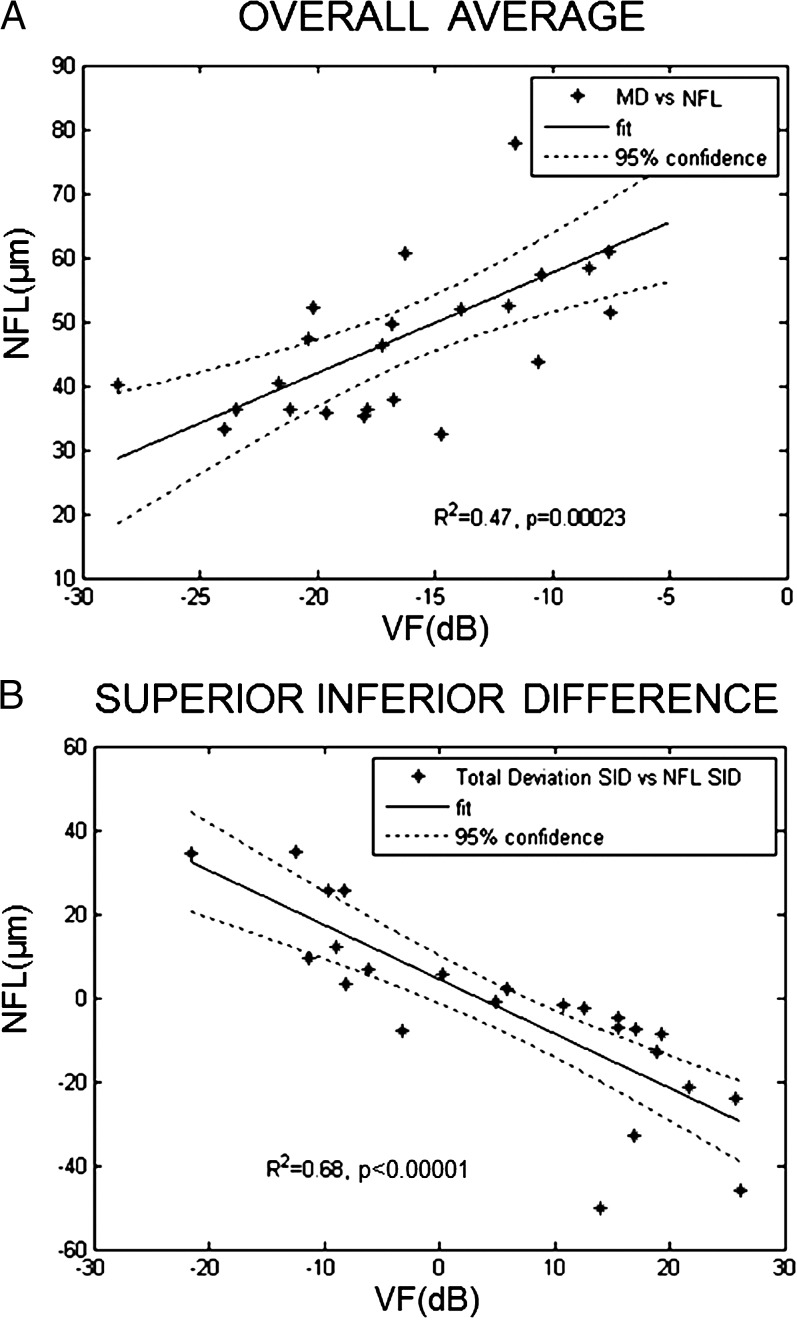
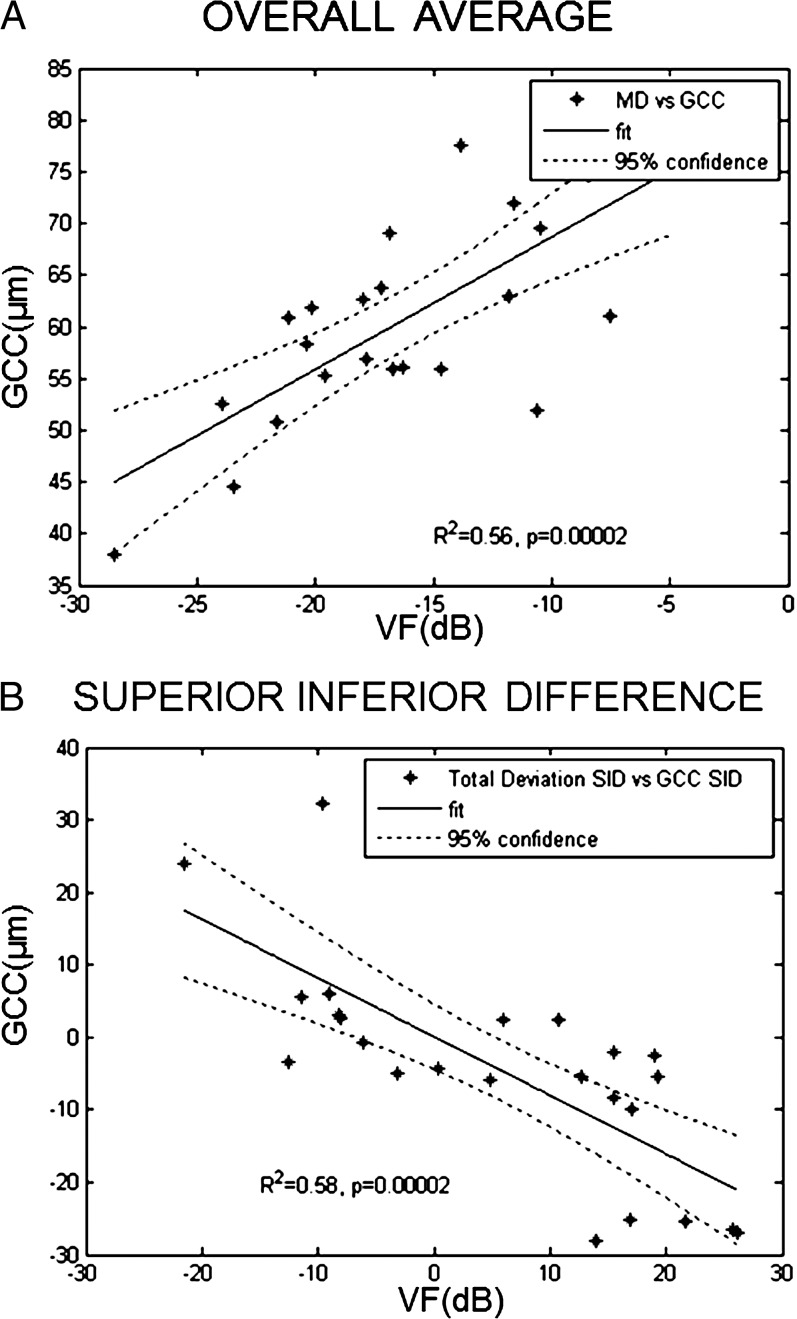
There was a high degree of correlation between VF and NFL thickness in terms of both overall average and superior–inferior hemispheric differences (Fig. 6). Similarly, there was a high degree of correlation between VF and GCC thickness in terms of both overall average and superior–inferior hemispheric differences (Fig. 7).
Figure 6.
Correlation between NFL thickness and VF. (A) Mean deviation (MD) of VF test with average NFL thickness. (B) Superior–inferior difference (SID) of total deviation of VF test with SID of NFL thickness. For both MD and SID, there was a high degree of correlation between NFL thickness and VF.
Figure 7.
Correlation between GCC thickness and VF. (A) MD of VF test with average GCC thickness. (B) SID of total deviation of VF test with SID of GCC thickness. For both MD and SID, there was a high degree of correlation between GCC thickness and VF.
Discussion
The present study used FD-OCT to delineate the NFL and GCC loss patterns in NAION. The NFL and GCC loss maps of both SFL and IFL groups showed good correlation with VF loss. The GCC maps showed excellent point-to-point correspondence with VF loss in six of seven cases of altitudinal VF loss. This is to be expected given that ganglion cell function is tightly linked to vision by anatomic location. Thus, the classic teaching that altitudinal VF loss pattern is characteristic of NAION13 can now be extended to the GCC. To our knowledge, this is the first demonstration of a clear pattern of altitudinal GCC loss in NAION.
Although a clear altitudinal pattern of GCC loss could be seen in almost all cases with altitudinal VF loss, the less affected hemisphere also showed a milder degree of GCC thinning. NFL maps also often showed small areas of loss in the less affected hemisphere. The NFL and GCC losses in the less affected hemisphere were statistically significant in both IFL and SFL cases. This suggests that ischemia and structural damage in NAION often crosses the hemispheric divide, even if the VF pattern appears altitudinal. The VF loss in the less affected hemisphere can also be appreciated in the averaged VF map (Fig. 3) and hemispheric averages (Table 2).
The NFL loss patterns in NAION are more complex than the GCC patterns. It was common in SFL cases for there to be sparing of losses in the inferonasal NFL, and in IFL cases to have inferonasal NFL loss. This does not contradict the altitudinal VF patterns because the nasal retinal nerve fibers serve only a very small nasal area tested on the 30-2 VF test. Because NAION is a watershed infarct,6 the NFL pattern suggests that the vascular watershed is actually not at the horizontal midline nasally, but is located in the inferonasal quadrant. The temporal watershed is more reliably close to the horizontal midline.
In bihemispheric cases, the NFL damage was most severe at the superior and inferior poles, with relative sparing of losses temporally and nasally. This may mean that the superior and inferior poles have a more complete infarct or are more susceptible to ischemic damage. One possible anatomic explanation is that the nerve fiber bundles are more crowded at the superior and inferior poles of the ONH due to the arcuate distribution of fibers nasally as well as temporally. The more tightly packed fibers superiorly and inferiorly may be more susceptible to the malignant positive feedback loop between ischemia and swelling.7,14
Retinal NFL loss in NAION has been studied previously by various methods such as scanning laser polarimetry by Saito et al.15 and Danesh-Meyer et al.16 or by postmortem analysis in three NAION patients by Quigley et al.4 The OCT pattern of NFL loss in NAION has also been documented.7,16–18 Alasil et al.11 reported a complete map of NFL losses in both hemispheres as well as quadrant and octant divisions of the peripapillary region and compared it with controls. They also observed a thinner NFL in NAION compared with the controls and correlation between the severity of VF loss and peripapillary NFL loss as did Danesh-Meyer et al.16 and Hood et al.17 Our study is in agreement with these previous observations and shows a significant correlation between the severity and location of visual field loss in NAION.
Our study is limited by the small sample size. Larger studies are needed to better determine the anatomic basis of the vascular watershed infarct and the sensitivity and specificity of GCC loss pattern for the diagnosis of NAION.
In summary, FD-OCT of NAION patients showed that GCC and NFL loss patterns correlated well with VF maps. Altitudinal GCC loss could be a characteristic diagnostic feature of NAION. The pattern of NFL loss is more complex and variable than GCC loss. In altitudinal cases, NFL loss tended to show demarcation between severe and mildly affected areas at the temporal horizontal midline and at some locations in the inferonasal quadrant. However, to the extent that GCC loss is more precise and specific, FD-OCT scanning of the macular GCC may contribute to the clinical diagnosis as well as characterization of NAION.
Footnotes
Supported in part by National Eye Institute Grant R01 EY-013516; an Optovue, Inc. grant; and an unrestricted grant from Research to Prevent Blindness, Inc., New York, New York.
Disclosure: D. Aggarwal, None; O. Tan, Optovue (F, R), P; D. Huang, Optovue (F, C, R), P; A.A. Sadun, None
References
- 1. Johnson LN, Arnold AC. Incidence of nonarteritic and arteritic anterior ischemic optic neuropathy. Population-based study in the state of Missouri and Los Angeles County, California. J Neuroophthalmol. 1994; 14: 38– 44. [PubMed] [Google Scholar]
- 2. Hattenhauer MG, Leavitt JA, Hodge DO, Grill R, Gray DT. Incidence of nonarteritic anterior ischemic optic neuropathy. Am J Ophthalmol. 1997; 123: 103– 107. [DOI] [PubMed] [Google Scholar]
- 3. Levin LA, Louhab A. Apoptosis of retinal ganglion cells in anterior ischemic optic neuropathy. Arch Ophthalmol. 1996; 114: 488– 491. [DOI] [PubMed] [Google Scholar]
- 4. Quigley HA, Miller NR, Green WR. The pattern of optic nerve fiber loss in anterior ischemic optic neuropathy. Am J Ophthalmol. 1985; 100: 769– 776. [DOI] [PubMed] [Google Scholar]
- 5. Knox DL, Kerrison JB, Green WR. Histopathologic studies of ischemic optic neuropathy. Trans Am Ophthalmol Soc. 2000; 98: 202– 221. [PMC free article] [PubMed] [Google Scholar]
- 6. Tesser RA, Niendorf ER, Levin LA. The morphology of an infarct in nonarteritic anterior ischemic optic neuropathy. Ophthalmology. 2003; 110: 2031– 2035. [DOI] [PubMed] [Google Scholar]
- 7. Bellusci C, Savini G, Carbonelli M, Carelli V, Sadun AA, Barboni P. Retinal nerve fiber layer thickness in nonarteritic anterior ischemic optic neuropathy: OCT characterization of the acute and resolving phases. Graefes Arch Clin Exp Ophthalmol. 2008; 246: 641– 647. [DOI] [PubMed] [Google Scholar]
- 8. Tan O, Chopra V, Lu AT, et al. Detection of macular ganglion cell loss in glaucoma by Fourier-domain optical coherence tomography. Ophthalmology. 2009; 116: 2305– 2314. [DOI] [PMC free article] [PubMed] [Google Scholar]
- 9. Feldon SE, Levin L, Scherer RW, et al. Development and validation of a computerized expert system for evaluation of automated visual fields from the Ischemic Optic Neuropathy Decompression Trial (Abstract). BMC Ophthalmol. 2006; 6: 34. [DOI] [PMC free article] [PubMed] [Google Scholar]
- 10. Tan O, Li G, Lu AT, Varma R, Huang D. Mapping of macular substructures with optical coherence tomography for glaucoma diagnosis. Ophthalmology. 2008; 115: 949– 956. [DOI] [PMC free article] [PubMed] [Google Scholar]
- 11. Alasil T, Tan O, Lu AT, Huang D, Sadun AA. Correlation of Fourier domain optical coherence tomography retinal nerve fiber layer maps with visual fields in nonarteritic ischemic optic neuropathy. Ophthalmic Surg Lasers Imaging. 2008; 39: S71– S79. [DOI] [PMC free article] [PubMed] [Google Scholar]
- 12. Tan O, Chopra V, Lu AT, et al. Detection of macular ganglion cell loss in glaucoma by Fourier-domain optical coherence tomography. Ophthalmology. 2009; 116: 2305– 2314. [DOI] [PMC free article] [PubMed] [Google Scholar]
- 13. Scherer RW, Feldon SE, Levin L, et al. Visual fields at follow-up in the Ischemic Optic Neuropathy Decompression Trial: evaluation of change in pattern defect and severity over time. Ophthalmology. 2008; 115: 1809– 1817. [DOI] [PMC free article] [PubMed] [Google Scholar]
- 14. Sadun AA, Wang MY. Abnormalities of the optic disc. Handb Clin Neurol. 2011; 102: 117– 157. [DOI] [PubMed] [Google Scholar]
- 15. Saito H, Tomidokoro A, Tomita G, Araie M, Wakakura M. Optic disc and peripapillary morphology in unilateral nonarteritic anterior ischemic optic neuropathy and age- and refraction-matched normals. Ophthalmology. 2008; 115: 1585– 1590. [DOI] [PubMed] [Google Scholar]
- 16. Danesh-Meyer HV, Carroll SC, Ku JY, et al. Correlation of retinal nerve fiber layer measured by scanning laser polarimeter to visual field in ischemic optic neuropathy. Arch Ophthalmol. 2006; 124: 1720– 1726. [DOI] [PubMed] [Google Scholar]
- 17. Hood DC, Anderson S, Rouleau J, et al. Retinal nerve fiber structure versus visual field function in patients with ischemic optic neuropathy. A test of a linear model. Ophthalmology. 2008; 115: 904– 910. [DOI] [PMC free article] [PubMed] [Google Scholar]
- 18. Contreras I, Noval S, Rebolleda G, Munoz-Negrete FJ. Follow-up of nonarteritic anterior ischemic optic neuropathy with optical coherence tomography. Ophthalmology. 2007; 114: 2338– 2344. [DOI] [PubMed] [Google Scholar]


