

Abstract
A central premise in systems pharmacology is that structurally similar compounds have similar cellular responses; however, this principle often does not hold. One of the most widely used measures of cellular response is gene expression. By integrating gene expression data from Library of Integrated Network-based Cellular Signatures (LINCS) with chemical structure and bioactivity data from PubChem, we performed a large-scale correlation analysis of chemical structures and gene expression profiles of over 11,000 compounds taking into account confounding factors such as biological conditions (e.g., cell line, dose) and bioactivities. We found that structurally similar compounds do indeed yield similar gene expression profiles. There is an ∼20% chance that two structurally similar compounds (Tanimoto Coefficient ≥ 0.85) share significantly similar gene expression profiles. Regardless of structural similarity, two compounds tend to share similar gene expression profiles in a cell line when they are administrated at a higher dose or when the cell line is sensitive to both compounds.
Study Highlights
WHAT IS THE CURRENT KNOWLEDGE ON THE TOPIC? ☑ A central premise in systems pharmacology is that structurally similar compounds have similar biological responses, yet this principle often does not hold. • WHAT QUESTION DID THIS STUDY ADDRESS? ☑ Do structurally similar compounds have similar biological responses? • WHAT THIS STUDY ADDS TO OUR KNOWLEDGE ☑ Structurally similar compounds do indeed yield similar gene expression profiles; however, the correlation between chemical structure and gene expression highly depends on biological conditions and bioactivities. There is an ∼20% chance that two structurally similar compounds (Tanimoto Coefficient ≥ 0.85) share significantly similar gene expression profiles. • HOW THIS MIGHT CHANGE CLINICAL PHARMACOLOGY AND THERAPEUTICS ☑ This work paves the way to leverage over 1 million drug-induced gene expression profiles produced by LINCS, for repositioning of existing drugs or elucidation of the mechanism of action.
A central goal of systems pharmacology is to understand the mechanism of biological systems by their response to molecules. One major tenet that structurally similar molecules have similar biological responses is widely exploited. Examples include the creation of structurally diverse compound libraries for high-throughput screening.1 However, the premise may not hold due to the involvement of complex biological processes, the high dimensional nature of the biological activity landscape, or the way of computing similarities.2,3 For example, the two diabetes drugs rosiglitazone and troglitazone possess very similar structures, but they exert different side effects: rosiglitazone may increase the risk of cardiovascular events4 while troglitazone may lead to drug-induced hepatitis.5
Due to the advances of genomics and high-throughput technologies, a recent trend has evolved to measure chemical similarity using biological response data (e.g., bioactivity and phenotypic data) in addition to structure data. The biological fingerprints composed either by binding affinities against a panel of proteins or by inhibition rates against a panel of cell lines and assays have been used to relate molecules.6–8 Drug side effect similarity has been also employed to predict drug targets.9 The combination of similarities based on multiple structural, biological, and phenotypic features has led to the discovery of new drug indications.10 The correlation between chemical structures and other biological/phenotypic features has been explored as well.11–14
One critical way to assess chemical similarity is to examine the similarity of cellular response upon compound treatment. Gene expression profiling is one of the most widely used techniques in the characterization of cellular response. It has been intensively employed to understand drug mechanism, identify drug targets, and find new uses for existing drugs.10,15–17 Structurally similar compounds tend to interact with similar proteins. It has been shown that there is a 30% chance that a compound that is ≥0.85 (Tanimoto coefficient (TC)) similar to an active compound is itself active.1 However, it remains unanswered as to whether their gene expression is changed similarly after additional biological processes take place. In addition, gene expression profiles are very sensitive to biological conditions (e.g., cell line, dose, and treatment duration).18,19 Relating compound structure and gene expression may help understand the mechanism of drug action at cellular levels and gain a better understanding of the biological systems.
Due to the high cost of measuring gene expression experimentally, large-scale expression profiling of chemical compounds under a wide range of biological conditions remains challenging. Inferring gene expression by leveraging structural features may overcome the challenge. One approach to inferring gene expression relies on using gene expression data of a structurally similar compound as a proxy for the gene expression profile of the compound, or using gene expression data collected under a different biological condition as a proxy for the gene expression profile of the compound under the biological condition in question.12,15,20 But the foremost question that we address is whether structure-based similarity (referred to as structural similarity) correlates with gene expression-based similarity (referred to as transcriptomic similarity) across a large number of compounds and biological conditions.
The recent effort on the large-scale creation of the National Institutes of Health (NIH)-funded Library of Integrated Network-based Cellular Signatures (LINCS) offers an unprecedented opportunity to connect and compare compound structure and gene expression. LINCS contains gene expression profiles measured upon treatment with >11,000 compounds on 10 or more cell lines. The increasing gene expression profiles provided by LINCS are actively explored to understand drug action.21–24 A set of 1,000 landmark genes were selected for profiling in LINCS, and their expression measurements can be used to infer expression of the rest of the genome. PubChem is a publicly available repository for chemical compounds and their bioactivities across thousands of assays.25 By integrating gene expression data from LINCS with compound structure and bioactivity data from PubChem, we performed a comprehensive correlation analysis of chemical structures and gene expression profiles taking into account confounding factors such as biological conditions (e.g., cell line, dose, treatment duration), physical properties, and bioactivities.
METHODS
Datasets
A full matrix composed by 476,251 signatures and 22,268 genes including 1,000 landmark genes was downloaded from the LINCS website (http://www.lincscloud.org/) as of September 2013. The meta-information of the signatures (e.g., cell line, treatment duration, dose) was retrieved via the LINCS Application Program Interfaces (APIs) (http://api.lincscloud.org/a2/). Chemical structures, physical properties, and bioactivities were retrieved from PubChem. The details of data collection and processing are provided in the Supplemental Material.
Similarity measures
Structural similarities of compound pairs were computed using the ChemAxon packages (Supplementary Material). Fingerprints Extended Connectivity Fingerprint 4 (ECFP4)26 and Pharmacophore Fingerprint (PFP)27 were used separately. Transcriptomic similarities of perturbagen pairs were measured by Spearman correlation coefficient and Pearson correlation coefficient of their gene expression profiles. Correlations were converted into P values, followed by the Benjamini-Hochberg's correction for multiple hypothesis testing. Both landmark genes and the whole genome were analyzed separately. For those perturbagen pairs where one of the compounds has multiple profiles due to multiple experiments (e.g., different batches, cell lines, doses, or treatment durations), these profiles were treated individually, leading to multiple pairs of profiles.
We grouped structural similarity at 0.5 intervals. For example, the group labeled by structural similarity as 1 includes all the pairs with TC = 1, and the group labeled by structural similarity as 0.95 includes all the pairs with TC ≥ 0.95 and TC < 1. Within each group the mean of the transcriptomic similarities of all the pairs of profiles was computed. The groups with the total number of pairs less than 30 were ignored.
Fraction of transcriptomic similar pairs
The transcriptomic similarities of all the possible pairs were computed and their P values were corrected. We first identified transcriptomic similarity pairs with adjusted P < 0.01 and found that 19% of all the pairs are significantly similar. According to this criterion, any random pair has a high chance (19%) to be significantly similar. We thus further fitted the similarities of all the pairs to a normal distribution, from which a significant similarity cutoff is computed (P < 0.01). The significantly similar pairs were those with similarity higher than the significant cutoff and corrected P < 0.01. Provided a structural similarity, the fraction of transcriptomic similar pairs is the ratio between the total number of significantly similar pairs and the total number of pairs. The ratio indicates a chance that two compounds share significantly similar gene expression profiles.
Statistics
Unless otherwise specified, Spearman correlation was used to compute correlation. A two-sided t-test was used to compute the difference between two groups. The 95% confidence interval was used to present the correlations.
RESULTS
Two distinct compounds were paired up if both were tested under the same condition (i.e., same cell line, treatment duration, dose). The workflow and one example for the pair of testosterone and medroxyprogesterone are shown in Figure 1a,b and the similarity measures are shown in Figure 1c. In total, 6,855,476 pairs consisting of 11,016 distinct compounds were identified. In addition, we paired up replicates of the same compound. The replicates can be those profiled either in the same plates or in different plates. In total, we collected 53,800 pairs of replicates, out of which there were 448 pairs, in which the replicates of each pair came from the same plate.
Figure 1.
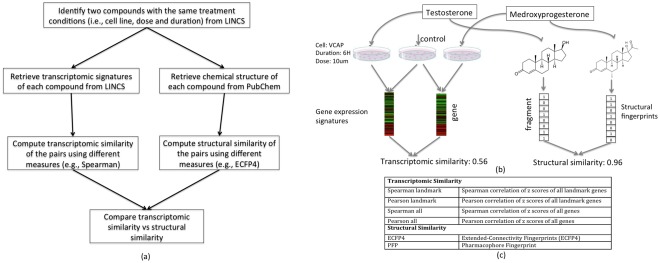
(a) Workflow of comparing transcriptomic similarity and structural similarity; (b) an example of comparing structural similarity and transcriptomic similarity between testosterone and medroxyprogesterone; (c) similarity measures.
The transcriptomic similarity of a pair of compounds is computed as the correlation of the gene expression profiles of the two compounds under the same conditions. As only 1,000 landmark genes are profiled for expression in LINCS, we separately tested the effect of inferred expression of the remaining genes. Structural similarity was computed as the TC between the fingerprints of two compounds. The transcriptomic similarity was normally distributed ranging between −1 and 1, while the structural similarity was skewed on the right ranging between 0 and 1 (Supporting Figure S1).
Correlations between transcriptomic and structural similarity
We computed correlations between structural similarity and transcriptomic similarity of all the pairs using different similarity measures. The best overall correlation coefficient is 0.026 when ECFP4 and Pearson of landmark genes are used. This is consistent with previous findings.12 However, when we grouped the pairs according to their structural similarity, and averaged their transcriptomic similarity within each group, we observed a clear trend that the group with higher structural similarity tends to have higher transcriptomic similarity (Figure 2a). We also noticed that within the same structural similarity, using landmark genes leads to higher transcriptomic similarity than using the imputed whole genome, and using Pearson correlation yields higher transcriptomic similarity than using Spearman correlation. We did not notice any superior measure regarding structural similarity. In the following analysis, ECFP4 and Pearson correlation of landmark genes are the default similarity measures for structural similarity and transcriptomic similarity, respectively.
Figure 2.

Structural similarity vs. transcriptomic similarity. The pairs are grouped according to their structural similarities. (a) The mean of transcriptomic similarity within each group is plotted. The groups with the number of pairs less than 30 are ignored. (b) The distribution of transcriptomic similarity within each group is plotted. ECFP4 and Pearson landmark are used for measuring structural and transcriptomic similarity, respectively.
When two distinct compounds are structurally identical (TC = 1), the transcriptomic similarity using Pearson correlation of landmark genes reaches a correlation value of 0.37 ± 0.004 (range −0.56 to 0.97). When structural similarity is less than 0.75 (TC < 0.75), transcriptomic similarity becomes flat, with average values less than 0.11 (Figure 2a). This indicates that structural similarity does not correlate with transcriptomic similarity when two compounds are not structurally similar (e.g., TC < 0.75), regardless of the similarity measures used. We found that the variation of transcriptomic similarity within each group is large, with average standard deviation 0.21 (Figure 2b).
Biological conditions as confounding factors
Gene expression changes are highly dependent on biological conditions; hence, we examined the correlations between compound structure and gene expression under different biological conditions. The most relevant conditions are cell line, dose, and treatment duration. The pairs of compounds were observed in five primary cell lines (i.e., MCF7 (20.0%), VCAP (16.8%), PC3 (13.4%), A549 (12.6%), HA1E (8.9%)), with two primary doses (i.e., 10 μm (97.0%) and 5 μm (2.3%)) and with two primary treatment durations (i.e., 24 hours (46.8%), and 6 hours (53.2%)) (Figure S2). Within each condition (e.g., cell line MCF7), we only kept the pairs complying with that condition and further assessed the correlation between structural similarity and transcriptomic similarity.
The trend that compounds with higher structural similarity tend to have higher transcriptomic similarity still holds when we examine individual cell lines (Figure 3a). Interestingly, some cell lines exhibit very different patterns. For example, any two compounds, regardless of their structural similarity, tend to have higher transcriptomic similarity in PC3 cells than in VCAP cells (two-sided t-test, P < 0.01). Both cell lines are actually prostate-related cancer cell lines. When structural similarity is 1, the transcriptomic similarity is 0.49 ± 0.009 and 0.31 ± 0.008 in PC3 and in VCAP, respectively, while when structural similarity is relaxed to 0.95, transcriptomic similarity drops to 0.47 ± 0.02 in PC3, and to 0.18 ± 0.01 in VCAP. This indicates two structurally similar compounds are likely to share more similar gene expression profiles in PC3 than in VCAP.
Figure 3.

Structural similarity vs. transcriptomic similarity across (a) cell lines, (b) doses, and (c) treatment durations. ECFP4 and Pearson landmark are used for measuring structural and transcriptomic similarity, respectively.
The positive relationship between structural and transcriptomic similarity holds under different doses; however, when two structurally similar compounds (TC ≥ 0.85) are administered at a higher dose (i.e., 10 μm), they tend to have higher transcriptomic similarity than at a lower dose (i.e., 5 μm), regardless of the cell lines used (P < 1E-16) (Figure 3b). No explicit difference was observed when two compounds were administered for different treatment durations (Figure 3c).
Compound physical properties and bioactivities as confounding factors
In addition to the biological conditions, the properties of the compounds themselves obviously will affect the correlations between compound structure and gene expression. It is possible that two chemotherapy drugs may induce the same apoptosis pathway, leading to similar gene expression changes, regardless of their chemical structure similarity. By contrast, it is also possible that treatment with two structurally similar chemical compounds with slightly different bioavailability may result in vastly different gene expression changes. We therefore quantitatively examined the effect of physical properties and bioactivities on the correlations.
We first found that the “Rule of Five” properties do not affect the correlation between structural similarity and transcriptomic similarity (Supplementary Figures S3, S4). We next examined the effect of bioactivities. Compound bioactivity or cytotoxicity, which is measured by its growth inhibition, has been previously tested in the NCI human tumor cell line growth inhibition assays. Compounds with logarithm of concentration required for 50% inhibition of growth (LogGI50) less than −6 are considered active. Three cell lines (MCF7, PC3, and A549) that have the most number of compounds with activity and gene expression data were selected for further analysis. In each cell line, the compounds were grouped based on their bioactivity (see Methods). The heatmap in Figure 4a illustrates the gene expression changes in MCF7 for 6 hours at 10 μm concentration, and bioactivity of the compounds tested in MCF7. The compounds are linked if their structures are similar (TC ≥ 0.85). We observed that active compounds tend to cluster together based on their gene expression regardless of structural similarity. We also observed similar patterns in PC3 (Figure S5a) and A549 (Figure S5b). In addition, active compounds have larger expression changes than inactive compounds (MCF7: P = 1.2E-32, PC3: P = 5.0E-6, A549: P = 2.0E-17) (Figure 4b). We further paired up the compounds into three groups based on their bioactivity: both are active, one of them is active, and neither of them are active. In each cell line, the pairs where both compounds are active significantly possess higher transcriptomic similarity (MCF7: P < 1E-200, PC3: P < 1E-200, A549: P < 1E-200) (Figure 4c). Taken together, bioactivity is a critical factor responsible for transcriptomic similarity.
Figure 4.

(a) Expressions of landmark genes with different chemical perturbations in MCF7 with 6 hours treatment at 10 μm concentration. In the heatmap, each row is one landmark gene and each column is one compound colored by bioactivity in MCF7. Bioactivity is measured by the growth inhibition rate in MCF7. Green color represents active compounds and blue color represents inactive compounds. Red color shows high expression and blue color shows low expression in the heatmap. (b) Variation of gene expressions for active compounds and inactive compounds in MCF7, PC3, and A549. Variation is measured as the interquartile range of expression of landmark genes. (c) Transcriptomic similarity of the pairs consisting of two active compounds, the pairs consisting of two inactive compounds, and the pairs consisting of one inactive and one active compound. Three cell lines—MCF7, PC3, and A549—are used.
How frequently do structurally similar compounds have similar gene expression profiles?
One simple question we often ask is whether it is reasonable to use the gene expression data from one compound as a proxy for that of another structurally similar compound. In addition to understanding the correlation between structural similarity and transcriptomic similarity, it is important to quantify how likely the gene expression profiles of two compounds are significantly similar given their structural similarity. To answer this question, we first need to define structurally similar pairs and pairs of compounds that are significantly similar by their gene expression. As suggested by others,1 we define pairs of compounds with TC ≥ 0.85 as structurally similar pairs. We defined the pairs with significant transcriptomic similarity based on the distribution of the transcriptomic similarity of all the pairs (see Methods). The chance of sharing similar transcriptomic profiles is ∼41% for two structurally identical compounds (TC = 1) (Figure S6a). We found that when two compounds are structurally similar (TC ≥ 0.85), there is about a 20% chance that their transcriptomic profiles are significantly similar. The chance varies as the biological condition changes (Figure S6b–d). For example, when two structurally similar compounds (TC ≥ 0.85) are tested in PC3, there is a 33% chance that they share similar transcriptomic profiles, while the chance is 9% in VCAP.
Unexpected pairs that do not follow the trend
Given the large variation of gene expression profiles, we further examined the pairs of compounds that do not follow the structure-gene expression correlation. They include structurally similar compounds with dissimilar transcriptomic profiles or structurally dissimilar compounds with similar transcriptomic profiles.
A list of such “unexpected pairs” is presented in Figure 5. For example, the two structurally identical compounds pancuronium and vecuronium (TC = 1) are competitive nicotinic antagonists but exert opposite transcriptomic responses (Cor = −0.14, P < 0.01) under the same condition (cell line: PC3, dose: 10 μm, time: 6 hours) (Figure 5a). Gene annotation enrichment analysis27 of differentially expressed genes between the two compounds identifies different mechanisms of actions: pancuronium regulates immune response and mitochondrial-related genes, while vecuronium regulates oxidation reduction-related genes. The structurally similar pairs that exert variable gene expression profiles may be due to off-target effects, activity cliffs, technical variation, or the way of computing similarity.
Figure 5.

Gene expressions of “unexpected” pairs: (a) Pancuronium and vecuronium; (b) testosterone and norethindrone; (c) vincristine and vindesine; and (d) idarubicin and doxorubicin. In each plot, transcriptomic similarity (Cor), structural similarity (ECFP4), cell line, dose, treatment duration, and a few highly differentially expressed genes are annotated.
Interestingly, “unexpected” phenomena sometimes appears only under a specific condition. For example, two structurally similar compounds, testosterone and norethindrone (TC = 0.90), have similar profiles in VCAP (Cor = 0.50, P < 0.01), but different profiles in A375 (Cor = −0.08, P > 0.01) after 6 hours treatment at 10 μm concentration (Figure 5b). The genes (MYC, IGFBP3, SPDEF, TIPARP) are highly differentially expressed in the profiles of the two drugs in VCAP, but not in A375. These two hormones are known to exhibit different biological effects. Two structurally similar compounds, vincristine and vindesine (TC = 0.91), have similar profiles in A549 (Cor = 0.51, P < 0.01) after 24 hours treatment at 10 μm concentration, but different profiles (Cor = −0.10, P < 0.01) after 6 hours treatment at a 10 μm concentration (Figure 5c). Their target TOP2A is downregulated by the two drugs when the cell is treated for 24 hours, but the target is not affected after 6 hours treatment. Two structurally similar compounds, idarubicin and doxorubicin (TC = 0.97, have similar profiles (Cor = 0.58, P < 0.01) at 10 μm concentration but dissimilar profiles (Cor = −0.22, P < 0.01) at a lower dose, 0.041 μm in MCF7 (Figure 5d). A few genes are downregulated by the two drugs at 10 μm concentration, but they are not affected at a lower dose. Taken together, two structurally similar compounds may share similar transcriptomic profiles in a specific cell line with a specific treatment duration at a specific dose.
We also observed that some structurally dissimilar compounds share similar transcriptomic profiles. When two drugs share similar gene expression profiles, it indicates they may result in a similar physiological effect despite the differences in chemical structures; therefore, one drug might even be used as a therapeutic for the same indication as the other drug. For example, the antidepressant drug bupropion is similar to busulfan in PC3 (Cor = 0.85, P < 0.01). Since busulfan is a prostate cancer drug, it suggests that bupropion might have anticancer properties as well. A list of examples is provided in Table S1. The compounds that may hit different targets in the same pathway, or bind to different sites of the same target, are likely to share similar transcriptomic profiles. For example, the nonselective beta-blocker carvedilol and the alpha-2 selective adrenergic agonist guanabenz have very different structures (TC = 0.09) but share targets ADRA2A and ADRA2B, which may account for their similar transcriptomic profiles (Cor = 0.55, P < 0.01, HCC515 cell line, 24 hours treatment and 10 μm concentration). Two structurally dissimilar drugs, phenacetin and 4-androstenedione (TC = 0.08), share similar transcriptomic profiles (Cor = 0.53, P < 0.01, A549 cell line, 24 hours treatment, and 10 μm concentration); it is likely because PTGS1, the target of phenacetin, and AKR1C3, the target of 4-androstenedione, are both involved in the synthesis of prostaglandin and thromboxanes.
DISCUSSION
Structurally similar compounds tend to interact with similar proteins, but it remains elusive if they lead to similar gene expression changes, as biological processes take place after the interaction. In this work, we systematically examined the correlation between structural similarity and transcriptomic similarity across over 11,000 compounds tested in over 10 primary cell lines, two primary treatment durations, and two primary dose concentrations. We further assessed the effects of biological conditions, physical properties, and bioactivities on the correlation.
The overall trend that structurally similar compounds tend to have similar transcriptomic profiles is very clear regardless of the biological condition studied. When TC ≥ 0.85, there is a 20% chance that they share similar profiles. These findings are consistent with Martin et al.,1 who examined the correlation between chemical structure and biological activity, and showed that there is a 30% chance that two structurally similar compounds have similar bioactivity. As more biological processes are involved in the regulation of gene expression, it is not surprising that we observe a lower correlation with gene expression in comparison to biological activity. It should be noted that ECFP4 used in this analysis might lead to a matrix different with the Daylight Fingerprint used in their work, and the measures of transcriptomic similarity and biological activity similarity are different. Nevertheless, our work demonstrates that chemical structure is indeed related to gene expression profiles, but using chemical structure alone is inadequate to model expression changes. Even for the same compound, expression may be changed vastly as the biological condition is varied.
In addition to the analysis of the pairs consisting of distinct compounds, we further performed the analysis of 53,800 pairs of replicates, where the same compound was tested under the same condition (i.e., cell line, dose, and treatment duration). The transcriptomic similarity of those pairs is 0.63 ± 0.003 and 80% of them are significantly similar. When two compounds are structurally identical, the transcriptomic similarity and the percentage of significantly similar pairs drop to 0.32 ± 0.06 and 41%, respectively. This indicates that a small change in the chemical structure can lead to a big change of gene expression profiles. Out of the 53,800 pairs, there were 448 pairs where the replicates of each pair were profiled in the same plates. The transcriptomic similarity of those pairs is 0.64 ± 0.02. No significant difference of the transcriptomic similarity was observed between the pairs from the same plates and those from different plates, indicating that the batch effect of those pairs is subtle.
For the pairs of compounds with the same structural similarity, their transcriptomic similarity varies largely. The variation may be due to technical variation or biological variation (e.g., different cell lines, doses, treatment durations). The variation leads to a large number of “unexpected” pairs, including structurally similar compounds with dissimilar transcriptomic profiles or structurally dissimilar compounds with similar transcriptomic profiles. The latter may serve as a great source for identifying new repositioning opportunities or understanding the biological systems.
Notably, in addition to structure, other factors also account for transcriptomic similarity. For example, if the cell line is sensitive to both compounds, regardless of their structure, they tend to share similar profiles. This may be because both inhibit cancer cell growth, resulting in a similar change of cellular state. Likewise, if the cell is treated with a compound at a high dose, the cell may exhibit similar cellular change, reflected by the similar change of gene expression.
Our study has several limitations. We examined the most common similarity measures while alternative methods can be used. ECFP4 and PFP are two popular measures often used to study structural and functional similarity, separately, but some part of structural features, such as 3D conformation, are ignored. As the release of 3D structural similarities of the compounds from PubChem, it will be interesting to incorporate them in future analysis. For transcriptomic similarity, we used the landmark genes and the whole genome independently at the beginning of the analysis. We found that using landmark genes leads to higher transcriptomic similarity than using the whole genome, so we focused our analysis on the landmark genes rather than the whole genome. However, the landmark genes may not be sufficient to capture all the transcriptomic changes of some compounds. In addition, neither Spearman correlation nor Pearson correlation considers weighting individual genes, which may contribute differently to the transcriptomic similarity. We did not try to optimize similarity measures, and rather followed the conventional ways. However, as the cost of expression profiling continues to decline and new datasets become available, a more comprehensive genome-wide analysis will be feasible. Our study lays a foundation for exploring the relationship between chemical structure and gene expression changes across a large number of compounds and yields interesting insights into structural and functional relationships between therapeutic agents.
Acknowledgments
Publication of this article was funded in part by the Lucile Packard Foundation for Children's Health, the Stanford Child Health Research Institute, the Hewlett Packard Foundation, and the National Institute of General Medical Sciences (R01 GM079719). We thank ChemAxon for providing the academic license to process chemical structures.
Author Contributions. B.C., P.G., H.P., M.S., D.H., and A.B. wrote manuscript; B.C. and A.B. Designed research; B.C., P.G., H.P., and M.S. Performed research; B.C. Analyzed data.
Conflict of Interest. The authors declared no conflicts of interest.
Supporting Information
Additional Supporting Information may be found in the online version of this article.
Supporting Information
Supporting Information
Supporting Information
Supporting Information
Supporting Information
Supporting Information
Supporting Information
Supporting Information
Supporting Information
References
- Martin YC, Kofron JL. Traphagen LM. Do structurally similar molecules have similar biological activity? J. Med. Chem. 2002;45:4350–4358. doi: 10.1021/jm020155c. & ) [DOI] [PubMed] [Google Scholar]
- Stumpfe D. Bajorath J. Exploring activity cliffs in medicinal chemistry. J. Med. Chem. 2012;55:2932–2942. doi: 10.1021/jm201706b. & ) [DOI] [PubMed] [Google Scholar]
- Bender A. Glen RC. Molecular similarity: a key technique in molecular informatics. Organ. Biomol. Chem. 2004;2:3204–3218. doi: 10.1039/B409813G. & ) [DOI] [PubMed] [Google Scholar]
- Nissen SE. Wolski K. Effect of rosiglitazone on the risk of myocardial infarction and death from cardiovascular causes. N. Engl. J. Med. 2007;356:2457–2471. doi: 10.1056/NEJMoa072761. & ) [DOI] [PubMed] [Google Scholar]
- Menon KVN, Angulo P. Lindor KD. Severe cholestatic hepatitis from troglitazone in a patient with nonalcoholic steatohepatitis and diabetes mellitus. Am. J. Gastroenterol. 2001;96:1631–1634. doi: 10.1111/j.1572-0241.2001.03809.x. & ) [DOI] [PubMed] [Google Scholar]
- Fliri AF, Loging WT, Thadeio PF. Volkmann RA. Biospectra analysis: model proteome characterizations for linking molecular structure and biological response. J. Med. Chem. 2005;48:6918–6925. doi: 10.1021/jm050494g. & ) [DOI] [PubMed] [Google Scholar]
- Fliri AF, Loging WT, Thadeio PF. Volkmann RA. Biological spectra analysis: linking biological activity profiles to molecular structure. Proc. Natl. Acad. Sci. U.S.A. 2005;102:261–266. doi: 10.1073/pnas.0407790101. & ) [DOI] [PMC free article] [PubMed] [Google Scholar]
- Petrone PM, et al. Rethinking molecular similarity: comparing compounds on the basis of biological activity. ACS Chem. Biol. 2012;7:1399–1409. doi: 10.1021/cb3001028. ) [DOI] [PubMed] [Google Scholar]
- Campillos M, Kuhn M, Gavin AC, Jensen LJ. Bork P. Drug target identification using side-effect similarity. Science. 2008;321:263–236. doi: 10.1126/science.1158140. & ) [DOI] [PubMed] [Google Scholar]
- Gottlieb A, Stein GY, Ruppin E. Sharan R. PREDICT: a method for inferring novel drug indications with application to personalized medicine. Mol. Syst. Biol. 2011;7:496. doi: 10.1038/msb.2011.26. & ) [DOI] [PMC free article] [PubMed] [Google Scholar]
- Covell DG, Wallqvist A, Huang R, Thanki N, Rabow AA. Lu XJ. Linking tumor cell cytotoxicity to mechanism of drug action: an integrated analysis of gene expression, small-molecule screening and structural databases. Proteins. 2005;59:403–433. doi: 10.1002/prot.20392. & ) [DOI] [PubMed] [Google Scholar]
- Fernald GH. Altman RB. Using molecular features of xenobiotics to predict hepatic gene expression response. J. Chem. Inf. Model. 2013;53:2765–2773. doi: 10.1021/ci3005868. & ) [DOI] [PMC free article] [PubMed] [Google Scholar]
- Fliri AF, Loging WT, Thadeio PF. Volkmann RA. Analysis of drug-induced effect patterns to link structure and side effects of medicines. Nat. Chem. Biol. 2005;1:389–397. doi: 10.1038/nchembio747. & ) [DOI] [PubMed] [Google Scholar]
- Chen B, McConnell KJ, Wale N, Wild DJ. Gifford EM. Comparing bioassay response and similarity ensemble approaches to probing protein pharmacology. Bioinformatics. 2011;27:3044–3049. doi: 10.1093/bioinformatics/btr506. & ) [DOI] [PubMed] [Google Scholar]
- Iorio F, Tagliaferri R. di Bernardo D. Identifying network of drug mode of action by gene expression profiling. J. Comput. Biol. 2009;16:241–251. doi: 10.1089/cmb.2008.10TT. & ) [DOI] [PubMed] [Google Scholar]
- Qu XA. Rajpal DK. Applications of Connectivity Map in drug discovery and development. Drug Discov. Today. 2012;17:1289–1298. doi: 10.1016/j.drudis.2012.07.017. & ) [DOI] [PubMed] [Google Scholar]
- Sirota M, et al. Discovery and preclinical validation of drug indications using compendia of public gene expression data. Sci. Transl. Med. 2011;3:96ra77. doi: 10.1126/scitranslmed.3001318. ) [DOI] [PMC free article] [PubMed] [Google Scholar]
- Cheng C, et al. Understanding transcriptional regulation by integrative analysis of transcription factor binding data. Genome Res. 2012;22:1658–1667. doi: 10.1101/gr.136838.111. ) [DOI] [PMC free article] [PubMed] [Google Scholar]
- Kininis M. Kraus WL. A global view of transcriptional regulation by nuclear receptors: gene expression, factor localization, and DNA sequence analysis. Nucl. Recept. Signal. 2008;6:e005. doi: 10.1621/nrs.06005. & ) [DOI] [PMC free article] [PubMed] [Google Scholar]
- Blower PE, et al. Pharmacogenomic analysis: correlating molecular substructure classes with microarray gene expression data. Pharmacogenom. J. 2002;2:259–271. doi: 10.1038/sj.tpj.6500116. ) [DOI] [PubMed] [Google Scholar]
- Liu C, Su J, Yang F, Wei K, Ma J. Zhou X. Compound signature detection on LINCS L1000 big data. Mol. Biosyst. 2015;11:714–722. doi: 10.1039/c4mb00677a. & ) [DOI] [PMC free article] [PubMed] [Google Scholar]
- Vidovic D, Koleti A. Schurer SC. Large-scale integration of small molecule-induced genome-wide transcriptional responses, Kinome-wide binding affinities and cell-growth inhibition profiles reveal global trends characterizing systems-level drug action. Front. Genet. 2014;5:342. doi: 10.3389/fgene.2014.00342. & ) [DOI] [PMC free article] [PubMed] [Google Scholar]
- Olson DE, et al. An unbiased approach to identify endogenous substrates of “histone” deacetylase 8. ACS Chem. Biol. 2014;9:2210–2216. doi: 10.1021/cb500492r. ) [DOI] [PMC free article] [PubMed] [Google Scholar]
- Ma'ayan A, Rouillard AD, Clark NR, Wang Z, Duan Q. Kou Y. Lean Big Data integration in systems biology and systems pharmacology. Trends Pharmacol. Sci. 2014;35:450–460. doi: 10.1016/j.tips.2014.07.001. & ) [DOI] [PMC free article] [PubMed] [Google Scholar]
- Wang Y, Xiao J, Suzek TO, Zhang J, Wang J. Bryant SH. PubChem: a public information system for analyzing bioactivities of small molecules. Nucl. Acids Res. 2009;37:W623–633. doi: 10.1093/nar/gkp456. & ) [DOI] [PMC free article] [PubMed] [Google Scholar]
- Rogers D. Hahn M. Extended-connectivity fingerprints. J. Chem. Inf. Model. 2010;50:742–754. doi: 10.1021/ci100050t. & ) [DOI] [PubMed] [Google Scholar]
- Huang da W, Sherman BT. Lempicki RA. Systematic and integrative analysis of large gene lists using DAVID bioinformatics resources. Nat. Protoc. 2009;4:44–57. doi: 10.1038/nprot.2008.211. & ) [DOI] [PubMed] [Google Scholar]
Associated Data
This section collects any data citations, data availability statements, or supplementary materials included in this article.
Supplementary Materials
Supporting Information
Supporting Information
Supporting Information
Supporting Information
Supporting Information
Supporting Information
Supporting Information
Supporting Information
Supporting Information