

Abstract
Achieving sufficient concentrations of antituberculosis (TB) drugs in pulmonary tissue at the optimum time is still a challenge in developing therapeutic regimens for TB. A physiologically based pharmacokinetic model incorporating a multicompartment permeability-limited lung model was developed and used to simulate plasma and pulmonary concentrations of seven drugs. Passive permeability of drugs within the lung was predicted using an in vitro-in vivo extrapolation approach. Simulated epithelial lining fluid (ELF):plasma concentration ratios showed reasonable agreement with observed clinical data for rifampicin, isoniazid, ethambutol, and erythromycin. For clarithromycin, itraconazole and pyrazinamide the observed ELF:plasma ratios were significantly underpredicted. Sensitivity analyses showed that changing ELF pH or introducing efflux transporter activity between lung tissue and ELF can alter the ELF:plasma concentration ratios. The described model has shown utility in predicting the lung pharmacokinetics of anti-TB drugs and provides a framework for predicting pulmonary concentrations of novel anti-TB drugs.
Study Highlights
WHAT IS THE CURRENT KNOWLEDGE ON THIS TOPIC? ☑ Current TB treatments and dosing regimens are based on plasma concentration with less consideration paid to local distribution of administered compounds within the lung. • WHAT QUESTION DID THIS STUDY ADDRESS? ☑ The study developed a lung-oriented PBPK model to predict the local PK in the lung after systemic administration of anti-TB drugs. • WHAT THIS STUDY ADDS TO OUR KNOWLEDGE ☑ With the developed lung PBPK model, anti-TB drug concentrations in lung tissue and epithelial lining fluid can be predicted reasonably well using in vitro and in silico data inputs. • HOW THIS MIGHT CHANGE CLINICAL PHARMACOLOGY AND THERAPEUTICS ☑ The lung PBPK model enables exploration of the local PK of potential anti-TB drugs in drug discovery and development, as well as offering the potential to individualize dose regimen for TB patients based on modelling and simulation.
Tuberculosis (TB) remains a major global health problem. According to World Health Organization reports, an estimated 9 million people developed TB and 1.5 million died from the disease in 2013.1 Eleven drugs are approved by the US Food and Drug Administration for treating TB2 with combination therapy forming the standard-of-care. Rifampicin is an essential component of all short course (6-month) regimes usually in combination with isoniazid, pyrazinamide, and ethambutol. The currently approved treatments for TB are usually administered orally and, to effectively treat pulmonary TB, the drugs must penetrate from the systemic circulation to the granulomatous lesions in the lung where the mycobacteria exist. Significant efforts are being made to optimize currently available treatments for TB with the aim of reducing the length of treatment. In addition, novel treatments are being developed to combat emerging drug resistance with current therapies. The lack of correlation between the dose and drug concentration in the plasma, lung, and in the granulomatous lesions is a contributing factor to the long duration needed for current therapies3 and the failure of novel drug regimes.4
A modeling and simulation approach that integrates pharmacodynamic models of mycobacterial killing5 with prospective prediction of drug concentrations in the infected lung regions could aid dose selection for potential new treatments of TB and the optimal design of combination regimens. In addition, this kind of combined exposure-response modeling may have utility in understanding if local differences in drug concentration within the lung could impact on the development of drug resistance. As a first step toward this longer term aim, a physiologically based pharmacokinetic (PBPK) model was developed to simulate drug concentrations in the lung.
There has been a resurgence in the application of PBPK modeling within the pharmaceutical industry in recent years.6,7 This resurgence has been catalyzed by two main factors: (1) the development of algorithms allowing prediction of tissue distribution of drugs from their physicochemical properties and in vitro binding behavior8,9; and (2) the development of methods for in vitro-in vivo extrapolation of clearance.10 Whole-body PBPK models describing oral and/or intravenous administration of anti-TB drugs have been described.11–13 The model predicted drug concentrations in plasma and various tissues, including lungs, were generally in agreement with experimental data. However, these models considered the lung as a single homogeneous compartment and partitioning between lung and blood was empirically defined based on in vivo measurements. Herein, a mechanistic multicompartment permeability-limited model of the lung was developed and incorporated into a whole-body PBPK model. This PBPK model was then used to simulate the concentrations of drugs in the systemic circulation, in the epithelial lining fluid (ELF), and tissue mass in different lobes of the lung after dosing in a virtual human population. The model structure was chosen to represent a realistic representation of the physiology of the lung while maintaining reasonable computational speed. The model accounts for lung regional physiological differences (such as regional differences in gas exchange, blood perfusion,14,15 and transporter expression16), which can affect local concentrations. This structure provides a basis for mechanistic modeling of granulomatous TB lesions within individual lobes.
METHODS
Model structure
The structure of the mechanistic multicompartment lung model is shown in Figure 1. Based on its anatomy and physiology, the lung is described by seven segments representing upper and lower airways (2 segments) and the lobes of the lung (5 segments). Each segment is divided into four compartments representing pulmonary capillary blood, tissue mass, fluid, and alveoli air. The fluid compartment represents mucus and ELF, whereas the mass compartment represents the different cell types within the lung. Venous blood leaves the heart via the pulmonary artery and enters the pulmonary blood reservoir (PBR). From the PBR, venous blood enters individual lung lobes and the lower airway (LA) and is returned to the PBR oxygenated. Oxygenated blood leaves the PBR and flows to the arterial blood compartment via the pulmonary vein. The upper airway (UA) is perfused directly by arterial blood and blood exiting the UA is returned directly to the venous blood compartment (Figure 1). Ventilation occurs in the UA and LA. From the LA, inhaled air is distributed to the five lung lobes: left lung top lobe (LT), left lung lower lobe (LL), right lung top lobe (RT), right lung middle lobe (RM), and right lung lower lobe (RL). The equations used to describe the drug concentrations within the model are given in full in Supplementary Appendix S1.
Figure 1.
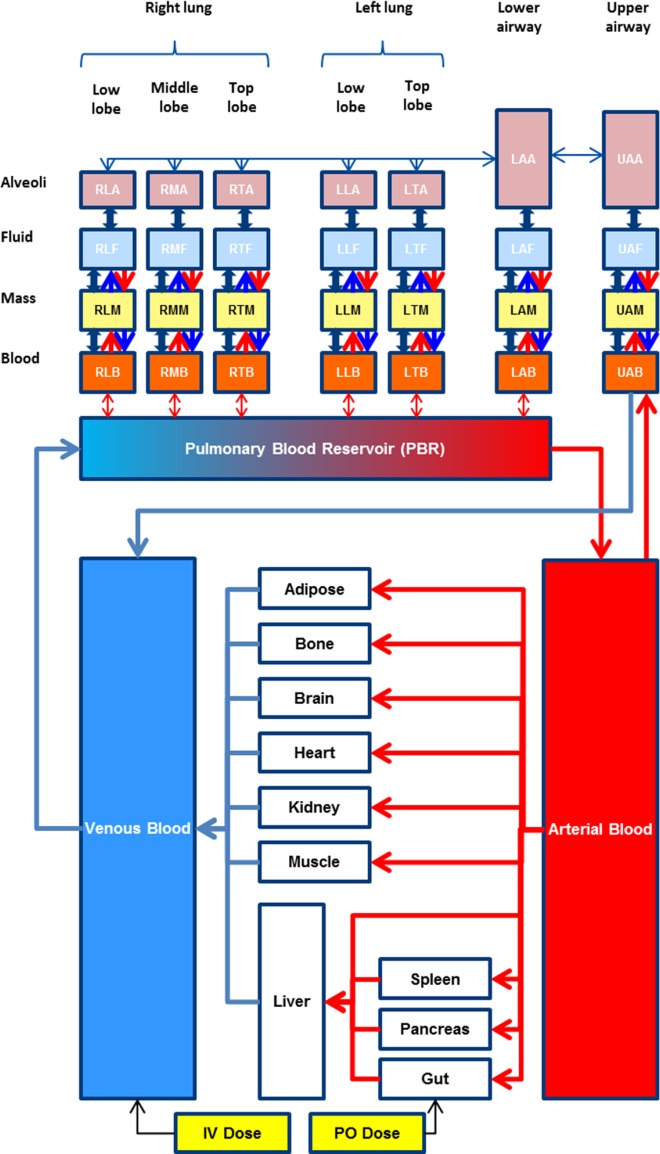
Structure of the multicompartment permeability-limited lung model embedded in the Simcyp full-PBPK model which consists of 12 perfusion-limited tissue compartments, in addition to the lung. The lung is approximated by seven segments, namely, upper (UA) and lower (LA) airways, left lung top lobe (LT), left lung lower lobe (LL), right lung top lobe (RT), right lung middle lobe (RM), and right lung low lobe (RL). Each of the segments contains four compartments representing pulmonary capillary blood (B), pulmonary tissue mass (M), fluid (F), and alveoli (A). Equilibrium is assumed between the fluid and the alveolar air. Within the lung model, the double arrows represent bidirectional passive permeability between adjacent compartments within the same segment, whereas the unidirectional arrows represent the active transport across the basal and apical membranes of pulmonary tissue. Metabolic elimination exists in the mass compartments.
Model assumptions
Each compartment is homogeneous, with constant physiological and pharmacological parameters. No fluid or mucus moves from the lobes to the airways, so mucociliary clearance is not accounted for. Inhaled air contains no drug, whereas exhaled air contains drugs with the same concentration as the UA air compartment. All blood flow rates (Q) and ventilation rates (R) are constant. Drugs passively diffuse (CLPD) between the different compartments within a segment and active uptake (CLuptake) and efflux transporters (CLefflux) at the basal (mass-blood) and apical (fluid-mass) membranes of the tissue mass compartments are considered. Metabolic elimination (CLmet) can occur in tissue mass compartments. Immediate equilibrium, defined by the air:fluid partition coefficient (KAF), is assumed between the fluid and air compartments of each segment.
Model parameters
The following physiological data were used in the multicompartment lung model.
Tissue volumes
The lung physiology parameters collected initially reflect the normal physiological state. Tissue volumes are generated using correlated Monte Carlo methods.17 The volume of total PBR (mean 89 mL, CV = 20%) is in the range reported in the literature (63–114 mL).18–20 The lung lobe blood pool is ∼5-fold higher in volume than the bronchial blood pool,20 so total PBR is split with each of the five lobes receiving 16.67% of the total PBR and the remaining 16.67% being split equally between the UA and LA segments. The same proportions were used to split the lung mass compartment (Vmass = Vlung – Vfluid – VPBR) and the ELF volume between the different segments. The total volume of ELF in the lungs is in the range of 10–40 mL.21,22 Based on this, a mean value of 25 mL (CV = 20%) was used.
Distribution of alveolar volume
An average alveolar air volume of 5.6 L (CV = 10%) was used.23 The alveolar volume was distributed to the lung lobes as follows: 3/19 (RT), 2/19 (RM), 5/19 (RL), 4/19 (LT), and 5/19 (LL).14
Upper/lower airways
The UA corresponds to the bronchi and trachea (generations 1–8), whereas the LA corresponds to non-respiratory bronchioles (generations 9–15), both of which have average air volumes of 0.05 L.20
Blood flow rate
Blood flow through the pulmonary circulation is equal to cardiac output and allocated to individual lobes as follows: 8.6% (RT), 11.8% (RM), 31.0% (RL), 8.6% (LT), 34.9% (LL), and 5.0% (LA).15 Furthermore, 2.5% of arterial blood circulates in the UA.20
Ventilation/perfusion distribution
The rate of alveolar ventilation is defined using the ventilation/perfusion ratio, which is virtually log-normally distributed in young healthy subjects (range = 0.3–3; geometric mean = 1.0; dispersion = 0.35 for ventilation).24 The ventilation rate is partitioned to individual lobes as follows: 14.9% (RT), 12.4% (RM), 25.9% (RL), 14.8% (LT), and 32.0% (LL).15
Absorption area
The absorption area is 1–2 m2 in the upper airways and ∼140 m2 in the deep lung.25 A value of 1.5 m2 (CV = 50%) is used for the sum of the UA and LA and is split 50:50. The 140 m2 (CV = 30%) pulmonary surface area is assigned to each lobe based on their relative alveolar volume.14
pH
The composition of the fluid compartment is mainly water (96%), salts, phospholipids, proteins, and mucins with a pH about 6.6 in healthy individuals.21 The pH in the lung mass is around 6.69 ± 0.07 when the arterial blood pH is between 7.38 and 7.43.26
Simulation design
Simulations were conducted for a total of seven compounds (rifampicin, ethambutol, isoniazid, itraconazole, erythromycin, clarithromycin, and pyrazinamide) where concentrations in human ELF, plasma, and, in some cases, alveolar macrophages or bronchial tissue have been published (Supplementary Table S1). Model performance was verified by comparing simulation results with clinical observations that had not been used in model development. The default compound files provided in Simcyp V14 R1 were used to simulate the plasma concentrations of rifampicin, itraconazole, clarithromycin, and erythromycin with changes as noted in the Supplementary Appendix S2. The details of the compound files constructed for ethambutol, isoniazid, and pyrazinamide are given in Supplementary Table S2.
Parameterization of the multicompartment lung model
For each compound, Henry's constant was predicted using a quantitative structure–activity relationship (QSAR) approach27 and used to calculate the air:fluid partition coefficient (Supplementary Appendix S1). Measured values of unbound fraction in lung tissue homogenate could not be found for any of the compounds, so fu in lung tissue mass was predicted in an analogous manner to that used previously in the liver.28 Predicted fu lung mass values are: rifampicin (0.058), isoniazid (0.984), ethambutol (0.451), pyrazinamide (0.985), erythromycin (0.338), and clarithromycin (0.117). For itraconazole, the predicted fu mass in the lung (0.00177) was corrected by dividing the calculated value by the Kp scalar (0.023). This correction was made to account for the large overprediction of itraconazole tissue distribution when calculated using the Rodgers and Rowland method.9 For all compounds, lung metabolism was assumed to be negligible (CLmet = 0). Initial simulations were performed considering that distribution of compounds to the lung compartments occurred only by passive diffusion. Sensitivity analyses were conducted to show the effect of including transporters, as well as altering ELF pH, on the disposition of the compounds in the lung.
Passive permeability estimates
Three different in vitro-in vivo extrapolation approaches were developed to predict lung permeability. The preferred method was to use in vitro permeability data obtained from the Calu-3 cell line. Permeability data for a set of 28 compounds in Calu-3 cells were collated from the literature.29–33 Permeability in Calu-3 cells was also correlated to the in vitro permeability for the same set of compounds in Caco-2 cells,25,34 so that Caco-2 permeability can be used to predict Calu-3 permeability. A QSAR model to predict in vitro Calu-3 permeability using physicochemical properties was also developed. Physicochemical properties, such as molecule weight, Log P, pKa, polar surface area, hydrogen bond donor count (HDC), and hydrogen bond acceptor count, were obtained from Drugbank (http://www.drugbank.ca/) and log D7.4 and log D6.5 were calculated within the Simcyp Simulator. Different combinations of physicochemical properties were tried in an iterative process to obtain a model that could describe the data with reasonable precision (R2) using as few parameters as possible. Each of the three approaches (Calu-3, Caco-2, and QSAR) can give an estimate to the in vitro passive permeability for the compounds. The in vitro permeability data were divided by the unionized fraction of compound (calculated at the pH of the in vitro system) as only the unbound, unionized drug is considered to be passively permeable in the lung PBPK model. The in vitro permeability was extrapolated to an in vivo permeability by accounting for the difference in the surface area of the lung (1–2 m2 in the upper airways and 140 m2 in the deep lung) compared to the surface area of the in vitro system.
Data sources for individual compounds
For rifampicin (0.0169 × 10⁻⁴ cm/s32) and clarithromycin (0.045 × 10⁻⁴ cm/s33) apparent permeability data are available in Calu-3 cells. The unionized fraction of rifampicin at pH 7.4 is 4.7 × 10⁻⁷ and that of clarithromycin is 0.025. For isoniazid, no permeability data in Calu-3 cell monolayers were found in the literature, so permeability was estimated using the correlation with Caco-2 data.35,36 Isoniazid is essentially unionized at pH 7.4 (fni = 0.999). For pyrazinamide (13.8 × 10⁻⁷ cm/s), ethambutol (3.0 × 10⁻⁷ cm/s) and itraconazole (2798 × 10−7 cm/s) lung permeability was predicted using the QSAR model and corrected for the unionized fraction at pH 7.4 (1, 0.0062, and 0.9998, respectively). For erythromycin, similar estimates of lung permeability were obtained using the Calu-3:Caco-2 correlation and the QSAR model (14.7 × 10⁻⁷ cm/s and 14.5 × 10⁻⁷ cm/s, respectively). The unionized fraction at pH 7.4 for erythromycin is 0.038.
RESULTS
Prediction of permeability
A correlation (Calu-3 Papp [10−7 cm/s] = 0.5881*Caco-2 Papp [10−7 cm/s] + 4.5594; r2 = 0.76) between permeability in Calu-3 and Caco-2 cells was observed for the collated dataset (Supplementary Figure 1). The best relationship between physicochemical properties and Calu-3 permeability was obtained with the following equation:
Log Papp Calu-3 cells (10−7 cm/s) = 0.3345*(LogDpH6.5) −0.0956*HDC+1.5539 (r2 = 0.73).
Performance verification for ethambutol, pyrazinamide, and isoniazid compound files
The ability of the developed models to recover plasma concentrations of ethambutol, pyrazinamide, and isoniazid were checked by comparing predicted plasma concentrations with published data using similar study designs and subject demographics (Supplementary Table 1). For each of the three compounds, there was reasonable agreement between the simulated and observed plasma/serum concentrations (Supplementary Figure 2).
Simulations of ELF:plasma and lung macrophage/tissue:plasma concentration ratios
Simulations were performed for all seven drugs (ethambutol, pyrazinamide, rifampicin, isoniazid, itraconazole, erythromycin, and clarithromycin) and the simulated ELF:plasma concentration ratios (Figure 2) and alveolar macrophage/lung tissue:plasma concentration ratios (Figure 3) were compared to the reported values in the literature (summarized in Supplementary Table 1). The ELF:plasma ratios predicted by the model were in reasonable agreement (within 2.5-fold) with the observed ELF:plasma ratios for rifampicin, ethambutol, isoniazid, and erythromycin. The ELF:plasma ratios were underestimated for itraconazole, pyrazinamide, and clarithromycin (13-fold, 16-fold, and ∼26-fold). There was reasonable agreement between the simulated concentrations of rifampicin, isoniazid, itraconazole, and pyrazinamide in the lung mass compartment and the measured concentrations in alveolar macrophages and/or lung tissue.
Figure 2.
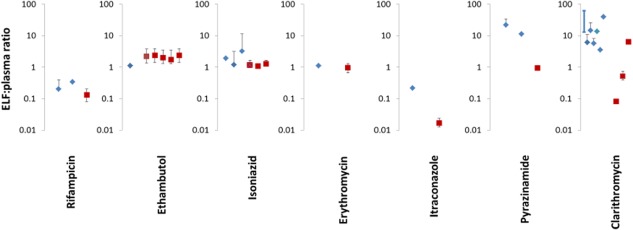
Observed (blue diamonds) and predicted (red square) ELF:plasma ratios for rifampicin, ethambutol, isoniazid, erythromycin, itraconazole, pyrazinamide, and clarithromycin. The simulated values are presented as mean value with the range simulated in the virtual population. For rifampicin, erythromycin, itraconazole, pyrazinamide, and clarithromycin, the concentrations in the right lower lobe of the lung are shown. For ethambutol, the simulated concentrations are shown (from left to right) for the left upper, left lower, right upper, right middle, and right lower lung lobes. For isoniazid, the concentrations in the right lower lobe of the lung are shown. The three red squares from left to right represent the concentration in the whole population and in slow and fast acetylators of isoniazid. The average value of the observed clinical data is denoted by a symbol and, where it is available, the SD has also been shown as a black line (error bar). For some studies, only the range of observed values was available and these have been shown on the graph by a dark blue line with no symbol. For clarithromycin, the simulated ELF:plasma ratios at different lung ELF pH are shown (from left to right, pH = 7.4, 6.6, and 5.5). The individual clinical studies depicted on the graph are those listed in Supplementary Table S1.
Figure 3.
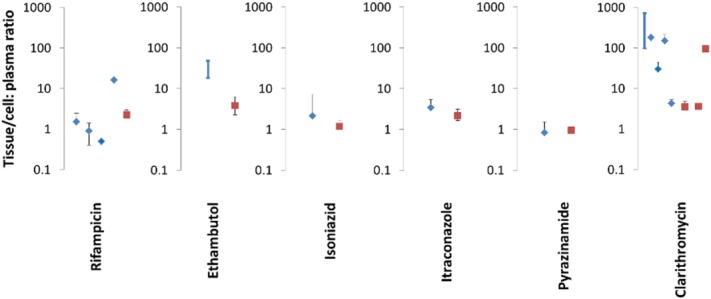
Observed (blue diamonds) and predicted (red square) mean cell or tissue:plasma ratios for rifampicin, ethambutol, isoniazid, itraconazole, pyrazinamide, and clarithromycin. The simulated values are presented as mean value with the range simulated in the virtual population. The average value of the observed clinical data is denoted by a symbol and, where it is available, the SD has also been shown as a black line (error bar). For some studies, only the range of observed values was available and these have been shown on the graph by a dark blue line with no symbol. For clarithromycin, the simulated mass:plasma ratios without or with uptake transporter from blood to mass are shown (from left to right, the clearance of uptake transporter was set at 0 (no transporter), 0.6 (low transporter function), and 60 L/h (high transporter function); Supplementary Figure 3). The individual clinical studies depicted on the graph are those listed in Supplementary Table S1.
Sensitivity of the simulated lung fluid and mass concentrations to lung model parameters
As shown in Figure 2, for some compounds the simulations underpredicted the concentration of the drug in the ELF. Sensitivity analysis was conducted to look at possible reasons for the underprediction. Figure 4 shows simulations of clarithromycin in a representative healthy volunteer subject. As the pH in the ELF was reduced, the concentration of drug in the fluid was increased so that at a pH of 5.5 the concentrations of drug in the lung fluid exceeded those in the plasma. The systemic plasma and lung mass concentrations were not noticeably affected by the change in ELF pH. Figure 5 shows the impact of active efflux on the simulated ELF concentrations. As the activity of the efflux transporter was increased, the concentration of pyrazinamide in the ELF increased (Figure 5b) with minimal changes in the drug concentration in the systemic plasma (Figure 5a) or lung tissue (Figure 5c) compartments. Additional sensitivity analyses were conducted to show that both changing the fu in lung tissue as well as the addition of an uptake transporter activity from the blood to lung tissue resulted in changes in the plasma/blood to lung tissue ratio (Figure 3, Supplementary Figures 3 and 4).
Figure 4.
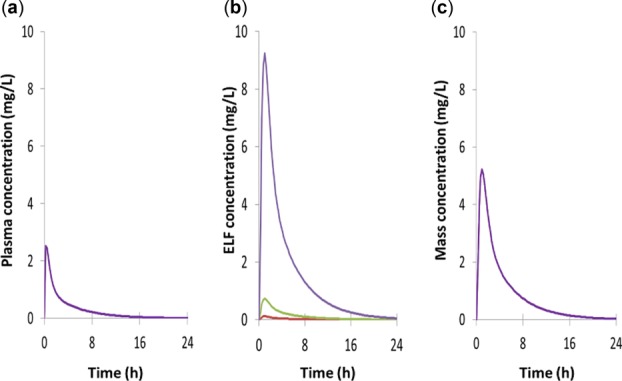
Effect of changing the pH of ELF of the lung on the concentration of clarithromycin (pKa 8.99) in (a) plasma, (b) the lung fluid, and (c) the lung mass compartments of the lower right lung lobe. The pH values used were pH 7.4 (red line), pH 6.6 (green line), and pH 5.5 (purple line). Note: The effect of lung ELF pH on prediction of ELF:plasma concentration ratio is also shown in Figure 2.
Figure 5.
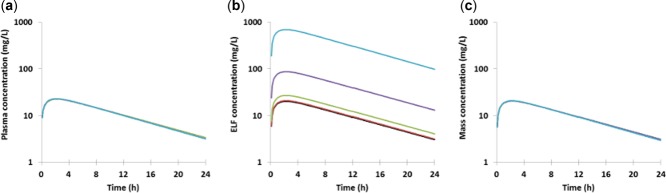
The effect of adding the action of an efflux transporter between the lung mass and ELF on (a) systemic plasma concentration, (b) ELF concentration, and (c) the mass concentration of pyrazinamide. The clearance of the efflux transporter was set at 0 (black line), 0.06 (red), 0.6 (green), 6 (purple), and 60 L/h (light blue).
DISCUSSION
The long duration needed for current gold standard TB treatments and the threat of emergence of drug resistance are driving the search for new drug treatments for TB.37 Several pieces of information are needed to accurately predict the efficacious dose for potential new treatments and to better design optimal combination therapy strategies. These include an understanding of the pharmacokinetic relationship between drug dose, and the concentration of drug in the plasma, lung, and in the granuloma regions of the infected lung tissue. In addition, an understanding of the pharmacodynamic relationship between the drug concentration in the granulomatous region of the lung and its ability to kill the different mycobacteria populations within the lesion (intracellular, extracellular, replicating, and dormant) over time is needed. As a first step in developing a model that can fulfil this overall aim, a systems pharmacology approach was used to develop a permeability-limited lung PBPK model. The model was used to predict the distribution of anti-TB drugs in different regions of the lung.
A number of PBPK models investigating various aspects of drug/chemical absorption and disposition in the lung have been published previously. These include models to investigate the absorption of inhaled soluble vapor using pulmonary ventilation-perfusion models.38 Integrated PBPK-fluid dynamic models to simulate the deposition, convection, and diffusion of inhaled particles within the airway have also been described.39 Lyons and co-workers have reported a PBPK model for rifampin and capreomycin in mice,12,13 in which interanimal variability was considered by Monte Carlo simulation using defined probability distributions for the model parameters. The compartments within the model were perfusion-limited and parameterized by tissue volumes, blood flow, and drug-dependent tissue/blood partition coefficients based on animal observed data.
Herein a multicompartment permeability-limited lung PBPK model was developed. The inputs used to predict the passive permeability of drugs within the lung compartments were based on in vitro and/or in silico inputs together with the use of in vitro-in vivo extrapolation techniques. The advantage of this “bottom-up” approach is that the model can be used prospectively for novel compounds being considered as potential anti-TB drugs. Using the in silico/in vitro data alone to describe the lung passive permeability within the model the ELF:plasma concentrations were simulated with reasonable accuracy (within 2.5-fold) for four of the seven compounds tested and lung tissue:plasma concentration ratios were simulated with reasonable accuracy for four of six compounds (Figures 2 and 3).
Looking at the individual compound predictions in more detail, the PBPK model predicted ELF:plasma ratios of 0.8–1.2 after dosing of isoniazid (300 mg). The observed ELF: plasma ratios were 1.2 ± 1.9 for fast acetylators and 3.2 ± 8.1 for slow acetylators.40 Although the ratios (particularly in slow acetylators) are quite variable, taking account of the entirety of the clinical data, there were no significant differences in the measured isoniazid concentration in plasma and ELF at 1 hour, suggesting that the drug enters the ELF by passive diffusion.40 The simulated concentrations of ethambutol in the lung mass compartment at four hours after the last dose were markedly lower than the concentrations reported in alveolar macrophages41 (observed macrophage:plasma ratio ranged 18–48 vs. predicted mean value = 2; Figure 3). It is possible that this reflects trapping of the basic compound within the acidic lysosomes of the macrophages and that the prediction accuracy would be improved by explicitly accounting for this phenomenon within the PBPK model. Clarithromycin concentrations in the clinical studies were variable and the simulated concentration ratios were consistent with the concentrations reported in bronchial tissue biopsy42 but were lower than the reported concentration ratio between alveolar macrophages and plasma. The time course of rifampicin in the plasma and lung was compared with the clinical data observed in the study by Ziglam et al.43 and the data generated by Monte Carlo simulation based on clinical observation5 (Figure 6). The plasma and ELF rifampicin concentrations predicted by the model were in good agreement with the concentrations observed in the study by Goutelle et al.5 The inter-study variability in rifampicin pharmacokinetics are evident in that the model underpredicted the plasma and ELF concentrations observed in the study by Ziglam et al.43 The concentrations of rifampicin predicted to be in the lung mass compartment were in agreement with the reported concentrations for rifampicin in the bronchial mass,43 but slightly higher than the alveolar macrophage levels observed by Goutelle et al.5 and markedly lower than the concentrations reported by Ziglam et al.43
Figure 6.
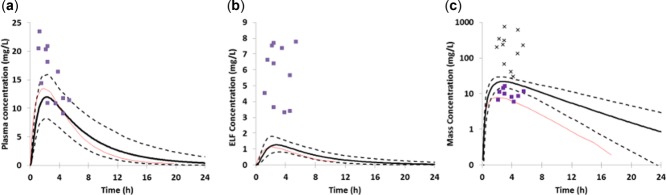
Comparison of predicted and observed concentrations of rifampicin in (a) plasma, (b) epithelial lining fluid, and (c) lung mass. The simulated data was obtained using the SV-rifampicin_SD compound file with a single oral dose of rifampicin (600 mg) and is represented as the mean profile (solid black thick line) with the 5th and 95th percentiles of the population shown as dashed black lines. The observed data from the study by Ziglam et al.43 is shown as purple squares (in panel c the purple squares represent bronchial mass and the black crosses data from alveolar macrophages) and the data presented after Monte Carlo simulations in the article by Goutelle et al.5 are shown as a solid red thin line.
Using sensitivity analysis, it was shown that both changes in lung fluid pH, lung mass unbound fraction, and the action of drug transporters within the lung could be reasonable explanations for some of the mispredictions of concentrations in lung tissue or ELF. A decrease in lung ELF pH increased the concentrations of drugs with basic pKa in ELF. When ELF pH = 5.5, the predicted ELF:plasma ratio of clarithromycin is 6.3, comparable to clinical observations (Supplementary Table 1). The default pH of lung fluid used (6.6) was obtained from studies with healthy volunteers.21 It is known that the pH of ELF can become more acidic in certain disease states. For instance, in TB infection, exhaled air is known to be more acidic than in healthy volunteers.44 The clinical studies used to compare with the simulation results include both healthy individuals and also some individuals with different lung pathologies. In most of the studies, the actual pH of the collected lung fluid was not reported and thus decreased ELF pH is one plausible explanation for some of the underprediction of drug concentration seen. These effects would only be observed for compounds that have a basic pKa, like clarithromycin (Figure 4).
For essentially neutral compounds, such as pyrazinamide, the underprediction of lung ELF concentrations must have a different mechanism. This was investigated by including the effect of an efflux transporter between the lung mass and ELF in the simulations (Figure 5). Similarly, changing the unbound fraction of lung mass and including an uptake transporter from blood to lung tissue mass may improve the prediction of mass:plasma ratio (Figure 3, Supplementary Figures 3 and 4). A number of ABC and SLC transporters are known to be expressed in the lung.45 The SLC uptake transporters OCT1, OCTN1, and OCTN2 are localized in the apical membrane of lung epithelial cells.21 MRP1 is localized on the basolateral side of pulmonary epithelial cells in the bronchial and alveolar epithelium. P-gp is on the apical membrane of the pulmonary epithelial and vascular endothelial cells, whereas BCRP is on the basolateral membrane.21 The absolute abundance of some drug transporters and enzymes in the lung have also been measured.16 As more of these transporter data become available, the model developed is ready to incorporate the effect of individual transporters using an IVIVE approach that has been realized in liver, kidney, and intestine.28,46 Of the drugs simulated in this study, itraconazole and clarithromycin are known to be substrates of P-gp.47,48 Pyrazinamide is a substrate for a Na+ co-transporter and a urate exchange protein in the kidney,49 but information on its ability to be transported by proteins present in the human lung is lacking. Nevertheless, the simulation results with pyrazinamide pose the following questions: are transporters involved in producing the high concentrations of pyrazinamide in the ELF? Or is there another mechanism(s) involved that needs to be accounted for within the PBPK model?, that will require further basic research to address them.
Although lung ELF pH and drug transporters could explain some of the underprediction of ELF:plasma ratio observed for some compounds in this study, there are other factors that also need to be considered. The lung mass is considered as a single compartment representing macrophages, pulmonary epithelial cells, smooth muscle cells, and vascular endothelial cells within the model. Many of the measurements of drug concentration in lung cells or tissue were made in alveolar macrophages obtained after bronchoalveolar lavage and these cells may not be representative of the whole lung tissue mass. In addition, the experimental procedures used to obtain and prepare the cells are subject to potential sources of experimental error. These issues have been discussed extensively by Kiem and Schentag.50 The clinical data (Figures 2 and 3; Supplementary Table 1) used for comparison to the simulations showed more than a 100-fold range for clarithromycin and the values for isoniazid (CV >200%) highlight the difficulty in obtaining reproducible data with techniques such as bronchoalveolar lavage. The pharmacokinetics of rifampicin are known to vary from study to study and the concentrations reported by Goutelle et al.5 were lower than those reported by Ziglam et al.43 Dose dependent bioavailability, auto-induction effects that occur on multiple dosing, and inhibition and induction effects on drug metabolizing enzymes and transporters all contribute to this interstudy variability.
The current model predicts concentration of the drug in the tissue and ELF of the lung. In addition to local lung tissue concentrations, the model structure incorporates loss of drug at the ELF:air interface so it may have broader applications for prediction of the behavior of volatile drugs in the future. Ideally, to predict the efficaciousness of anti-TB drugs it would be desirable also to predict the concentrations within the granulomatous regions that develop during TB infection and to link these to pharmacodynamic models describing the effect of the drugs on bacterial levels.3 The structure of the current model is amenable to incorporating changes that occur during TB infection and to include granuloma in any of the lung mass compartments. These adaptations would require changes in the tissue composition, blood flow and ventilation rate in the affected lobes, as well as changes that occur in general physiological parameters in individuals with TB infection, including weight loss, decreased levels of plasma albumin and hematocrit and increased levels of α1-acid glycoprotein, decreased pH in the lung alveolar fluid, and exhaled air.
In conclusion, this article describes the development of a novel mechanistic permeability-limited lung PBPK model and its application to simulating the concentration of seven anti-TB drugs in the plasma, lung tissue, and ELF. This lung-oriented PBPK model is the first step toward providing an in silico tool to help better understand the drug concentrations within the lungs in patients with TB.
Acknowledgments
This research was funded by a grant from the Critical Path Institute and the Bill & Melinda Gates Foundation.
Author Contributions. I.G., L.G., M.J., B.G.S., K.R., and L.A. wrote the manuscript. I.G., L.G., M.J., B.G.S., J.W., K.R., D.H., Debra H., and L.A. designed the research. I.G., L.G., B.G.S., J.W., and L.A. performed the research. I.G., L.G., and L.A. analyzed the data.
Conflict of Interest. I.G., M.J., L.G., L.A., B.G.S., and J.W. are employed by Simcyp (a Certara company). D.H. is employed by Certara USA.
Supporting Information
Additional Supporting Information may be found in the online version of this article.
Supporting Information
Supporting Information
Supporting Information
Supporting Information
Supporting Information
Supporting Information
Supporting Information
Supporting Information
References
- World Health Organization. Global Tuberculosis Report 2013 (World Health Organisation, Geneva, 2013) [Google Scholar]
- Centers for Disease Control and Prevention. Treatment of Tuberculosis (American Thoracic Society, CDC, and Infectious Diseases Society of America, Atlanta, 2003) [Google Scholar]
- Dartois V. The path of antituberculosis drugs: from blood to lesions to mycobacterial cells. Nat. Rev. Microbiol. 2014;12:159–167. doi: 10.1038/nrmicro3200. ) [DOI] [PMC free article] [PubMed] [Google Scholar]
- Gillespie SH, et al. Four-month moxifloxacin-based regimens for drug-sensitive tuberculosis. N. Engl. J. Med. 2014;371:1577–1587. doi: 10.1056/NEJMoa1407426. ) [DOI] [PMC free article] [PubMed] [Google Scholar]
- Goutelle S, Bourguignon L, Maire PH, Van Guilder M, Conte JE., Jr Jelliffe RW. Population modeling and Monte Carlo simulation study of the pharmacokinetics and antituberculosis pharmacodynamics of rifampin in lungs. Antimicrob. Agents Chemother. 2009;53:2974–2981. doi: 10.1128/AAC.01520-08. . & ) [DOI] [PMC free article] [PubMed] [Google Scholar]
- Shardlow CE, Generaux GT, Patel AH, Tai G, Tran T. Bloomer JC. Impact of physiologically based pharmacokinetic modeling and simulation in drug development. Drug Metab. Dispos. 2013;41:1994–2003. doi: 10.1124/dmd.113.052803. & ) [DOI] [PubMed] [Google Scholar]
- Sinha VK, Snoeys J, Osselaer NV, Peer AV, Mackie C. Heald D. From preclinical to human–prediction of oral absorption and drug-drug interaction potential using physiologically based pharmacokinetic (PBPK) modeling approach in an industrial setting: a workflow by using case example. Biopharm. Drug Dispos. 2012;33:111–121. doi: 10.1002/bdd.1782. & ) [DOI] [PubMed] [Google Scholar]
- Poulin P. Theil FP. Prediction of pharmacokinetics prior to in vivo studies. 1. Mechanism-based prediction of volume of distribution. J. Pharm. Sci. 2002;91:129–156. doi: 10.1002/jps.10005. & ) [DOI] [PubMed] [Google Scholar]
- Rodgers T, Leahy D. Rowland M. Physiologically based pharmacokinetic modeling 1: predicting the tissue distribution of moderate-to-strong bases. J. Pharm. Sci. 2005;94:1259–1276. doi: 10.1002/jps.20322. & ) [DOI] [PubMed] [Google Scholar]
- Rostami-Hodjegan A. Physiologically based pharmacokinetics joined with in vitro-in vivo extrapolation of ADME: a marriage under the arch of systems pharmacology. Clin. Pharmacol. Ther. 2012;92:50–61. doi: 10.1038/clpt.2012.65. ) [DOI] [PubMed] [Google Scholar]
- Edginton AN, Ahr G, Willmann S. Stass H. Defining the role of macrophages in local moxifloxacin tissue concentrations using biopsy data and whole-body physiologically based pharmacokinetic modelling. Clin. Pharmacokinet. 2009;48:181–187. doi: 10.2165/00003088-200948030-00004. & ) [DOI] [PubMed] [Google Scholar]
- Reisfeld B, Metzler CP, Lyons MA, Mayeno AN, Brooks EJ. Degroote MA. A physiologically based pharmacokinetic model for capreomycin. Antimicrob. Agents Chemother. 2012;56:926–934. doi: 10.1128/AAC.05180-11. & ) [DOI] [PMC free article] [PubMed] [Google Scholar]
- Lyons MA, Reisfeld B, Yang RS. Lenaerts AJ. A physiologically based pharmacokinetic model of rifampin in mice. Antimicrob. Agents Chemother. 2013;57:1763–1771. doi: 10.1128/AAC.01567-12. & ) [DOI] [PMC free article] [PubMed] [Google Scholar]
- Kobashi S, Kuramoto K. Hata Y. Theory and Applications of CT Imaging and Analysis. Shanghai: InTech; 2011. Functional assessment of individual lung lobes with MDCT images; pp. 95–104. & (ed. Homma, N.) ) [Google Scholar]
- West JB. Regional differences in gas exchange in the lung of erect man. J. Appl. Physiol. 1962;17:893–898. doi: 10.1152/jappl.1962.17.6.893. ) [DOI] [PubMed] [Google Scholar]
- Sakamoto A, et al. Quantitative expression of human drug transporter proteins in lung tissues: analysis of regional, gender, and interindividual differences by liquid chromatography-tandem mass spectrometry. J. Pharm. Sci. 2013;102:3395–3406. doi: 10.1002/jps.23606. ) [DOI] [PubMed] [Google Scholar]
- Jamei M, Dickinson GL. Rostami-Hodjegan A. A framework for assessing inter-individual variability in pharmacokinetics using virtual human populations and integrating general knowledge of physical chemistry, biology, anatomy, physiology and genetics: a tale of ‘bottom-up’ vs ‘top-down’ recognition of covariates. Drug Metab. Pharmacokinet. 2009;24:53–75. doi: 10.2133/dmpk.24.53. & ) [DOI] [PubMed] [Google Scholar]
- Guyton AC. Hall JE. Textbook of Medical Physiology. 11th edn. Pennsylvania: W.B. Saunders Company; 2000. & ) [Google Scholar]
- Zanen P, van der Lee L, van der Mark T. van den Bosch JM. Reference values for alveolar membrane diffusion capacity and pulmonary capillary blood volume. Eur. Respir. J. 2001;18:764–769. doi: 10.1183/09031936.01.00232101. & ) [DOI] [PubMed] [Google Scholar]
- Valentin J. Basic anatomical and physiological data for use in radiological protection: reference values. A report of age- and gender-related differences in the anatomical and physiological characteristics of reference individuals. ICRP Publication 89. Ann. ICRP. 2002;32:5–265. ) [PubMed] [Google Scholar]
- Olsson B, et al. Controlled Pulmonary Drug Delivery. New York: Springer; 2011. Pulmonary drug metabolism, clearance, and absorption; pp. 21–50. . (eds. Smyth, H. & Hickey, A.). ) [Google Scholar]
- Fernandes CA. Vanbever R. Preclinical models for pulmonary drug delivery. Expert Opin. Drug Deliv. 2009;6:1231–1245. doi: 10.1517/17425240903241788. & ) [DOI] [PubMed] [Google Scholar]
- Chinn DJ, Cotes JE, Flowers R, Marks AM. Reed JW. Transfer factor (diffusing capacity) standardized for alveolar volume: validation, reference values and applications of a new linear model to replace KCO (TL/VA) Eur. Respir. J. 1996;9:1269–1277. doi: 10.1183/09031936.96.09061269. & ) [DOI] [PubMed] [Google Scholar]
- Wagner PD, Laravuso RB, Uhl RR. West JB. Continuous distributions of ventilation-perfusion ratios in normal subjects breathing air and 100 per cent O2. J. Clin. Invest. 1974;54:54–68. doi: 10.1172/JCI107750. & ) [DOI] [PMC free article] [PubMed] [Google Scholar]
- Eixarch H, Haltner-Ukomadu E, Beisswenger C. Bock U. Drug delivery to the lung: permeability and physicochemical characteristics of drugs as the basis for a pulmonary biopharmaceutical classification system (pBCS) J. Epithel. Biol. 2010;3:1–14. & ) [Google Scholar]
- Effros RM. Chinard FP. The in vivo pH of the extravascular space of the lung. J. Clin. Invest. 1969;48:1983–1996. doi: 10.1172/JCI106164. & ) [DOI] [PMC free article] [PubMed] [Google Scholar]
- Dearden J. Worth A. In silico prediction of physicochemical properties. Luxembourg: Institute for Health & Consumer Protection; 2007. & ). Report no. EUR 23051 EN. [Google Scholar]
- Jamei M, et al. A mechanistic framework for in vitro-in vivo extrapolation of liver membrane transporters: prediction of drug-drug interaction between rosuvastatin and cyclosporine. Clin. Pharmacokinet. 2014;53:73–87. doi: 10.1007/s40262-013-0097-y. ) [DOI] [PMC free article] [PubMed] [Google Scholar]
- Brillault J, De Castro WV. Couet W. Relative contributions of active mediated transport and passive diffusion of fluoroquinolones with various lipophilicities in a Calu-3 lung epithelial cell model. Antimicrob. Agents Chemother. 2010;54:543–545. doi: 10.1128/AAC.00733-09. & ) [DOI] [PMC free article] [PubMed] [Google Scholar]
- Foster KA, Avery ML, Yazdanian M. Audus KL. Characterization of the Calu-3 cell line as a tool to screen pulmonary drug delivery. Int. J. Pharm. 2000;208:1–11. doi: 10.1016/s0378-5173(00)00452-x. & ) [DOI] [PubMed] [Google Scholar]
- Mathia NR, Timoszyk J, Stetsko PI, Megill JR, Smith RL. Wall DA. Permeability characteristics of calu-3 human bronchial epithelial cells: in vitro-in vivo correlation to predict lung absorption in rats. J. Drug Target. 2002;10:31–40. doi: 10.1080/10611860290007504. & ) [DOI] [PubMed] [Google Scholar]
- Tewes F, Brillault J, Couet W. Olivier JC. Formulation of rifampicin-cyclodextrin complexes for lung nebulization. J. Control Release. 2008;129:93–99. doi: 10.1016/j.jconrel.2008.04.007. & ) [DOI] [PubMed] [Google Scholar]
- Togami K, Chono S. Morimoto K. Transport characteristics of clarithromycin, azithromycin and telithromycin, antibiotics applied for treatment of respiratory infections, in Calu-3 cell monolayers as model lung epithelial cells. Pharmazie. 2012;67:389–393. & ) [PubMed] [Google Scholar]
- Castillo-Garit JA, Marrero-Ponce Y, Torrens F. Rotondo R. Atom-based stochastic and non-stochastic 3D-chiral bilinear indices and their applications to central chirality codification. J. Mol. Graph. Model. 2007;26:32–47. doi: 10.1016/j.jmgm.2006.09.007. & ) [DOI] [PubMed] [Google Scholar]
- Goncalves JE, Ballerini Fernandes M, Chiann C, Gai MN, De Souza J. Storpirtis S. Effect of pH, mucin and bovine serum on rifampicin permeability through Caco-2 cells. Biopharm. Drug Dispos. 2012;33:316–323. doi: 10.1002/bdd.1802. & ) [DOI] [PubMed] [Google Scholar]
- Ranaldi G, Islam K. Sambuy Y. Epithelial cells in culture as a model for the intestinal transport of antimicrobial agents. Antimicrob. Agents Chemother. 1992;36:1374–1381. doi: 10.1128/aac.36.7.1374. & ) [DOI] [PMC free article] [PubMed] [Google Scholar]
- Zhang Y. Yew WW. Mechanisms of drug resistance in mycobacterium tuberculosis. Int. J. Tuberc. Lung Dis. 2009;13:1320–1330. & ) [PubMed] [Google Scholar]
- Morris JB. Biologically-based modeling insights in inhaled vapor absorption and dosimetry. Pharmacol. Ther. 2012;136:401–413. doi: 10.1016/j.pharmthera.2012.08.017. ) [DOI] [PubMed] [Google Scholar]
- Longest PW. Holbrook LT. In silico models of aerosol delivery to the respiratory tract – development and applications. Adv. Drug Del. Rev. 2012;64:296–311. doi: 10.1016/j.addr.2011.05.009. & ) [DOI] [PMC free article] [PubMed] [Google Scholar]
- Conte JE., Jr Effects of gender, AIDS, and acetylator status on intrapulmonary concentrations of isoniazid. Antimicrob. Agents Chemother. 2002;46:2358–2364. doi: 10.1128/AAC.46.8.2358-2364.2002. ., Golden, J.A., Kipps, J., Lin, E.T. & Zurlinden, E. ) [DOI] [PMC free article] [PubMed] [Google Scholar]
- Conte JE, Jr, Golden JA, Kipps J, Lin ET. Zurlinden E. Effects of AIDS and gender on steady-state plasma and intrapulmonary ethambutol concentrations. Antimicrob. Agents Chemother. 2001;45:2891–2896. doi: 10.1128/AAC.45.10.2891-2896.2001. & ) [DOI] [PMC free article] [PubMed] [Google Scholar]
- Honeybourne D, Kees F, Andrews JM, Baldwin D. Wise R. The levels of clarithromycin and its 14-hydroxy metabolite in the lung. Eur. Respir. J. 1994;7:1275–1280. doi: 10.1183/09031936.94.07071275. & ) [DOI] [PubMed] [Google Scholar]
- Ziglam HM, Baldwin DR, Daniels I, Andrew JM. Finch RG. Rifampicin concentrations in bronchial mucosa, epithelial lining fluid, alveolar macrophages and serum following a single 600 mg oral dose in patients undergoing fibre-optic bronchoscopy. J. Antimicrob. Chemother. 2002;50:1011–1015. doi: 10.1093/jac/dkf214. & ) [DOI] [PubMed] [Google Scholar]
- Ngamtrakulpanit L, Yu Y, Adjei A, Amoah G, Gaston B. Hunt J. Identification of intrinsic airway acidification in pulmonary tuberculosis. Glob. J. Health Sci. 2010;2:106–110. doi: 10.5539/gjhs.v2n1p106. & ) [DOI] [PMC free article] [PubMed] [Google Scholar]
- Bosquillon C. Drug transporters in the lung–do they play a role in the biopharmaceutics of inhaled drugs? J. Pharm. Sci. 2010;99:2240–2255. doi: 10.1002/jps.21995. ) [DOI] [PubMed] [Google Scholar]
- Neuhoff S, et al. Transporters in Drug Development. Vol. 7. New York: Springer; 2013. Accounting for transporters in renal clearance: towards a mechanistic kidney model (Mech KiM) pp. 155–177. . (eds. Sugiyama, Y. & Steffansen, B.), Vol.. ) [Google Scholar]
- Miyama T, et al. P-glycoprotein-mediated transport of itraconazole across the blood-brain barrier. Antimicrob. Agents Chemother. 1998;42:1738–1744. doi: 10.1128/aac.42.7.1738. ) [DOI] [PMC free article] [PubMed] [Google Scholar]
- Togami K, Hayashi Y, Chono S. Morimoto K. Involvement of intestinal permeability in the oral absorption of clarithromycin and telithromycin. Biopharm. Drug Dispos. 2014;35:321–329. doi: 10.1002/bdd.1900. & ) [DOI] [PubMed] [Google Scholar]
- Roch-Ramel F. Guisan B. Renal transport of urate in humans. News Physiol. Sci. 1999;14:80–84. doi: 10.1152/physiologyonline.1999.14.2.80. & ) [DOI] [PubMed] [Google Scholar]
- Kiem S. Schentag JJ. Interpretation of antibiotic concentration ratios measured in epithelial lining fluid. Antimicrob. Agents Chemother. 2008;52:24–36. doi: 10.1128/AAC.00133-06. & ) [DOI] [PMC free article] [PubMed] [Google Scholar]
Associated Data
This section collects any data citations, data availability statements, or supplementary materials included in this article.
Supplementary Materials
Supporting Information
Supporting Information
Supporting Information
Supporting Information
Supporting Information
Supporting Information
Supporting Information
Supporting Information