
. 2015 Sep 8;150(6):473–483. doi: 10.1530/REP-15-0253
 This work is licensed under a
 Figure 4.
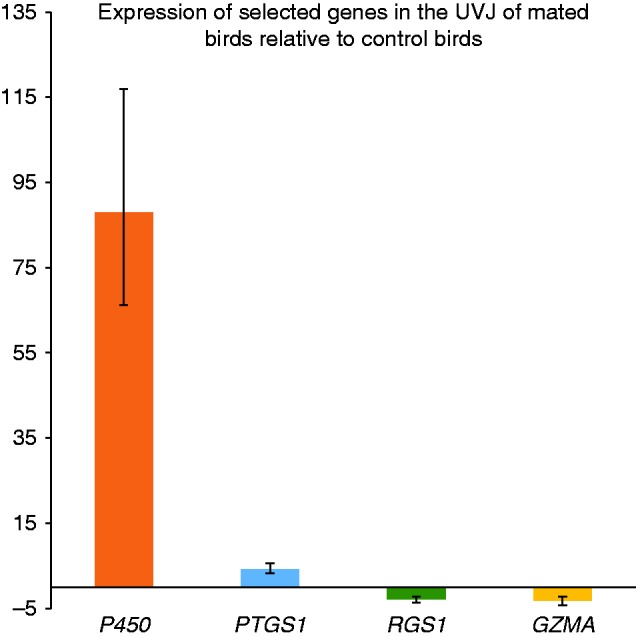
Quantitative PCR verification of microarray results. Two up-regulated (logFC >0.45) genes- P450, PTGS1 and two down-regulated (logFC <−0.45) genes- RGS1, GZMA have been verified using qPCR assay. The Y-axis represents mean expression (calculated by 2−ΔΔCt) of genes and the error bars represents ±s.e.m.