Abstract
Complete surgical removal of tumor tissue is essential for postoperative prognosis after surgery. Intraoperative tumor imaging and visualization are an important step in aiding surgeons to evaluate and resect tumor tissue in real time, thus enabling more complete resection of diseased tissue and better conservation of healthy tissue. As an emerging modality, hyperspectral imaging (HSI) holds great potential for comprehensive and objective intraoperative cancer assessment. In this paper, we explored the possibility of intraoperative tumor detection and visualization during surgery using HSI in the wavelength range of 450 nm - 900 nm in an animal experiment. We proposed a new algorithm for glare removal and cancer detection on surgical hyperspectral images, and detected the tumor margins in five mice with an average sensitivity and specificity of 94.4% and 98.3%, respectively. The hyperspectral imaging and quantification method have the potential to provide an innovative tool for image-guided surgery.
Keywords: Hyperspectral imaging, intraoperative tumor detection, wavelength optimization, mutual information, glare removal, active contour, support vector machine
1. INTRODUCTION
It is estimated that there were about 1.5 million new cases of cancer diagnosed in the United States in 2009 with an estimated annual cost of $ 216.6 billion [1]. Surgery remains a primary treatment approach for most solid tumors. The complete removal of tumor tissue would benefit patients and reduce treatment costs. Positive surgical margins have been associated with increased local recurrence and poor prognosis [2]. However, current methods for intraoperative tumor assessment use visual inspection and palpation, followed by histopathological assessment of suspicious areas under the microscope. This process is limited by the surgeon's ability of visualizing the difference between cancerous and healthy tissue. In addition, histopathology suffers from tissue sampling errors, time-consuming tissue sectioning and staining procedures, and inconsistence due to inter- and intra-observer variation. Therefore, intraoperative tumor imaging and visualization is an important step in aiding surgeons to evaluate and resect tumor tissue in real time, thus enabling more complete resection of diseased tissue and better conservation of healthy tissue.
As an emerging noninvasive technique, hyperspectral imaging (HSI) holds great promise to address these challenges [3]. Hyperspectral dataset called hypercube generally consists of hundreds of two dimensional (2D) images over contiguous spectral bands with a fine bandwidth. Light delivered into tissue undergoes multiple absorption and scattering. The absorption and scattering properties of tissue alter during neoplastic transformation, therefore the reflectance light spectra collected by HSI contains diagnostic information about tissue pathology and pathophysiology. By acquiring 2D images of a large area of tissue, HSI may enable the quantitative and comprehensive assessment of tissue pathology. The narrow-band data cube in a wide spectral range may provide more details for differentiating between normal and abnormal tissue compared to RGB color images. Since human vision is limited to visible light, spectral data in the near-infrared region may augment the surgeon's ability to noninvasively identify tumors with increased penetration depth into tissue. Our preliminary results show that HSI can differentiate cancerous from normal tissue noninvasively for both head and neck cancer [4] [5] [6] [7] and prostate cancer [8] [9] in animal models.
To meet the requirement of real-time intraoperative tumor diagnosis, fast data acquisition, accurate and real-time image processing is to be pursued for HSI [10]. However, high spectral dimension also poses significant challenges to the analysis of hypercube. First, High dimensionality substantially can significantly increase computational burden and storage space. Second, with narrow bandwidth, there is likely to be spectral redundancy between adjacent bands. Last but not least, on increasing the number of input features to the classifier without enough number of training samples available, the classification accuracy decreases due to the curse of dimensionality i.e. the Hughes phenomenon [11]. Therefore, it is desirable to analyze the spectral redundancy in the high dimensional data with wavelength selection technique before further processing.
The objective of this study is to analyze the wavelength redundancy and determine a compact set of wavelength bands in the visible and near-infrared wavelength range to achieve the best accuracy for distinguishing between cancerous and healthy tissue. We propose to use best band analysis, combined with an initial SVM and final active contour refinement classification method for intraoperative cancer detection. The proposed method is evaluated in a head and neck animal experiment; and the diagnostic sensitivity and specificity are reported.
2. MATERIALS AND METHODS
2.1 Instrumentation
A CRI Maestro in-vivo imaging system was used to acquire hyperspectral images. This is a wavelength-scanning system consisting of a Xenon light source, a solid-state liquid crystal filter and a 12-bit high-resolution charge-coupled device (CCD). This system is capable of obtaining reflectance images over the range of 450 nm – 950 nm with 2 nm increment, as well as fluorescence images under different excitation light sources [12].
2.2 Image Acquisition
In this study, a head and neck tumor xenograft model using head and neck squamous cell carcinoma (HNSCC) cell line M4E was used in the animal experiment. The HNSCC cells (M4E) were maintained as a monolayer culture in Dulbecco's modified Eagle's medium (DMEM)/F12 medium (1:1) supplemented with 10% fetal bovine serum (FBS) (30). M4E cells with green fluorescence protein (GFP), which were generated by transfection of pLVTHM vector into M4E cells, were maintained in the same condition as M4E cells. Animal experiments were approved by the Animal Care and Use Committee of Emory University. Five female mice aged 4-6 weeks were injected with 2 × 10⁶ M4E cells with GFP on the back of the animals. Surgery was performed approximately one month after tumor cell injection. During surgery, mice were anesthetized with a continuous supply of 2% isoflurane in oxygen. After the anesthesia administration, the skin covering the tumor was removed to expose the tumor.
Hyperspectral reflectance images were captured over the exposed tumor with the interior infrared, the white excitation, and an autoexposure time setting. The hypercube contains N=226 spectral bands from 450 to 900 nm with 2 nm increments.
After the HSI image acquisitions, GFP fluorescence images were subsequently acquired with a 450 nm excitation. Tumors appear green in the fluorescence images due to GFP. We will use the GFP tumor image as the in vivo gold standard to validate the tumor detection results by the proposed algorithm.
After imaging, tumors were cut horizontally from the bottom with a blade, kept in formalin for 24 hours and then processed histologically. Histological diagnosis serves as the ex vivo gold standard for tumor detection.
2.3 Method Overview
Figure 1 shows the flowchart of the proposed method. First, a raw hypercube is preprocessed to normalized reflectance data, and vectorized into a 2D matrix with each row representing the reflectance spectrum of individual pixel. Then a wavelength optimization method is applied to the 2D reflectance matrix, and the optimal wavelength set is selected as the spectral feature that best distinguishes cancerous from healthy tissue. Next, the optimal feature set is fed into a classifier, and the cross validated tumor probability map is generated for each mouse. Finally, the active contour method is applied to refine the initial classification map.
Figure 1.
Flowchart of the proposed method.
2.4 Pre-processing
The pre-processing of intraoperative hyperspectral data consists of five steps, which will remove the effects of the illumination system, compensate for geometry-related changes in image brightness, and reduce noises that deteriorates the images:
Step 1: Reflectance Calibration
Data normalization is required to eliminate the spectral non-uniformity of the illumination and the influence of dark current. The white reference image cubes are acquired by placing a standard white reference board in the field of view. The dark reference cubes are acquired by keeping the camera shutter closed. Then the raw data can be converted into normalized reflectance using the following equation:
| (1) |
where Ireflect(λ) is the calculated normalized reflectance value for each wavelength. Iraw(λ) is the intensity value of a sample pixel. Iwhite(λ) and Idark(λ) are the corresponding pixel from the white and dark reference images at the same wavelength as the sample image.
Step 2: Glare Removal
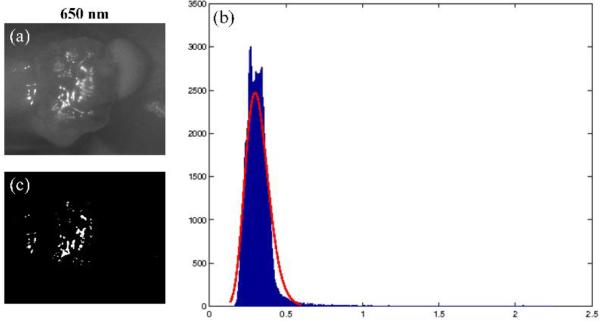
Glare strongly affects the appearance of intraoperative images and presents a major problem for surgical image analysis, since it eliminates the information in affected pixels [13]. Glare pixels can be characterized by high intensity in the image, therefore we proposed a novel adaptive thresholding method to detect and remove glare accurately from the dataset. Each hypercube is composed of a series of grayscale images in multiple wavelengths. We first compute the intensity histogram of each image band, then fit the histogram with a Gamma distribution. The threshold was set to be the intensity value which yielded a certain percentage (ε) of the peak value for each Gamma distribution. The value of ε was experimentally set to 0.5%, which was determined to detect most glare pixels in our experiments.
Step 3: Curvature Correction
In the xenograft tumor model, the bulk tumor usually protrude outside the skin, so curvature correction has to be applied to compensate for the difference in the intensity of light recorded by the cameras due to the elevation of tumor tissue. By dividing each spectrum by the total reflectance at a given wavelength λ, the distance and angle dependence as well as dependence on an overall magnitude of the spectrum can be removed [14].
Step 4: Noise Removal
After the normalization and processing in Steps 1- 3, the tissue spectra still present some noise, which might be due to the respiration of the mice. Therefore, a median filter is applied to eliminate spikes and to smooth the spectral curves of each pixel, while retaining the variations across different wavelengths.
Step 5: GFP bands Removal
GFP signals produce a strong contrast between tumor and normal tissue under blue excitation, and may also present a good contrast compared to other spectral bands under white excitation. To eliminate the effect of GFP signals on the cancer detection ability of HSI, GFP spectral bands, i.e. 508 nm and 510 nm in our case, are removed from the image cubes before feature extraction.
2.5 Wavelength Optimization
The goal of wavelength optimization is to find a wavelength set S with n wavelengths {λi}, that “optimally” characterize the difference between cancerous and normal tissue. To achieve the “optimal” condition, we used the maximal relevance and minimal redundancy (mRMR) [15] framework to maximize the dependency of each spectral band on the target class labels (tumor or normal), and minimize the redundancy among individual bands simultaneously. Relevance is characterized by mutual information I(x; y), which measures the level of similarity between two random variables x and y:
| (2) |
where p(x, y) is the joint probability distribution function of x and y, and p(x) and p(y) are the marginal probability distribution functions of x and y respectively.
We represent the spectrum of each pixel with a vector λ = [λ1, λ2, ..., λi], i=226, and the class label (tumor or normal) with c. Then the maximal relevance condition is:
| (3) |
The wavelengths selected by maximal relevance are likely to have redundancy, so the minimal redundancy condition is used to select mutually exclusive features:
| (4) |
So the simple combination (Equations (5) and (6)) of these two conditions forms the criterion for “minimal-redundancy-maximal-relevance” (mRMR), as defined below:
| (5) |
i.e.
| (6) |
2.6 Initial Image Segmentation
We first rearrange each mouse hypercube into a 2D matrix, of which each row represents the reflectance spectrum of a pixel and each column represents the reflectance at a given wavelength. For initial image segmentation, we use nested cross validation to perform model selection. In each outer fold, four mice data was combined as the training set, while the rest mouse data was used as testing set. In each inner fold, 3-fold cross validation is performed on the training set to select the optimal number of spectral bands and the optimal wavelength interval. After the optimal wavelength set and the classifier parameters are determined on the training data, we apply these parameters to the testing data set with the optimal wavelength set in each outer fold. Support vector machine with a radial basis kernel function is chosen as the classifier.
2.7 Active Contour Segmentation Enhancement
After obtaining the probability maps of each tumor images, we proceed to use active contours to refine the classification results. The Chan-Vese active contour method [16] is a region-based segmentation method, which can be used to segment the vector-valued images such as RGB images [17]. Standard L2 norm is used to compare the image intensity with the mean intensity of the region inside and outside the curve. If the image contains some artifacts, L2 norm may not work well. Therefore we modified the Chan-Vese active contour method with L1 norm, which compares the image intensity with the median intensity of the region inside and outside the curve. This modification makes the active contour more robust to noises. In this section, we will first introduce the mathematic formulation of the modified L1 norm active contour methods.
The energy function with L1 norm is defined as follows:
| (7) |
Where C stands for the curve, and Ω stands for the area inside C, and Ωc stands for the area outside C. The last term penalizes the “shape” of the curve to avoid complicated curves. N is the total number of image bands.
Given the curve C, we want to find the optimal values of ui, vi. By setting and , we obtain:
| (8) |
As we know that is either 1 or −1, to make the integration of inside the curve zero, half of the values should be 1, and the other half of the values should be −1, therefore, the optimal value for ui is the median intensity of the ith image band inside the curve C. Similarly, we know that the optimal value for vi is the median intensity of the ith image band outside the curve C.
It is expected that the modified active contour method with L1 norm applied on the RGB probability maps of tumors will further boost the classification performance.
2.8 Performance Evaluation Methods
Quantitative assessment of classification algorithm is very important [18] [19] [20]. Accuracy, sensitivity and specificity are commonly used performance metrics for a binary classification task [21] [22] [23]. In this study, accuracy is calculated as a ratio of the number of correctly labeled pixels to the total number of pixels in a test image. Sensitivity measures the proportion of actual cancerous pixels (“positives”) which are correctly identified as such in a test image, while specificity measures the proportion of healthy pixels (“negatives”) which are correctly classified as such in a test image. F-score is the harmonic mean of precision (the proportion of correct true positives to all predicted positives) and sensitivity. Table 1 shows the confusion matrix, which contains information about actual and predicted classification results performed by a classifier.
Table 1.
Confusion Matrix
| Predicted Results | |||
|---|---|---|---|
| Negative (healthy) | Positive (cancerous) | ||
| Gold Standard | Negative (healthy) | True Negative (TN) | False Positive (FP) |
| Positive (cancerous) | False Negative (FN) | True Positive (TP) | |
The definitions of accuracy, precision, sensitivity, specificity and F-score are defined below:
Error rate, false positive rate, and false negative rate are also used in this study to evaluate classification performance:
Error rate = 1-Accuracy; False positive rate = 1-Sensitivity; False negative rate = 1-Specificity.
3. RESULTS AND DISCUSSIONS
3.1 Glare Detection
Figure 2 shows the glare detection result of one spectral image. It can be found that glare pixels are characterized by relatively high intensity value (x-axis) with small number of pixel counts (y-axis). Most of the glares are detected by this method.
Figure 2.
An example result of glare detection. a) 650 nm spectral band of Mouse # 5. (b) Gamma curve fitting (in red) to the intensity histogram (in blue) of the selected spectral band. X-axis is the reflectance intensity value and y-axis is the number of pixels. (c) Glare map generated by the adaptive thresholding method.
3.2 Wavelength Analysis
Figure 3 shows the mean and standard deviation of the error rates for five mice as the number of the selected spectral bands increases from 10 to the largest number of bands for different step sizes. The error rates decrease as the spectral band increases to the largest wavelength for all the step sizes (2 nm, 4 nm, 10 nm and 20 nm). Therefore, it is not optimal to select a smaller compact set of bands than using the original data set for better performance given the training dataset in our study. All the wavelength bands should be employed to achieve the best classification performance. In addition, principal component analysis, sparse matrix transformation [24] [25] and tensor decomposition can be further applied to reduce the spectral dimensionality.
Figure 3.
Error rates (y-axis) for different wavelength bands (x-axis) at different step sizes. (a) step size = 2(b) step size = 4(c) step size = 10(d) step size = 20.
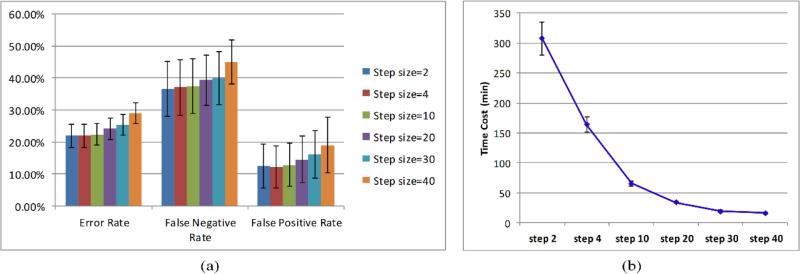
Figure 4 (a) is the mean and standard deviation of classification performance for five mice. As the step size increases from 2 nm to 30 nm, the classification error rates, false negative rates and false positive rates keep increasing. Figure 4 (b) shows that the time cost of the classification was dramatically reduced as the step size was changed from 2 nm to 30 nm. The increases of error rates, false negative rates, and false positive rates are less than 10% from 2 nm to 30 nm, while the decrease of time cost is more than 10 times. Therefore, larger step sizes can be chosen with fewer wavelength bands to achieve a satisfactory classification performance with less time costs.
Figure 4.
(a) Classification performance of different step sizes. (b) Time costs of different step sizes.
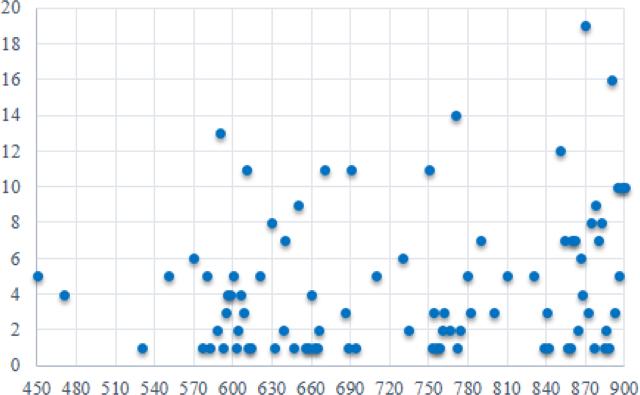
Figure 5 is a scatter plot of the ranking frequency of all the top 20 selected wavelengths for all five mice with a step size of 2 nm, 4 nm, 10 nm, and 20 nm. It is found that the most selected wavelength is 870 nm. In addition, the wavelength above 600 nm has more discriminating power than the wavelength below 600 nm.
Figure 5.
Wavelength Ranking. X axis represents the wavelength range from 450 to 900 nm. Y axis represent the frequency ranking of top 20 selected wavelength bands.
3.3 Classification Results
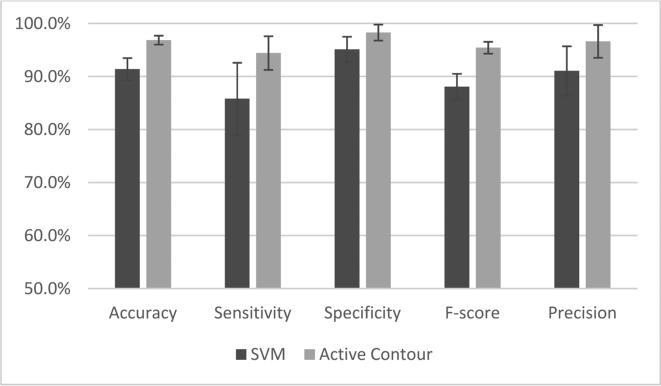
Based on the discussion above, we chose to employ all the spectral bands to obtain the best classification performance. As shown in Figure 6, we compared the classification results before and after active contour refinement and found that the active contour method increased the classification accuracy, sensitivity, and specificity by 5.5%, 8.6% and 3.2%, respectively.
Figure 6.
Comparison between classification results of SVM and the active contour refinement
Table 2 is the summary of the classification performance of all 5 mice with 224 bands. The average classification accuracy, sensitivity and specificity is 96.9%, 94.4%, and 98.3%, respectively.
Table 2.
Classification performance of 224 bands
| Mice ID | Accuracy | Sensitivity | Specificity | F-score | Precision |
|---|---|---|---|---|---|
| #1 | 97.9% | 94.6% | 99.1% | 0.960 | 97.3% |
| #2 | 97.2% | 94.5% | 99.1% | 0.966 | 98.8% |
| #3 | 96.4% | 97.4% | 96.0% | 0.945 | 91.7% |
| #4 | 97.2% | 96.4% | 97.6% | 0.961 | 95.9% |
| #5 | 95.7% | 89.2% | 99.7% | 0.940 | 99.4% |
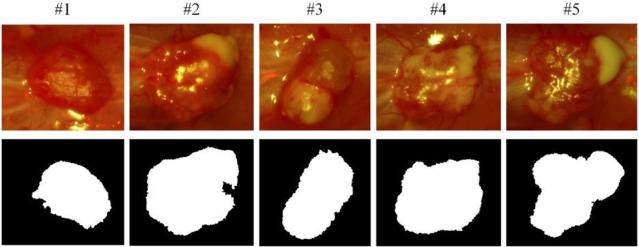
Figure 7 shows the final classification maps of the five mice. Active contour post-processing is able to refine the tumor contours and improve the classification results. Some classification errors on the tumor boundaries of mouse # 1 and mouse #2 is mainly due to blood contamination on surgical fields.
Figure 7.
Final classification maps. The first row is the RGB composite images of corresponding hypercube. The second row is the binary images after classification, indicating the tumor regions with white.
4. CONCLUSIONS
In this paper, we proposed a new approach for processing and classification of intraoperative hyperspectral images and evaluated its performance on an animal model for head and neck cancer detection. The glare detection method is effective in removing glare pixels, which may also be applied to other intraoperative optical images. The wavelength optimization method is employed to analyze the dependency and redundancy of the wavelength band with respect to the tumor or normal label. With the proposed image processing and classification method, we successfully differentiated cancer from healthy tissue with satisfactory sensitivity and specificity. The hyperspectral imaging and quantification method have the potential to provide an innovative tool for image-guided surgery.
ACKNOWLEDGEMENTS
This research is supported in part by NIH grants R21CA176684, R01CA156775 and P50CA128301, Georgia Cancer Coalition Distinguished Clinicians and Scientists Award, and the Center for Systems Imaging (CSI) of Emory University School of Medicine.
REFERENCES
- 1.L. National Heart, and Blood Institute . NHLBI Fact Book, Fiscal Year 2013. National Heart, Lung, and Blood Institute; 2013. [Google Scholar]
- 2.Nguyen QT, Tsien RY. Fluorescence-guided surgery with live molecular navigation--a new cutting edge. Nat Rev Cancer. 2013;13(9):653–62. doi: 10.1038/nrc3566. [DOI] [PMC free article] [PubMed] [Google Scholar]
- 3.Lu G, Fei B. Medical hyperspectral imaging: a review. J Biomed Opt. 2014;19(1):10901. doi: 10.1117/1.JBO.19.1.010901. [DOI] [PMC free article] [PubMed] [Google Scholar]
- 4.Lu G, Halig L, Wang D, et al. Spectral-spatial classification for noninvasive cancer detection using hyperspectral imaging. J Biomed Opt. 2014;19(10):106004. doi: 10.1117/1.JBO.19.10.106004. [DOI] [PMC free article] [PubMed] [Google Scholar]
- 5.Lu G, Halig L, Wang D, et al. Spectral-Spatial Classification Using Tensor Modeling for Cancer Detection with Hyperspectral Imaging. Proc SPIE. 2014;9034:903413. doi: 10.1117/12.2043796. [DOI] [PMC free article] [PubMed] [Google Scholar]
- 6.Pike R, Patton SK, Lu G, et al. A Minimum Spanning Forest Based Hyperspectral Image Classification Method for Cancerous Tissue Detection. Proc SPIE. 2014;9034:90341w. doi: 10.1117/12.2043848. [DOI] [PMC free article] [PubMed] [Google Scholar]
- 7.Lu G, Halig L, Wang D, et al. Hyperspectral Imaging for Cancer Surgical Margin Delineation: Registration of Hyperspectral and Histological Images. Proc SPIE. 2014;9036:90360s. doi: 10.1117/12.2043805. [DOI] [PMC free article] [PubMed] [Google Scholar]
- 8.Akbari H, Halig LV, Schuster DM, et al. Hyperspectral imaging and quantitative analysis for prostate cancer detection. J Biomed Opt. 2012;17(7):076005. doi: 10.1117/1.JBO.17.7.076005. [DOI] [PMC free article] [PubMed] [Google Scholar]
- 9.Akbari H, Halig LV, Zhang H, et al. Detection of Cancer Metastasis Using a Novel Macroscopic Hyperspectral Method. Proc SPIE. 2012;8317:831711. doi: 10.1117/12.912026. [DOI] [PMC free article] [PubMed] [Google Scholar]
- 10.Lo JY, Brown JQ, Dhar S, et al. Wavelength optimization for quantitative spectral imaging of breast tumor margins. PLoS One. 2013;8:e61767. doi: 10.1371/journal.pone.0061767. [DOI] [PMC free article] [PubMed] [Google Scholar]
- 11.Hughes G. On the mean accuracy of statistical pattern recognizers. Information Theory, IEEE Transactions on. 1968;14(1):55–63. [Google Scholar]
- 12.Halig LV, Wang D, Wang AY, et al. Biodistribution Study of Nanoparticle Encapsulated Photodynamic Therapy Drugs Using Multispectral Imaging. Proc SPIE. 2013;8672:867218. doi: 10.1117/12.2006492. [DOI] [PMC free article] [PubMed] [Google Scholar]
- 13.Lange H. Automatic glare removal in reflectance imagery of the uterine cervix. Proc. SPIE. 2005;5747:5747, 2183–2192. [Google Scholar]
- 14.Claridge E, Hidovic-Rowe D. Model based inversion for deriving maps of histological parameters characteristic of cancer from ex-vivo multispectral images of the colon. IEEE Trans Med Imaging. 2014;33(4):822–35. doi: 10.1109/TMI.2013.2290697. [DOI] [PubMed] [Google Scholar]
- 15.Peng H, Fulmi L, Ding C. Feature selection based on mutual information criteria of max-dependency, max-relevance, and min-redundancy. Pattern Analysis and Machine Intelligence, IEEE Transactions on. 2005;27(8):1226–1238. doi: 10.1109/TPAMI.2005.159. [DOI] [PubMed] [Google Scholar]
- 16.Chan TF, Sandberg BY, Vese LA. Active Contours without Edges for Vector-Valued Images. Journal of Visual Communication and Image Representation. 2000;11(2):130–141. [Google Scholar]
- 17.Wang H, Fei B. Nonrigid point registration for 2D curves and 3D surfaces and its various applications. Phys Med Biol. 2013;58(12):4315–30. doi: 10.1088/0031-9155/58/12/4315. [DOI] [PMC free article] [PubMed] [Google Scholar]
- 18.Qin X, Fei B. Measuring myofiber orientations from high-frequency ultrasound images using multiscale decompositions. Phys Med Biol. 2014;59(14):3907–24. doi: 10.1088/0031-9155/59/14/3907. [DOI] [PMC free article] [PubMed] [Google Scholar]
- 19.Qin X, Wang S, Shen M, et al. Mapping Cardiac Fiber Orientations from High-Resolution DTI to High-Frequency 3D Ultrasound. Proc SPIE. 2014;9036:90361o. doi: 10.1117/12.2043821. [DOI] [PMC free article] [PubMed] [Google Scholar]
- 20.Qin X, Cong Z, Jiang R, et al. Extracting Cardiac Myofiber Orientations from High Frequency Ultrasound Images. Proc SPIE. 2013;8675:867507. doi: 10.1117/12.2006494. [DOI] [PMC free article] [PubMed] [Google Scholar]
- 21.Lv G, Yan G, Wang Z. Bleeding detection in wireless capsule endoscopy images based on color invariants and spatial pyramids using support vector machines. IEEE Eng Med Biol Soc. 2011;2011:6643–6. doi: 10.1109/IEMBS.2011.6091638. [DOI] [PubMed] [Google Scholar]
- 22.Champion A, Guolan L, Walker M, et al. Semantic interpretation of robust imaging features for Fuhrman grading of renal carcinoma. IEEE Eng Med Biol Soc. 2014;2014:6446–9. doi: 10.1109/EMBC.2014.6945104. [DOI] [PMC free article] [PubMed] [Google Scholar]
- 23.Qin X, Lu G, Sechopoulos I, et al. Breast Tissue Classification in Digital Tomosynthesis Images Based on Global Gradient Minimization and Texture Features. Proc SPIE. 2014;9034:90341v. doi: 10.1117/12.2043828. [DOI] [PMC free article] [PubMed] [Google Scholar]
- 24.Qin X, Cong Z, Fei B. Automatic segmentation of right ventricular ultrasound images using sparse matrix transform and a level set. Phys Med Biol. 2013;58(21):7609–24. doi: 10.1088/0031-9155/58/21/7609. [DOI] [PMC free article] [PubMed] [Google Scholar]
- 25.Qin X, Cong Z, Halig LV, et al. Automatic Segmentation of Right Ventricle on Ultrasound Images Using Sparse Matrix Transform and Level Set. Proc SPIE. 2013;8669:86690Q. doi: 10.1117/12.2006490. [DOI] [PMC free article] [PubMed] [Google Scholar]


