Abstract
We recently reported that the histone deacetylase (HDAC) activity is required for activation of renal interstitial fibroblasts. In this study, we further examined the role of HDACs, in particular, HDAC1 and HDAC2, in proliferation of cultured rat renal interstitial fibroblasts (NRK-49F) and expression of cell cycle proteins. Inhibition of HDAC activity with trichostatin A (TSA), blocked cell proliferation, decreased expression of cyclin D1, a positive cell cycle regulator, and increased expression of p27 and p57, two negative cell cycle regulators. Silencing either HDAC1 or HDAC2 with siRNA also significantly inhibited cell proliferation, decreased expression of cyclin D1, and increased expression of p57. However, down-regulation of HDAC2, but not HDAC1 resulted in increased expression of p27. Furthermore, HDAC1 and HDAC2 downregulaton was associated with dephosphorylation and hyperacetylation of STAT3 (signal transducer and activator of transcription 3). Blockade of STAT3 with S3I-201 or siRNA decreased renal fibroblast proliferation. Finally, mouse embryonic fibroblasts (MEFs) lacking STAT3 reduced the inhibitory effect of TSA on cell proliferation, add-back of wild type STAT3 to STAT3−/− MEFs restored the effect of TSA. Collectively, our results reveal an important role of HDAC1 and HDAC2 in regulating proliferation of renal interstitial fibroblasts, expression of cell cycle proteins and activation of STAT3. Further, STAT3 mediates the proliferative action of HDACs.
Keywords: histone deacetylase, renal interstitial fibroblasts, proliferation, cell cycle, trichostatin A, signal transducer and activator of transcription 3
Introduction
Chronic kidney disease (CKD) is characterized by accumulation of a large population of myofibroblasts and excessive amount of extracellular matrix (ECM) [Deelman and Sharma, 2009; Wynn, 2008]. As the myofibroblast is a principal effector cell type responsible for production of ECM protein under various kidney diseases associated with renal interstitial fibrosis, Identification of the major mediator(s) that controls cell proliferation would offer new therapeutic approaches for halting progression of renal disease.
Increasing evidence indicates that activation of histone deacetylases (HDACs) is required for the regulation of gene expression and cell proliferation [Mai et al., 2005]. HDACs are a group of enzymes that catalyze the deacetylation of lysine residues in histones and in a number of non-histone proteins associated with cell proliferation such as tyrosine kinase and transcriptional factor 3 (STAT3) [Yuan et al., 2005]. In mammals, there are 18 HDACs, which are grouped into four classes. Class I HDACs include HDAC1, −2, −3, and −8; class II HDACs include HDAC4, −5, −6, −7, −9, and −10; class III HDACs are known as sirtuins; and class IV HDAC is HDAC11 [Beumer and Tawbi,; Bieliauskas and Pflum, 2008]. Among HDACs, HDAC1 and HDAC2 have been reported to require for organ development and proliferation of embryonic stem cells and embryonic fibroblasts [Zimmermann et al., 2007; Zupkovitz et al., 2006]. HDAC inhibitors, such as trichostatin A (TSA), inhibit the activity of both class I and class II HDACs and are effective in suppressing cell cycle progression and cell proliferation in numerous cell types [Bieliauskas and Pflum, 2008]. Recent studies showed that treatment with SK-7041, a selective inhibitors of class I HDACs [Hinkle et al., 2004], had a similar anti-proliferative effect as the class I/II HDAC inhibitors did [Lee et al., 2006], suggesting that class I HDACs play a dominant role in the progression of fibrosis.
Cellular proliferation is an ordered, tightly regulated process involving growth factor-controlled expression of multiple cell cycle proteins. Of them, cyclins and their catalytic partners cyclin-dependent kinases (CDKs) are positive regulators [Golias et al., 2004] and the cyclin kinase inhibitors (CKIs) such as p27 and p57 are negative regulators [Golias et al., 2004]. Whereas cyclin D1 is critically involved in promotion of G1-S phase cell cycle transition, p27 and p57 inhibit the cell cycle at multiple checkpoints through inactivation of cyclin-CDK complexes [Golias et al., 2004]. As such, increased expression of cyclins and decreased expression of p27 and p57 are associated with cell proliferation. It has been documented that inhibition of the HDAC activity with TSA decreased expression of cyclin D1 [Alao et al., 2004] and increased expression of p57 and results in cell cycle arrest [Yamaguchi et al.]. Furthermore, HADC1 and HDAC2 can be directly bound to the promoter regions of the p57 gene and suppresses their expression [Yamaguchi et al.], suggesting that HDAC1 and HDAC2 can directly regulate expression of some CKIs. While it is unknown whether HDACs directly regulate the expression of cyclin D1, our recent studies showed that inactivation of the HDAC activity with TSA blocked phosphorylation/activation of STAT3, a transcriptional factor that drives expression of cyclin D1 [Pang et al., 2009], suggesting that HDACs may regulate cyclin D1 through an indirect mechanism involving activation of STAT3.
STAT3 belongs to a family of tyrosine kinase and transcriptional factors that consists of seven members (STAT1-4, 5a/b, 6) [Bowman et al., 2000; Song and Grandis, 2000]. In response to a variety of growth factors and hormones, STATs are phosphorylated, dimerized and then translocated to the nucleus, where they binds to the DNA promoter region of target genes to drive expression of many genes [Rossi et al., 2007]. In addition to tyrosine-phosphorylation, STAT3 and some other STAT proteins such as STAT1 are also subjected to regulation by acetylation [Pang et al., 2009; Yuan et al., 2005]. While the functional significance of STAT3 acetylation remains poorly understood, it was reported that acetylation of STAT1 counteracts its activity by forming a complex with T-cell protein tyrosine phosphatase (TCP45) [Kramer et al., 2009].
Currently, little is known about the role of HDACs in the regulation of fibroblast proliferation and expression of cell cycle regulators. The purpose of this study aimed to determine the role of the class I HDACs, in particular, HDAC1 and HDAC2 in these processes. Furthermore, we examine the role of STAT3 in HDAC-mediated cell proliferation.
Materials and Methods
Materials
Trichostatin A was purchased from Biomol (Plymouth Meeting, PA). Antibodies to phospho-STAT3 (Tyr-705), STAT3 and cyclin D1 were purchased from CellSignaling Technology (Danvers, MA). Antibodies to HDAC1, HDAC2, p27, p57 and GAPDH were obtained from Santa Cruz Biotechnology,Inc. (Santa Cruz, CA). Pre-designed siRNAs targeting HDAC1 and HDAC2 and silencer negative control siRNA were purchased from Invitrogen. pcDNA3 empty vector, STAT3 plasmid (pcDNA3-STAT3) and anti-acetyl-STAT3 (K685) were obtained from Dr. Eugene Chin (Brown University). Antibodies to α-actin and all other chemicals and reagents werepurchased from Sigma (St. Louis, MO).
Cell culture
Normal rat renal interstitial fibroblasts (NRK-49F) and STAT3−/− mouse embryonic fibroblasts (MEFs) were grown in DMEM (Sigma-Aldrich, St. Louis, MO) containing 5% fetal bovine serum (FBS), 0.5% penicillin and streptomycin in an atmosphere of 5% CO2 air at 37°C. For proliferation study, cells were seeded in 12-well plates. 30–40% confluent cells were starved for 24 h in DMEM with 0.5% FBS prior to receiving stimulation with 5% FBS. If necessary, various pharmaceutical inhibitors were added to the culture and then incubated for an additional 24 or 48 h. Control cells were treated with an equivalent amount of vehicle.
Cell proliferation
Cell proliferation was assessed by counting cells, the MTT (3-(4,5-dimethylthiazol-2-yl)-2,5-diphenyltetrazolium bromide) assay and BrdU incorporation assay. For counting cell numbers, at least five pictures from each well of a 12-well plate were taken and cell numbers in five wells were counted for a sample under the microscope. For the MTT assay, MTT was added (final concentration, 0.5 mg/ml) to individual cultures for 1 h at the end of experiments. Tetrazolium was released by dimethyl sulfoxide, and the optical density was determined with a Spectramax M5 plate reader (Molecular Devices Corporation, Sunnyvale, CA) at 570 nm. For the BrdU incorporation assay, a colorimetric BrdU cell proliferation enzyme-linked immunosorbent assay kit (Roche Applied Science, Penzberg, Germany) was used according to our previous protocols [Xing et al., 2008]. Briefly, BrdU labeling solution was added to cells and then incubated for 4 h. At the end of incubation, the labeling medium was removed, the cells were fixed, and the DNA was denatured. After addition of the anti-BrdU-peroxidase conjugate, the immune complexes were detected by subsequent reaction with tetramethylbenzidine as substrate for 20 min. The reaction product was quantified using a Spectramax M5 plate reader.
Transfection of siRNA or plasmisds into cells
The siRNA oligonucleotides targeted specifically to HDAC1 or HDAC2 (200 pmol) were transfected into NRK-49F cells (1×10⁶) using the Amaxa Cell Line Nucleofector Kit T (Lonza Cologne AG, Cologne, Germany) and the Amaxa Nucleofector device according to the manufacturer’s instructions (Gaithersburg, MD). In parallel, 200 pmol silencer negative control siRNA was used for off-target changed in NRK-49F cells. pcDNA3 empty vector and STAT3 plasmid (pcDNA3-STAT3) were transfected by lipofectamine 2000. After transfection, cells were plated and cultured for 48 h in DMEM before cell lysates were prepared for immunoblot analysis.
Western blot analysis
Cell samples were prepared in lysisbuffer (Cell Signaling Technology, Dancers, MA) containing protease inhibitors cocktail (Roche Diagnostic Co. Indianapolis, IN), 1 mM phenylmethanesulphonylfluoride, and phosphatase inhibitors (2 mM Na3VO4). After sonication and centrifugation, supernatants were collected, and the protein concentration was determined using the BCA protein assay kit (Pierce, Rockford, IL). Twenty micrograms of proteinfrom each sample was separated by SDS-PAGE and transferred to a polyvinylidene difluoride (PVDF) membrane (Millipore, Bedford, MA). After treatment with 5% skim milk at 4°C overnight, membranes were incubated with various antibodies for 1 h or longer time and then incubated with an appropriate horseradish peroxidase-conjugated secondary antibody (Santa Cruz Biotechnology Inc., Santa Cruz, CA). Bound antibodies were visualized following chemiluminescence detection on autoradiographic film. The densitometry analysis of immunoblot results was conducted using Image J software (http://rsb.info.nih.gov/ij) based on the manufacture’s instruction. Briefly, after development, the film was scanned to obtain the digital image. The quantification of immunoblot is based on the intensity (density) of band, which is calculated by area and pixel value of the band. The quantification data are given as ratio between target protein and loading control.
Immunofluorescent analysis
Cells cultured on cover slips were washed with phosphate buffered saline (PBS), fixed with 4% paraformaldehyde, permeabilized with 0.1% (vol/vol) TritonX-100 and 0.1 mM glycine, and then incubated 30 min in PBS containing 5% serum. Cells were then treated with primary antibodies at room temperature for 1 hr. After washing with PBS, cells were incubated with a mixture of FITC-labeled goat anti-rabbit IgG antibody for 1 h at room temperature. Morphological analysis was performed by using light and fluorescent microscopy.
Statistical analysis
Data are presented as means ± SD and were subjected to one-way ANOVA. Multiple means were compared by using Tukey’s test. The differences between two groups were determined by Student t-test. P < 0.05 was considered as statistically significant difference between mean values.
Results
HDAC activity is required for the proliferation of renal interstitial fibroblasts and the expression of cell cycle proteins
To determine the role of HDACs in proliferation of renal interstitial fibroblasts, we treated NRK49-F cells with TSA, a potent and reversible inhibitor of HDACs [Monneret, 2005], in the complete medium containing 5% FBS. Cell proliferation was assessed by directly counting the number of cells and measuring by the MTT as well as BrdU incorporation assays. Treatment with TSA significantly decreased proliferation of NRK49-F (Figure 1A, B, D). This inhibitory effect of TSA occurred in a dose dependent manner with the significant effect at 25 nM and the maximum inhibition at 100 nM (Figure 1C). These data, together with our recent results showing that 25–100 nM TSA can inhibit the deacetylase activity of HDAC [Pang et al., 2009], suggest that the HDAC activity is required for the proliferation of renal interstitial fibroblasts.
Figure 1. Effect of TSA on proliferation of renal interstitial fibroblasts and expression of cell cycle proteins.
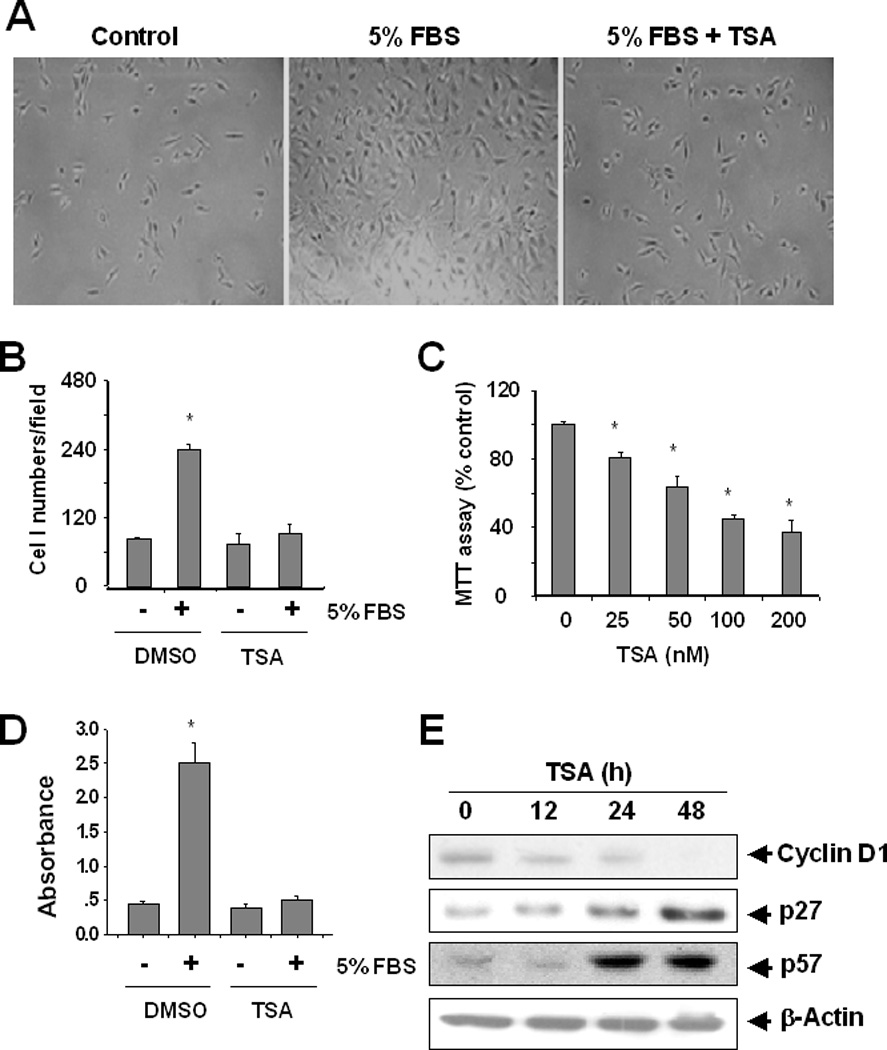
NRK-49F cells were serum-starved for 24 h (control) and then incubated in the DMEM with 5% FBS for 48 h in the absence or presence of 100 nM TSA. Phase contrast photographs (200 X) showing the effect of TSA on cell proliferation (A). Cell proliferation was assessed by counting cells (B). NRK-49F cells were incubated with 5% FBS for 48 h in the presence or absence of the indicated concentrations of TSA and proliferation was assessed by the MTT assay (C) and a BrdU incorporation assay (D). NRK-49F cells were cultured in the DMEM with 5% FBS for the indicated time and cell lysates were subjected to immunoblot analysis with antibodies against cyclin D1, p27, or p57 (F). Values are means ± S.D. from 3 independent experiments. Bars with * are significantly different from controls (P < 0.05).
Cell proliferation is controlled by expression of cell cycle proteins. Up-regulation of cycle D1 and down-regulation CDK inhibitors such as p27 and p57 are associated with the progression of the cell cycle [Golias et al., 2004]. To understand whether activation of HDACs contributes to the expression of those proteins, NRK-49F were incubated with 100 nM TSA for 12, 24 and 48 h, and then harvested for immunoblot analysis of cyclin D1, p27 and p57. As shown in Figure 1E, the expression level of cyclin D1 was seen at 12 h following TSA treatment. At 48 h, cyclin D1 was no longer detectable. In contrast, p27 and p57 expression was increased over time with the maximum at 48 h. These data illustrated that all of those cycle proteins are subjected to regulation by HDACs in renal interstitial fibroblasts.
Expression of HDAC1 and HDAC2 in renal interstitial fibroblasts
Recent studies showed that SK-7041, a selective inhibitor of class I HDACs, exhibited an anti-proliferative effect similar to that of the class I/II HDAC inhibitors did [Lee et al., 2006], and that HDAC1 and HDAC2 are required for organ development and proliferation of embryonic stem cells and embryonic fibroblasts [Zimmermann et al., 2007; Zupkovitz et al., 2006]. As a first step towards understanding the role of HDAC1 and HDAC2 in renal fibroblast proliferation, we examined HDAC1 and HDAC2 expression in NRK-49F cells. Immunoblot analysis indicated that HDAC1 and HDAC2 were abundantly expressed in renal interstitial fibroblasts (Figure 2A). Immunofluorescent staining demonstrated a nuclear localization for HDAC1 and both nuclear and cytosolic distribution for HDAC 2 in serum-starved NRK-49F cells. After treatment with 5% FBS, both HDAC1 and HDAC2 were only observed in the nucleus (Figure 2B). These data suggest that HDAC1 and HDAC2 are expressed in renal interstitial fibroblasts and that stimulation with mitogens can induce translocation of HDAC2 from the cytosol to the nucleus.
Figure 2. Expression of HDAC 1 and 2.
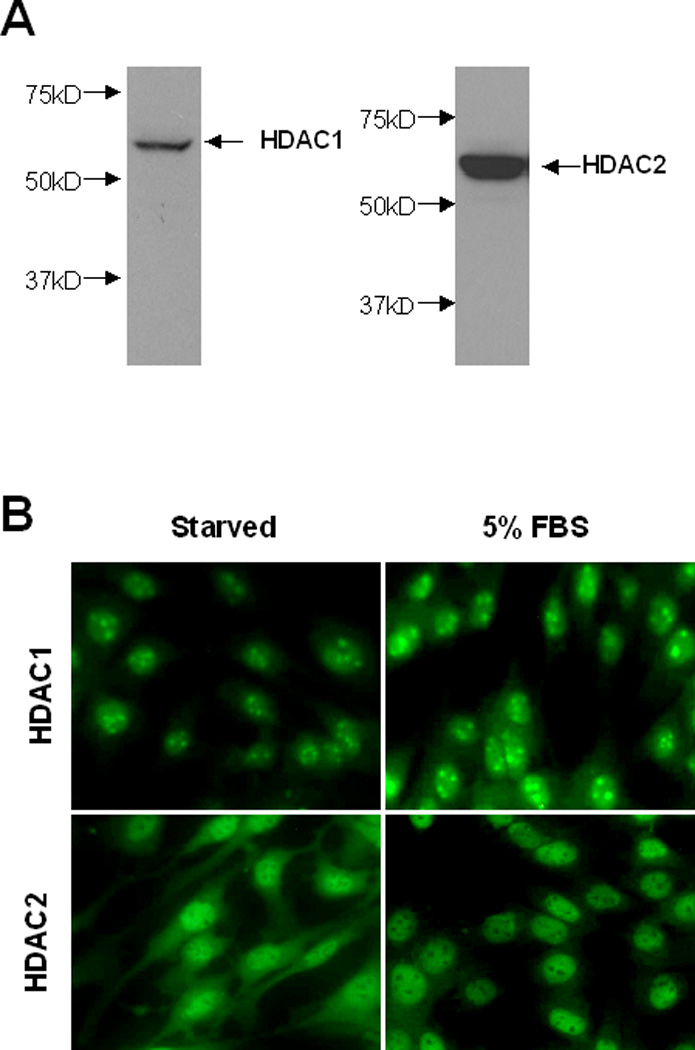
(A) Cultured NRK-49F cells were harvested and cell lysates were subjected to immunoblot analysis with antibodies against HDAC1 and HDAC2. Representative immunoblots from 3 or more experiments are shown (1X200). (B) Cultured NRK-49F cells were seeded on the cover slips and then starved for 24 h with 0.5% FBS. After treatment with 5% FBS for an additional 1 h, cells were harvested for staining with antibodies to HDAC1 or HDAC2.
HDAC1 and HDAC2 knockdown decreases the proliferation of renal interstitial fibroblasts
To determine the role of HDAC1 and HDAC2 in renal fibroblast proliferation, the siRNA approach was used. NRK-49Fcells were transfected with siRNA specifically targeting HDAC 1 and HDAC2. At 48 h after transfection, cell proliferation was analyzed by both cell counting and the MTT assay. Figure 3A and 3B showed that knockdown of either HDAC1 or HDAC2 significantly inhibited proliferation of NRK-49F. Immunoblot analysis indicated that expression levels of HDAC 1 and HDAC2 are inhibited by 70%, 75%, respectively, in cells transfected with HDAC 1 or HDAC2 siRNA relative to those transfected with scrambled siRNA. These data suggest that both HDAC1 and HDAC2 are involved in the regulation of renal fibroblast proliferation.
Figure 3. Effect of siRNAs specific to HDAC1 and HDAC2 on the proliferation of renal interstitial fibroblasts.
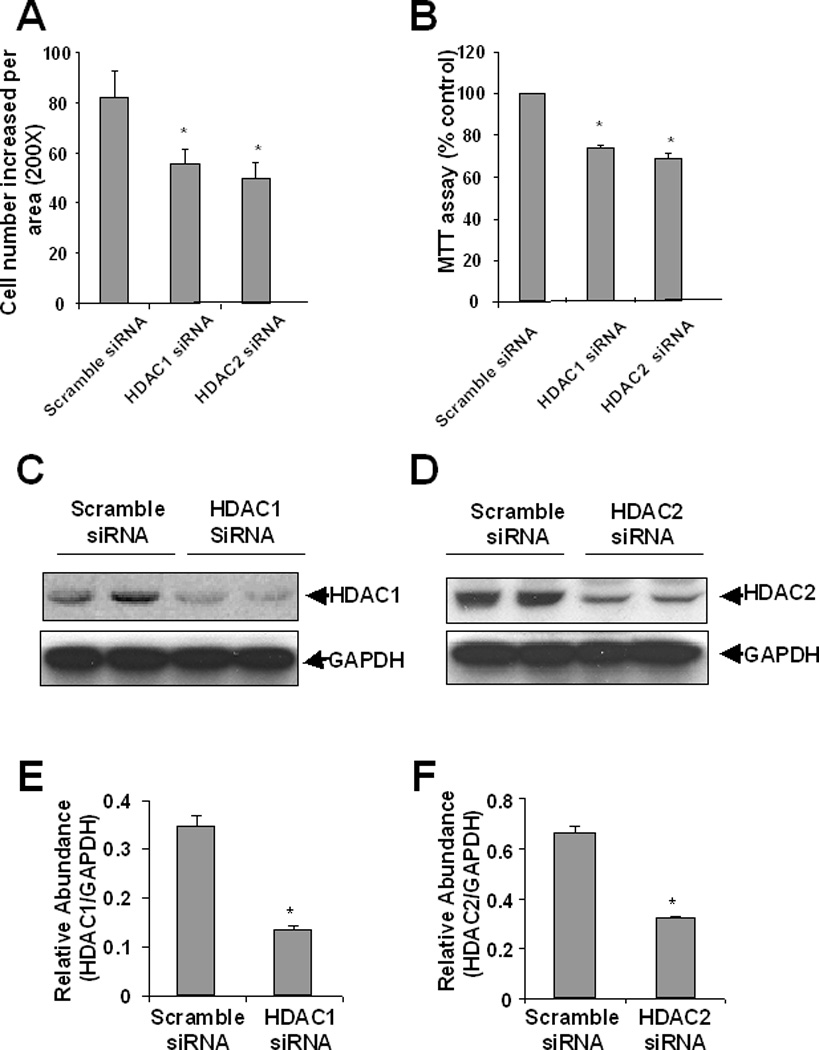
NRK-49F cells were transfected with scrambled siRNA or siRNA specific to HDAC1 and HDAC2, respectively and incubated for 48 h in DMEM with 5% FBS. Cell proliferation was determined by cell counting (A), and the MTT assay (B). Cells were harvested and cell lysates were subjected to immunoblot analysis with antibodies to HDAC1, HDAC2 or GAPDH. Representative immunoblots from 3 or more experiments are shown (C, D). Expression levels of HDAC1, HDAC2 in different groups were quantified by densitometry and normalized with GAPDH (E, F). Data are expressed as means ± S.D. Bars with * are significantly different from controls (p<0.05).
HDAC2 and HDAC1 knockdown differentially regulates the expression of cycle proteins
We further examined the effect of HDAC1 and HDAC2 down-regulation on the expression of cyclin D1, p27, and p57 using siRNA approach. Figure 4 showed that knockdown of either HDAC1 or HDAC2 decreased the expression of cyclin D1 and increased expression of p57. However, increased protein abundance of p27 was only observed in cells with silencing of HDAC2. Therefore, we suggest that expression of cyclin D1 and p57 are under control by both HDAC1 and HDAC2, and expression of p27 is only regulated by HDAC2.
Figure 4. Effect of siRNA specific to HDAC1 and HDAC2 on the expression of cell cycle proteins in renal interstitial fibroblasts.
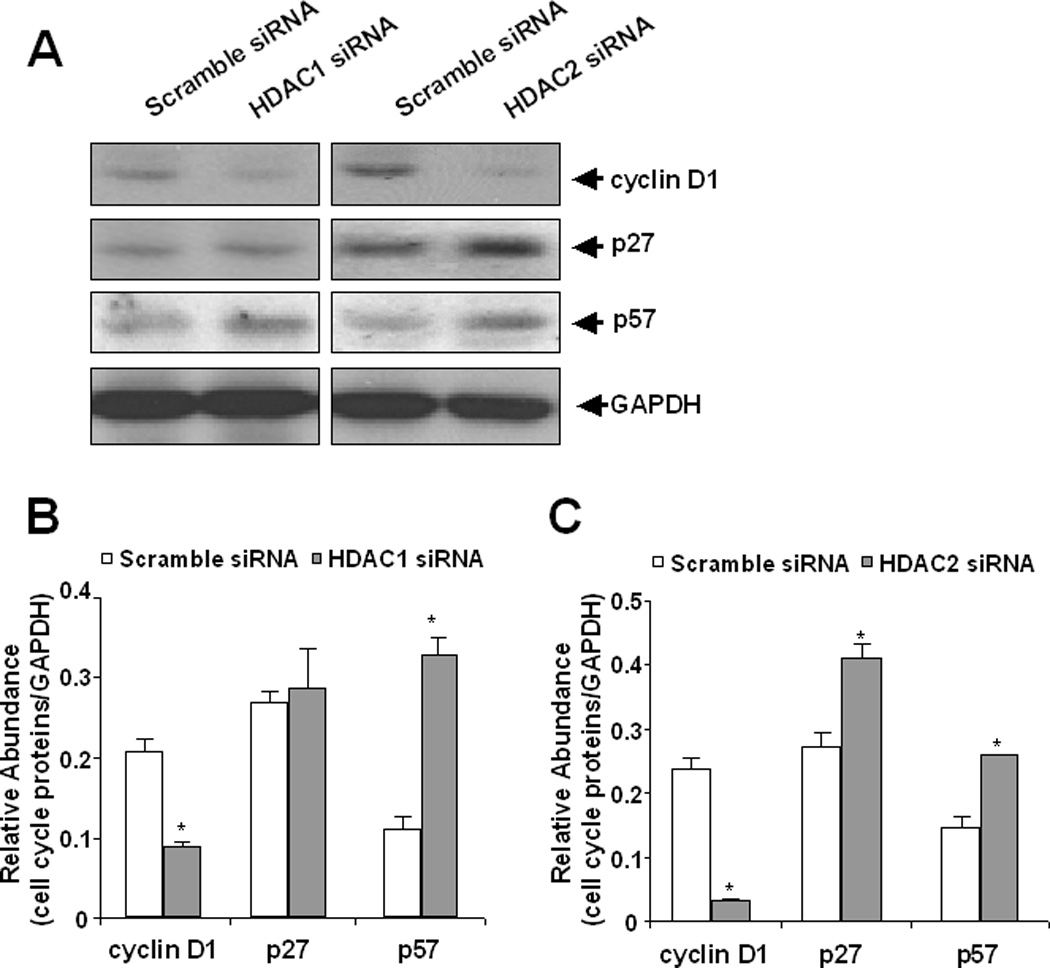
NRK-49F cells were transfected with scrambled siRNA or siRNAs specific to HDAC1 and HDAC2, respectively and then incubated for 48 h in DMEM with 5% FBS. Cells were harvested and cell lysates were subjected to immunoblot analysis with antibodies to cyclin D1, p27, p57 or GAPDH. Representative immunoblots from 3 or more experiments are shown (A). Expression levels of cyclin D1, p27 and p57 in different groups were quantified by densitometry and normalized with GAPDH (B, C) Data are expressed as means ± S.D. Bars with * are significantly different from controls (p<0.05).
Serum-induced STAT3 phosphorylation is regulated by HDAC1 and HDAC2
Our recent studies showed that inhibition of HDACs by TSA inhibits STAT3 phosphorylation [Pang et al., 2009]. Here we further examined the effect of HDAC 1 and HDAC2 down-regulation on the phosporylation of STAT3 at Tyr705, an active form of STAT3. As shown in Figure 5, knockdown of either HDAC 1 or HDAC2 reduced STAT3 phosphorylation and increased its acetylation levels. Interestingly, down-regulation of these two HDAC isozymes also decreased expression of total STAT3. However, the densitometry analysis on immunoblots showed that cells transfected with either HDAC1 or HDAC2 siRNA have a lower ratio of p-STAT3/total STAT3 compared with that in the scramble siRNA transfected cells, suggesting that p-STAT3 reduction in cells with knocking down of HDAC1 or HDAC2 siRNA is at least in part due to alteration in the rate of phosphorylation. Collectively, these data suggest that both HDAC1 and HDAC2 are required for regulation of STAT3 phosphorylation, acetylation, and expression in renal interstitial fibroblasts.
Figure 5. Effect of siRNA specific to HDAC1 and HDAC2 on the expression of phopshorylated STAT3, acetylated STAT3 and STAT3.
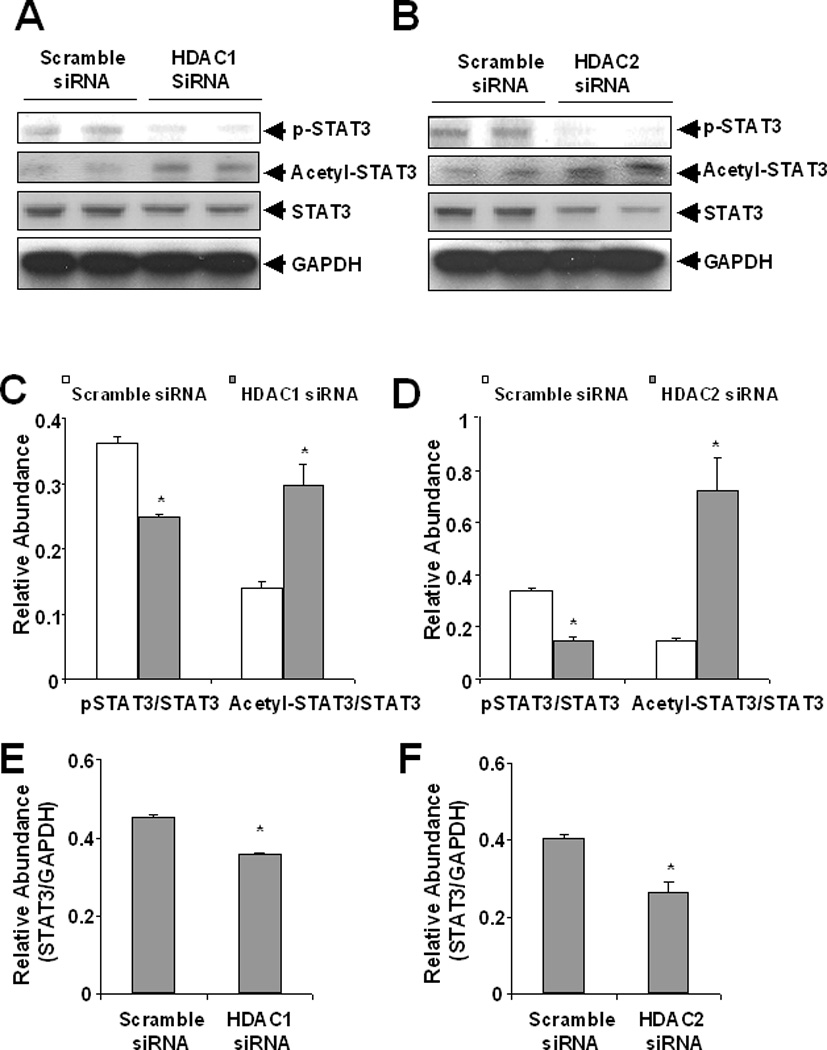
NRK-49F cells were transfected with scrambled siRNA or siRNA specific to HDAC1 and HDAC2, respectively and then incubated for 48 h in DMEM with 5% FBS. Cells were harvested and cell lysates were subjected to immunoblot analysis with antibodies to phospho-STAT3 at Tyr-705 (p-STAT3), acetyl-STAT3 at Lys685 (acetyl-STAT3), STAT3 or GAPDH. Representative immunoblots from 3 experiments are shown (A, B). Expression levels of those proteins in different groups were quantified by densitometry and normalized with total STAT3 or GAPDH as indicated (C, D, E, F). Data are expressed as means ± S.D. Bars with * are significantly different from controls (p<0.05).
STAT3 mediates proliferation of renal interstitial fibroblasts
To determine the role of STAT3 in proliferation of renal fibroblasts, we first examined the effect of S3I-201, a specific inhibitor of STAT3 on the proliferation of NRK-49F. S3I-201 inhibited proliferation of NRK-49F in dose and time dependent manners with initial inhibition at 25 µM and maximal inhibition at 100 µM (Figure 6A, B). Our recent studies have demonstrated that S3I-201 completely blocked STAT3 phosphorylation at 100 µM [Pang et al.]. Next, we examined the effect of siRNA-mediated STAT3 knockdown on the proliferation of renal interstitial fibroblasts. Transfection of STAT3 siRNA led to a significant decrease in the expression of STAT3 (Figure 6E and F) and proliferation of NRK-49F (Figure 6C and D). However, expression levels of HDAC1 and HDAC2 were not affected by STAT3 down-regulation (Figure 6C and D). These results suggest that STAT3 may mediate the proliferation of renal interstitial fibroblasts by acting downstream of HDAC1 and HDAC2.
Figure 6. Effect of STAT3 inhibition on the proliferation of renal fibroblasts.
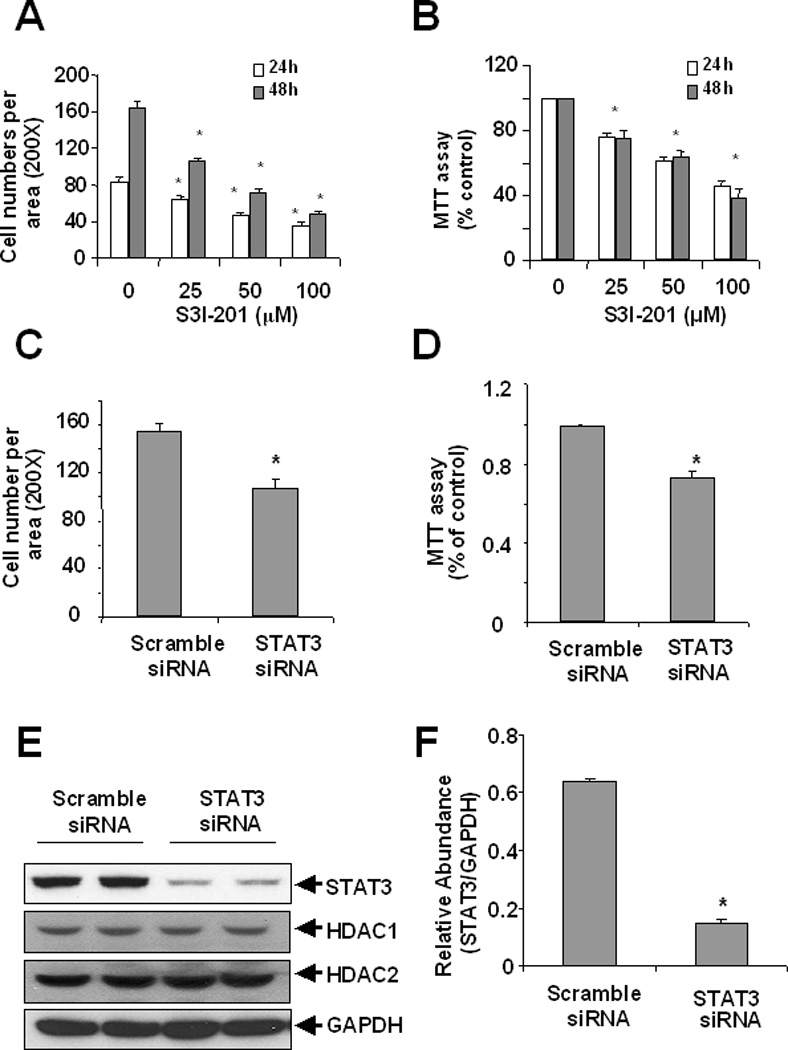
NRK-49F cells were incubated with 50 µM S3I-201 in the indicated doses for 24 or 48 h (A, B) or. transfected with scrambled siRNA or siRNA specific to STAT3, respectively and then incubated for 48 h in DMEM with 5% FBS (C, D). Cell proliferation was assessed by counting cells (A, C) and the MTT assay (B, D). Cell lysates were subjected to immunoblot analysis with antibodies to STAT3, HDAC1, HDAC2 or GADPH (E). Representative immunoblots from 3 or more experiments are shown. Expression levels of STAT3 in different groups were quantified by densitometry and normalized with GAPDH (F). Data are expressed as means ± S.D. Bars with *are significantly different from controls (p<0.05).
STAT3 is required for HADC-elicited proliferation of renal interstitial fibroblasts
If STAT3 acts downstream of HDACs to mediate renal fibroblast proliferation, the inhibitory effect of TSA on renal fibroblasts should be decreased in cells lacking STAT3 and add-back of STAT3 should restore the inhibitory ability of TSA. To test this hypothesis, we treated the wild type (STAT3+/+) or STAT3 deficient (STAT3−/−) mouse embryonic fibroblasts (MEFs) with TSA and then determined their proliferation by the MTT assay. TSA decreased cell proliferation by 52% in STAT3+/+ MEFs. In contrast, TSA only decreased proliferation by 25% in STAT3−/− cells (Figure 7A). As expected, re-introduction of wild type STAT3 to STAT3−/− cells led to the restoration of the ability of TSA to inhibit the proliferation of MEFs (Figure 7B). Similar results were obtained when cell numbers were counted (data not show). The expression level of total STAT3 in STAT3−/− MEFs after STAT3 transfection was the similar to that in STAT3+/+ MEF (Figure 7C and D). These data indicated that TSA-mediated inhibition of proliferation depends upon the presence of STAT3 in fibroblasts.
Figure 7. Effect of TSA on cell proliferation in STAT+/+ and STAT3−/− MEFs.
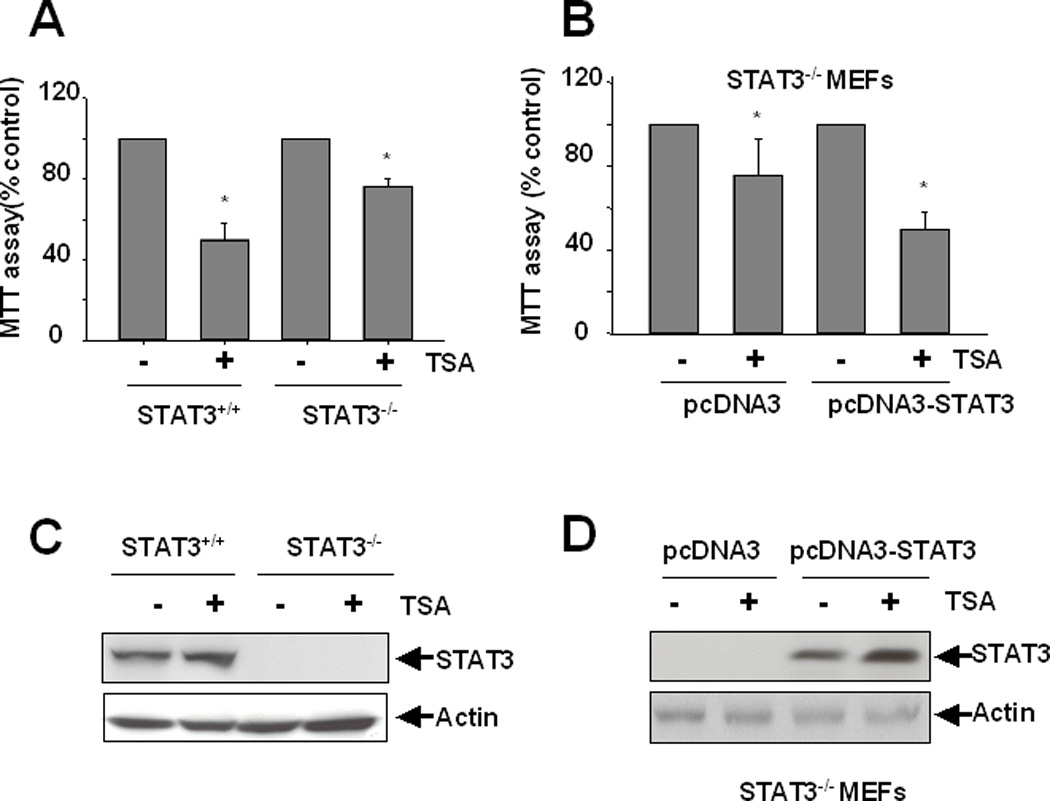
A) STAT3 wild type (STAT3+/+) and STAT3 knockout (STAT3−/−)MEFs were incubated with 100 nM TSA for 48 h and cell proliferation was assessed by the MTT assay. (B) STAT3−/− MEF were transfected with pcDNA3 empty vector or STAT3 plasmid (pcDNA3-STAT3) by lipofectamine. At 48 h after transfection, cells were incubated with 100 nM TSA for an additional 48 h and cell proliferation was measured by the MTT assay. Data are expressed as means ± SD. Bars with * are significantly different from controls (p<0.05). Cell lysates were subjected to immunoblot analysis with antibodies to STAT3 or Actin (C, D).
Discussion
In this report, we demonstrated that either inhibition of the HDAC activity with TSA or specific silencing of major class 1 HDAC1 and HDAC2 enzymes with siRNA decreased proliferation of cultured renal interstitial fibroblasts and expression of cell cycle proteins. Moreover, we showed that both HDAC1 and HDAC2 mediates activation of STAT3 and that STAT3 plays an essential role in mediating the action of HDACs. These results, together with our recent studies showing the requirement of the HDAC activity in activation of renal interstitial fibroblasts [Pang et al., 2009], suggest that HDACs, particularly of HDAC1 and HDAC2, are involved in the development of renal interstitial fibrosis.
Although all the class I and II HDAC isoforms are sensitive to TSA, HDAC1 and HDAC2 are reported to be the major HDACs implicated in tissue development and cell proliferation. Genetic studies revealed that gene disruption of HDAC1 led to severe developmental defects and reduced proliferation both in the mouse embryo and in embryonic stem (ES) cells [Zupkovitz et al., 2006]. Inactivation of HDAC2 also delayed growth in mice, leading to smaller and less fertile animals than wild-type and heterozygous littermates [Zimmermann et al., 2007]. Recently, Yamaguchi et al., demonstrated that both HADC1 and HADC2 are required for the proliferation of mouse embryonic fibroblasts [Yamaguchi et al.]. Our studies indicated that HDAC1 and HDAC2 are abundantly expressed in cultured renal fibroblasts and that silencing either of them significantly decreases proliferation of NRK-49F, which supports involvement of these two HDAC isoforms in renal interstitial fibroblasts.
HDAC-mediated proliferation of renal fibroblasts is associated with down-regulation of CKIs (i.e. p27 and p57) and up-regulation of cyclin D1. In this study, we examined the effect of HDAC1 and HDAC2 down-regulation on the expression of cyclin D1, p27 and p57 in renal fibroblasts. Although knockdown of either HDAC1 or HDAC2 significantly increased expression of p57, sliencing of HDAC2, but not HDAC1 resulted in an increased protein level of p27. In addition to CKD inhibitors, siRNA-mediated silencing of HDAC1 and HDAC2 decreased protein abundance of cyclin D1, a key regulator that promotes S phase entry in the cell cycle. In line with our observation, HDAC1 and HDAC2 have been reported to promote the G1-to-S-phase transition by inhibiting the expression of p57 in MEFs [Yamaguchi et al.], and inhibition of the HDAC activity with TSA decreased the expression of p27 in rat mesangial cells [Freidkin et al.]. Since cyclin D1 is a positive regulator of the cell cycle whereas p27 and p57 are negative regulators of the cell cycle [Golias et al., 2004], the coordinate regulation of expression of those proteins by HDAC1 and HDAC2 may accelerate the cell cycle progression in renal fibroblasts.
Currently, the mechanism by which HDAC1 and HDAC2 differently regulates p27 expression remains unclear. A previous study showed that the enforcement of elevated p27 protein levels by HDAC-inhibitors is not due to changes in the level of p27 transcript but associated with the post-translational mechanism, mainly p27 stability [Chen and Faller, 2005]. As p27 stability is typically regulated by proteolytic degradation through the ubiquitin-proteasome pathway [Freytag and Geddes, 1992; Hengst and Reed, 1996; Shirane et al., 1999; Vlach et al., 1997], it is possible that HDAC2, but not HDAC1, plays a role in regulating activation of this pathway. This hypothesis will be tested in our future studies.
An interesting observation is that knocking down of either HDAC1 or HDAC2 reduces STAT3 phosphorylation at Tyr 705 in renal fibroblasts. As STAT3 phosphorylation at this residue is required for its dimerization and activation, we suggest that these HDAC isoforms play an important role in regulation of STAT3 activation. Furthermore, as cyclin1 is one of the STAT3 transcriptional targets, it is possible that HDACs-mediated STAT3 activation is functionally linked to proliferation of renal fibroblasts. This hypothesis is supported by our observations that inhibition of STAT3 with S3I-201 or specific siRNA decreased proliferation of renal interstitial fibroblasts and that deletion of STAT3 alleviated the inhibitory effect of TSA on cell proliferation in MEFs whereas re-introduction of STAT3 to STAT3−/− MEFs restored the ability of TSA to inhibit fibroblast proliferation. Therefore, it seems that STAT3 acts as an intermediary molecule in HDACs regulation of cyclin D1 expression. Nevertheless, the STAT3 signaling pathway may not be the sole one that mediates the expression of cyclin1 by HDACs. Previous studies have indicated that TSA–mediated suppression of cyclin D1 expression is involved in the decreased NF-kappaB/DNA binding [Hu and Colburn, 2005] and ubiquitin-dependent degradation [Alao et al., 2006]. Further studies are necessary to elucidate the molecular basis by which STAT3 coordinates with NF-kappaB/p65 and ubiquitins to regulate cyclin D1 expression.
The detailed mechanism by which HDAC1/2 inhibition reduces STAT3 tyrosine phosphorylation remains poorly understood, but may be associated with acetylation. Our previous and current studies showed that dephosphorylation of STAT3 by TSA or siRNAs targeting HDAC1 or HDAC2 was accompanied by STAT3 hyperacetylation. Similar reciprocal alterations in tyrosine phosphorylation and acetylation were also observed in STAT1 after inhibition of the HDAC activity in a variety of cell types [Klampfer et al., 2004; Nusinzon and Horvath, 2003]. Recently, Krämer et al. reported that STAT1 acetylation can induce its binding to T-cell protein tyrosine phosphatase (TCP45), which catalyzed STAT1 dephosphorylation [Kramer et al., 2009]. On this basis, they proposed a model to explain the mechanism by which STAT1 acetylation counteracts its phosphorylation: Acetylation of STAT1 leads to the formation of a complex with the T-TCP45 and the highly active PTP TCP45 acts as a “transmission control protein” docking to and inhibiting previously activated STAT1 [Kramer et al., 2009]. Whether this functional phospho-acetyl switch, regulated by an acetylation/deacetylation balance, also modulates STAT3 phosphorylation needs further investigation.
In summary, we demonstrated that HDAC1 and HDAC 2 play an important role in regulating proliferation of renal interstitial fibroblasts and expression of multiple cell cycle proteins. Further, HDAC1 and HDAC 2 contribute to modulation of STAT3 tyrosine phosphorylation/activation and STAT3 mediates the proliferative effect of HDACs. Inhibition of HDAC1/2 promotes STAT3 acetylation. Acetylated STAT3 leads to its dephosphorylation/inactivation and subsequently antagonizes transcriptional regulation of the target genes associated with cell cycle regulation and proliferation (Figure 8). These findings suggest that targeting HDAC1/2 may be a promising strategy to attenuate progression of kidney diseases associated with renal fibrosis.
Figure 8. Model of HDAC1/2-mediated STAT3 activation and renal fibroblast proliferation.
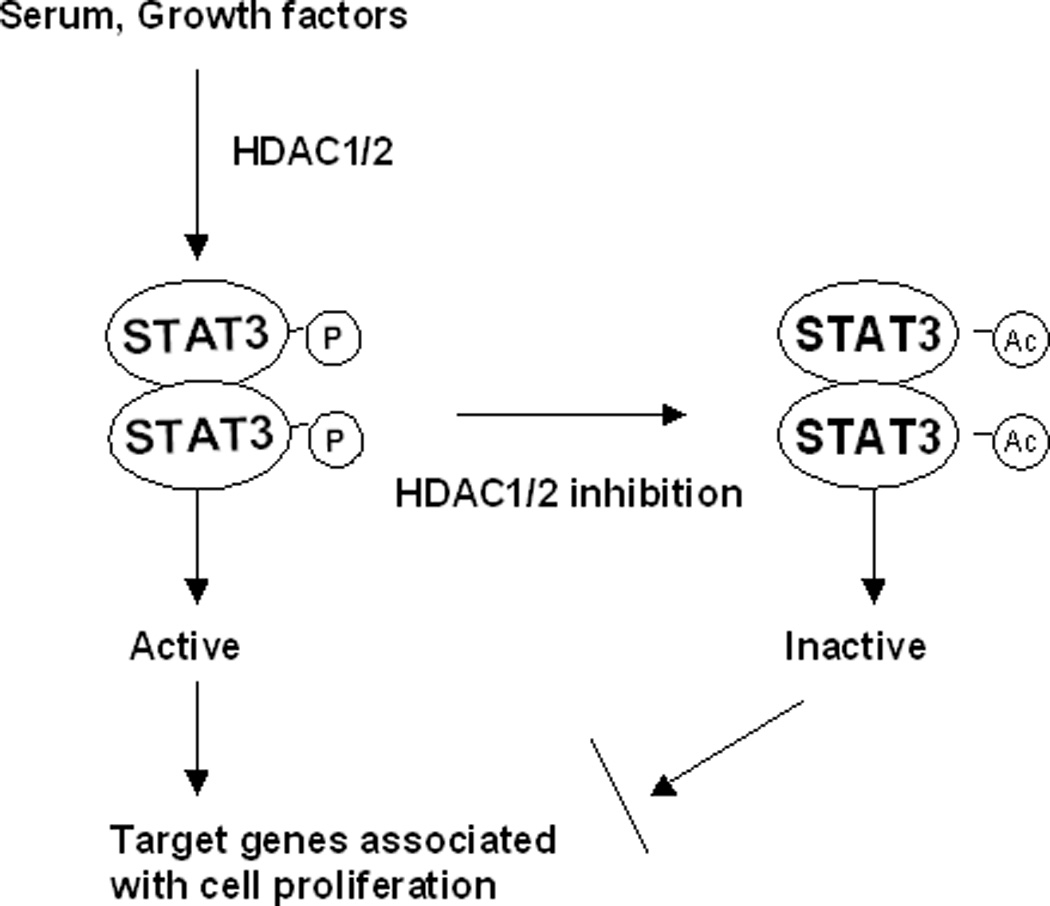
Serum-cultured renal fibroblasts contain activated HDAC1/2, which is required for induction of STAT3 tyrosine phosphorylation and activation via catalyzing deacetylation. The phosphorylated STAT3 is translocated into the nucleus, where it regulates transcription of the target genes associated with cell cycle progression and cellular proliferation. Inhibition of HDAC1/2 by either its inhibitor or siRNA leads to an increase in STAT3 acetylation. A switch from phosphorylated to acetylated STAT3 may lead to its dephosphorylation/inactivation via acetylation-dependent recruitment of the highly active tyrosine phosphatase (i.e. TCP 45) as described for the regulation of STAT1 signaling by acetylation (see discussion). As a result, STAT3-dependent cell cycle control and proliferation is suppressed or terminated.
Acknowledgements
This work was supported by a grant from National Institutes of Health (DK-071997, DK-085065).
References
- Alao JP, Lam EW, Ali S, Buluwela L, Bordogna W, Lockey P, Varshochi R, Stavropoulou AV, Coombes RC, Vigushin DM. Histone deacetylase inhibitor trichostatin A represses estrogen receptor alpha-dependent transcription and promotes proteasomal degradation of cyclin D1 in human breast carcinoma cell lines. Clin Cancer Res. 2004;10:8094–8104. doi: 10.1158/1078-0432.CCR-04-1023. [DOI] [PubMed] [Google Scholar]
- Alao JP, Stavropoulou AV, Lam EW, Coombes RC, Vigushin DM. Histone deacetylase inhibitor, trichostatin A induces ubiquitin-dependent cyclin D1 degradation in MCF-7 breast cancer cells. 2006. Mol Cancer. 2006;5:8. doi: 10.1186/1476-4598-5-8. [DOI] [PMC free article] [PubMed] [Google Scholar]
- Beumer JH, Tawbi H. Role of Histone Deacetylases and Their Inhibitors in Cancer Biology and Treatment. Curr Clin Pharmacol. 2010;5:196–208. doi: 10.2174/157488410791498770. [DOI] [PubMed] [Google Scholar]
- Bieliauskas AV, Pflum MK. Isoform-selective histone deacetylase inhibitors. Chem Soc Rev. 2008;37:1402–1413. doi: 10.1039/b703830p. [DOI] [PMC free article] [PubMed] [Google Scholar]
- Bowman T, Garcia R, Turkson J, Jove R. STATs in oncogenesis. Oncogene. 2000;19:2474–2488. doi: 10.1038/sj.onc.1203527. [DOI] [PubMed] [Google Scholar]
- Chen JS, Faller DV. Histone deacetylase inhibition-mediated post-translational elevation of p27KIP1 protein levels is required for G1 arrest in fibroblasts. J Cell Physiol. 2005;202:87–99. doi: 10.1002/jcp.20094. [DOI] [PubMed] [Google Scholar]
- Deelman L, Sharma K : Mechanisms of kidney fibrosis and the role of antifibrotic therapies. Curr Opin Nephrol Hypertens. 2009;18:85–90. doi: 10.1097/MNH.0b013e32831c50a1. [DOI] [PubMed] [Google Scholar]
- Freidkin I, Herman M, Tobar A, Chagnac A, Ori Y, Korzets A, Gafter U. Effects of histone deacetylase inhibitors on rat mesangial cells. Am J Physiol Renal Physiol. 2010;298:F426–F434. doi: 10.1152/ajprenal.00107.2009. [DOI] [PubMed] [Google Scholar]
- Freytag SO, Geddes TJ. Reciprocal regulation of adipogenesis by Myc and C/EBP alpha. Science. 1992;256:379–382. doi: 10.1126/science.256.5055.379. [DOI] [PubMed] [Google Scholar]
- Golias CH, Charalabopoulos A, Charalabopoulos K. Cell proliferation and cell cycle control: a mini review. Int J Clin Pract. 2004;58:1134–1141. doi: 10.1111/j.1742-1241.2004.00284.x. [DOI] [PubMed] [Google Scholar]
- Hengst L, Reed SI. Translational control of p27Kip1 accumulation during the cell cycle. Science. 1996;271:1861–1864. doi: 10.1126/science.271.5257.1861. [DOI] [PubMed] [Google Scholar]
- Hinkle CL, Sunnarborg SW, Loiselle D, Parker CE, Stevenson M, Russell WE, Lee DC. Selective roles for tumor necrosis factor alpha-converting enzyme/ADAM17 in the shedding of the epidermal growth factor receptor ligand family: the juxtamembrane stalk determines cleavage efficiency. J Biol Chem. 2004;279:24179–24188. doi: 10.1074/jbc.M312141200. [DOI] [PubMed] [Google Scholar]
- Hu J, Colburn NH. Histone deacetylase inhibition down-regulates cyclin D1 transcription by inhibiting nuclear factor-kappaB/p65 DNA binding. Mol Cancer Res. 2005;3:100–109. doi: 10.1158/1541-7786.MCR-04-0070. [DOI] [PubMed] [Google Scholar]
- Klampfer L, Huang J, Swaby LA, Augenlicht L. Requirement of histone deacetylase activity for signaling by STAT1. J Biol Chem. 2004;279:30358–30368. doi: 10.1074/jbc.M401359200. [DOI] [PubMed] [Google Scholar]
- Kramer OH, Knauer SK, Greiner G, Jandt E, Reichardt S, Guhrs KH, Stauber RH, Bohmer FD, Heinzel T. A phosphorylation-acetylation switch regulates STAT1 signaling. Genes Dev. 2009;23:223–235. doi: 10.1101/gad.479209. [DOI] [PMC free article] [PubMed] [Google Scholar]
- Lee KW, Kim JH, Park JH, Kim HP, Song SH, Kim SG, Kim TY, Jong HS, Jung KH, Im SA, Kim TY, Kim NK, Bang YJ. Antitumor activity of SK-7041, a novel histone deacetylase inhibitor, in human lung and breast cancer cells. Anticancer Res. 2006;26:3429–3438. [PubMed] [Google Scholar]
- Mai A, Massa S, Rotili D, Cerbara I, Valente S, Pezzi R, Simeoni S, Ragno R. Histone deacetylation in epigenetics: an attractive target for anticancer therapy. Med Res Rev. 2005;25:261–309. doi: 10.1002/med.20024. [DOI] [PubMed] [Google Scholar]
- Monneret C. Histone deacetylase inhibitors. Eur J Med Chem. 2005;40:1–13. doi: 10.1016/j.ejmech.2004.10.001. [DOI] [PubMed] [Google Scholar]
- Nusinzon I, Horvath CM. Interferon-stimulated transcription and innate antiviral immunity require deacetylase activity and histone deacetylase 1. Proc Natl Acad Sci U S A. 2003;100:14742–14747. doi: 10.1073/pnas.2433987100. [DOI] [PMC free article] [PubMed] [Google Scholar]
- Pang M, Kothapally J, Mao H, Tolbert E, Ponnusamy M, Chin YE, Zhuang S. Inhibition of histone deacetylase activity attenuates renal fibroblast activation and interstitial fibrosis in obstructive nephropathy. Am J Physiol Renal Physiol. 2009;297:F996–F1005. doi: 10.1152/ajprenal.00282.2009. [DOI] [PMC free article] [PubMed] [Google Scholar]
- Pang M, Ma L, Gong R, Tolbert E, Mao H, Ponnusamy M, Chin YE, Yan H, Dworkin LD, Zhuang S. A novel STAT3 inhibitor, S3I-201, attenuates renal interstitial fibroblast activation and interstitial fibrosis in obstructive nephropathy. Kidney Int. 2010;78:257–268. doi: 10.1038/ki.2010.154. [DOI] [PubMed] [Google Scholar]
- Rossi G, Viola Magni M, Albi E. Signal transducer and activator of transcription 3 and sphingomyelin metabolism in intranuclear complex during cell proliferation. Arch Biochem Biophys. 2007;464:138–143. doi: 10.1016/j.abb.2007.04.008. [DOI] [PubMed] [Google Scholar]
- Shirane M, Harumiya Y, Ishida N, Hirai A, Miyamoto C, Hatakeyama S, Nakayama K, Kitagawa M. Down-regulation of p27(Kip1) by two mechanisms, ubiquitin-mediated degradation and proteolytic processing. J Biol Chem. 1999;274:13886–13893. doi: 10.1074/jbc.274.20.13886. [DOI] [PubMed] [Google Scholar]
- Song JI, Grandis JR. STAT signaling in head and neck cancer. Oncogene. 2000;19:2489–2495. doi: 10.1038/sj.onc.1203483. [DOI] [PubMed] [Google Scholar]
- Vlach J, Hennecke S, Amati B. Phosphorylation-dependent degradation of the cyclin-dependent kinase inhibitor p27. Embo J. 1997;16:5334–5344. doi: 10.1093/emboj/16.17.5334. [DOI] [PMC free article] [PubMed] [Google Scholar]
- Wynn TA. Cellular and molecular mechanisms of fibrosis. J Pathol. 2008;214:199–210. doi: 10.1002/path.2277. [DOI] [PMC free article] [PubMed] [Google Scholar]
- Xing J, Zhang Z, Mao H, Schnellmann RG, Zhuang S. Src regulates cell cycle protein expression and renal epithelial cell proliferation via PI3K/Akt signaling-dependent and -independent mechanisms. Am J Physiol Renal Physiol. 2008;295:F145–F152. doi: 10.1152/ajprenal.00092.2008. [DOI] [PMC free article] [PubMed] [Google Scholar]
- Yamaguchi T, Cubizolles F, Zhang Y, Reichert N, Kohler H, Seiser C, Matthias P. Histone deacetylases 1 and 2 act in concert to promote the G1-to-S progression. Genes Dev. 2010;24:455–469. doi: 10.1101/gad.552310. [DOI] [PMC free article] [PubMed] [Google Scholar]
- Yuan ZL, Guan YJ, Chatterjee D, Chin YE. Stat3 dimerization regulated by reversible acetylation of a single lysine residue. Science. 2005;307:269–273. doi: 10.1126/science.1105166. [DOI] [PubMed] [Google Scholar]
- Zimmermann S, Kiefer F, Prudenziati M, Spiller C, Hansen J, Floss T, Wurst W, Minucci S, Gottlicher M. Reduced body size and decreased intestinal tumor rates in HDAC2-mutant mice. Cancer Res. 2007;67:9047–9054. doi: 10.1158/0008-5472.CAN-07-0312. [DOI] [PubMed] [Google Scholar]
- Zupkovitz G, Tischler J, Posch M, Sadzak I, Ramsauer K, Egger G, Grausenburger R, Schweifer N, Chiocca S, Decker T, Seiser C. Negative and positive regulation of gene expression by mouse histone deacetylase 1. Mol Cell Biol. 2006;26:7913–7928. doi: 10.1128/MCB.01220-06. [DOI] [PMC free article] [PubMed] [Google Scholar]


