Abstract
With the advent of high resolution ion mobility analyzers and their coupling to ultrahigh resolution mass spectrometers, there is a need to further develop a theoretical workflow capable of correlating experimental accurate mass and mobility measurements with tridimensional candidate structures. In the present work, a general workflow is described for unsupervised tridimensional structural assignment based on accurate mass measurements, mobility measurements, in silico 2D-3D structure generation, and theoretical mobility calculations. In particular, the potential of this workflow will be shown for the analysis of polyaromatic hydrocarbons from Coal Tar SRM 1597a using selected accumulation - trapped ion mobility spectrometry (SA-TIMS) coupled to Fourier transform-ion cyclotron resonance mass spectrometry (FT-ICR MS). The proposed workflow can be adapted to different IMS scenarios, can utilize different collisional cross-section calculators and has the potential to include MSn and IMSn measurements for faster and more accurate tridimensional structural assignment.
Keywords: Ion mobility spectrometry, In silico IMS-MS assignment, SA-TIMS-FTMS, Candidate structure generation, Collision cross section calculation
Introduction
Over the last 20 years, there has been an increase in the use of ion mobility spectrometry (IMS) for rapid analysis and separation of isomers [1–4], biological conformers [5–7], and species of differing chemical classes based on differences in functional groups, polarities, and atomic composition [8, 9]. Most of these efforts have been driven by the development of higher resolution and more sensitive variants of IMS (e.g., periodic focusing DC ion guide [10–12], segmented quadrupole drift cell [13], multistage IMS [14–16], field asymmetric IMS [17], traveling wave ion guide [18, 19], and trapped ion mobility spectrometers, TIMS [20–22]). One advantage of TIMS is the ability to trap a mobility range of interest, explore molecular dynamics [23], kinetic intermediates [6, 24], and to follow structural changes during the IMS time scale under controlled experimental condition (e.g., reactive/inert, polar/nonpolar bath gas at different temperatures) [25]. In addition, TIMS can be run in selective accumulation mode, which facilitates its coupling to ultrahigh resolution mass analyzers (SA-TIMS-FTMS) [26]. That is, SA-TIMS-FTMS can provide accurate mobility, exact mass measurements, and when complemented with reference standard measurements and/or theoretical calculations it permits direct structural assignment.
In the present paper, a general workflow is describe for unsupervised tridimensional structural assignment using accurate mass measurements, mobility measurements, in silico 2D-3D structural generation, and theoretical mobility calculations. In particular, the potential of this workflow will be shown for the analysis of polyaromatic hydrocarbons (PAH) from a Coal Tar (SRM 1597a) analysis using SA-TIMS-FTMS. The proposed workflow can be adapted to different IMS scenarios, different ion-neutral collisional cross-section (CCS) calculators and has the potential to include MSn and IMSn measurements for faster and more accurate structural assignment.
Experimental methods
Sample preparation
A “Complex mixture of Polyaromatic hydrocarbons Coal Tar in oil” SRM1597a was obtained from the National Institute of Standards and Technology (Baltimore, MA) and used as received. SRM1597a was dissolved in 1:1 v:v optima grade methanol:toluene (Fisher Scientific, Waltham, MA) and diluted 1:100 prior to analysis.
SA-TIMS-FTMS analysis
Details regarding TIMS operation and specifics compared to traditional IMS can be found elsewhere [2, 6, 20, 22, 21]. Briefly, TIMS mobility separation is based on holding the ions stationary using an electric field (E) against a moving gas. In traditional TIMS operation, multiple geometric isomers/conformers are trapped simultaneously at different E values resulting from a voltage gradient applied across the TIMS tunnel (more details on [23, 21]). The E gradient defines the IMS range that is trapped and analyzed, thus allowing low resolution (large E gradient) and high resolution (small E gradient) IMS separations. The possibility to separate and accumulate single isomers/conformers over time in a TIMS device relies on selecting the E gradient, and by performing stepwise elutions into the mass analyzers by reducing the voltage range within a single trapping step. Multi-step elutions are typically used when TIMS is coupled to fast acquisition rate MS analyzers (e.g., TOF-MS). However, when TIMS is coupled to slower MS analyzers (e.g., FT-ICR MS), TIMS’s operation is changed to single step elutions (from a small E gradient that defines the IMS resolution) and sequential scanning of the E gradient range. That is, each isomer/conformer eluting from the IMS cell can be described by a E±ΔE value; the smaller the ΔE value the higher the IMS resolution and accuracy to determine the reduced mobility K0±Δ K0 value. This mode of operation is called selected accumulation trapped ion mobility spectrometry (SA-TIMS). SA-TIMS operation was controlled using in-house software, written in National Instruments Lab VIEW (2012, v. 12.0f3), and synchronized with the FT-ICR MS acquisition program. IMS separation was performed using nitrogen as a bath gas at ca. 300 K, and the gas flow velocity was controlled by the pressure difference between entrance funnel P1=2.6 mbar, and the exit funnel P2=1.3 mbar. P1 and P2 values were held constant for all experiments. The same RF (2080 kHz and 240Vpp) was applied to all electrodes including the entrance funnel, the mobility separating section, and the exit funnel. The SA-TIMS cell was operated using a fill/trap/elute/quench sequence of 250–600/90/25/10 ms, using an average of 30 IMS scans per FTMS spectrum and a voltage difference across the ΔE gradient of 0.5–1.0 V. Under these conditions, the average IMS resolution was 70–120.
An atmospheric pressure laser ionization source (APLI, Bruker Daltonics, Inc., MA) was used for all the analyses. Briefly, the APLI source utilizes a 266 nm laser (CryLas GmbH, Berlin, Germany; Type:1HP266-50) and allows for sample introduction via an atmospheric pressure heated vaporizer. It should be noted that this source targets polyaromatic hydrocarbon compounds [27–29].
MS acquisition was optimized for highest transmission in the 100–600 m/z in the 7T Solarix FT-ICR MS spectrometer (Bruker Daltonics Inc., MA). SA-TIMS-FTMS spectra were acquired at 2 MW using half-sin apodization followed by fast-Fourier transform with magnitude mode resolutions of R~ 150 K at 400 m/z. MS spectra were acquired with 100 scans at 8 MW with experimental resolutions of R~600 k at 400 m/z. External IMS and MS calibrations were performed utilizing Agilent ESI-ToF tuning mix (Tunemix, G2421A, Agilent Technologies, Santa Clara, CA). The chemical formula calculations from the exact mass domain were performed using Data Analysis (Version 4.2, Bruker Daltonik) with a maximum chemical formula of C1-100H1-100N0-2O0-4S0–2, odd and even electron configurations allowed, and a mass tolerance of 0.5 ppm. The number of double bond equivalents (DBE) was calculated using the equation:
| (1) |
where C, H, and N are the number of the respective elements. Processing of IMS-MS data was performed using in-house scripts written in MATLAB (R2014b, MathWorks Inc., Natick, MA).
Theoretical methods
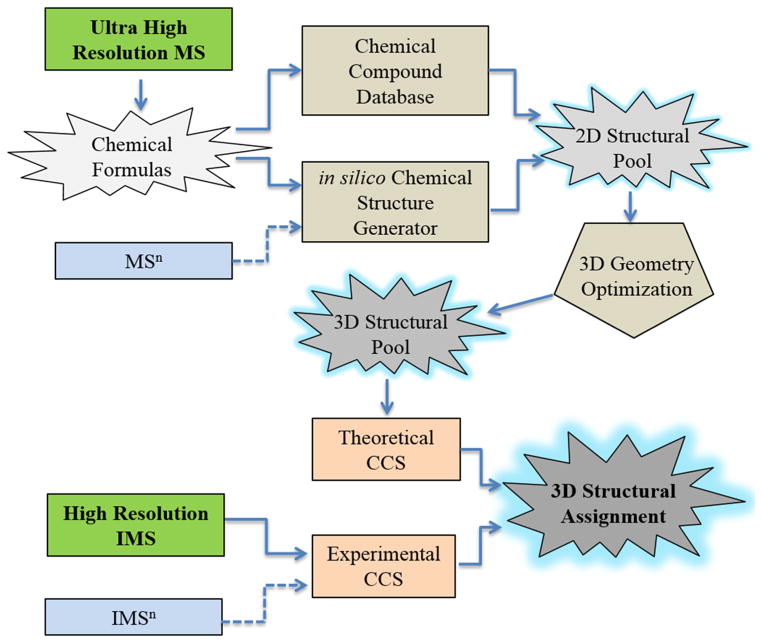
Candidate structures were proposed using the workflow described in the Scheme 1. Briefly, chemical formulas are generated from the ultrahigh resolution MS data. For each chemical formula identified in the FTMS spectra, candidate structures are generated from online databases (e.g., ChemSpider and PubChem) and/or from in silico atomistic structure generators (MOLGEN [30] and STRGEN 2 [31, 32]). The candidate structures undergo geometry optimization utilizing ab initio density functional theory (DFT) methods, typically using 6-31G basis set for fast geometry optimization. Theoretical ion-neutral collision cross sections are then calculated using MOBCAL for nitrogen [33, 34] and IMoS (v 1.06dw) [35–37] softwares with a bath gas at ca. 300 K. IMoS calculations were performed using the trajectory method with 100, 000 gas molecules, fully diffuse collisions and a 92 % Maxwell distribution remission velocity. After theoretical CCS are calculated, the results are compared with the experimental values and structural assignment is performed. IMSn and MSn data can be also incorporated (following the same workflow) for higher confidence in the structural assignment.
Scheme 1.
Outline for the theoretical workflow proposed for unsupervised structural assignment from IMS and MS data
Results and discussion
The separation of PAH from a coal tar sample by high resolution ion mobility and ultrahigh resolution mass spectrometry permits the observation of unique molecular signatures based on the chemical formula and the tridimensional structural arrangement (see Fig. 1a). Inspection of the IMS-MS contour plot shows two distinct trend lines, corresponding to the separation of the CxHyN1 class from the CxHyN0-2O0-4S0–2 classes. Taking into consideration that the APLI source preferentially ionizes aromatic rings, we can further identify the base structure for the CxHyN1 class according to the DBE, which corresponds to a series of alkylated pyridines and pyrroles.
Fig. 1.
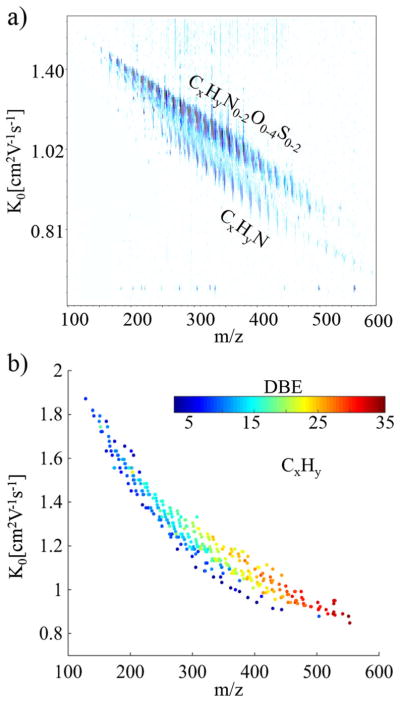
a) Typical IMS-MS contour plot generated by APLI-SA-TIMS-FTMS for the Coal Tar SRM and b) Mobility as a function of the m/z (DBE number in colorscale) for the CxHy class
A unique feature of the SA-TIMS-FTMS analysis is the potential to combine the accurate m/z, DBE and K0 information in order to make a structural assignment. For example, isolation of peaks corresponding to the CxHy chemical class (see Fig. 1b) permits the inspection of their structural diversity and complexity. That is, closer inspection of Fig. 1b shows that as the mass range increases, higher DBE are observed, which translates in highly condensed, aromatic molecules. This observation is in agreement with the ‘planar limit’ in fossil fuels relating the highest condensed state for a given carbon number [38, 39].
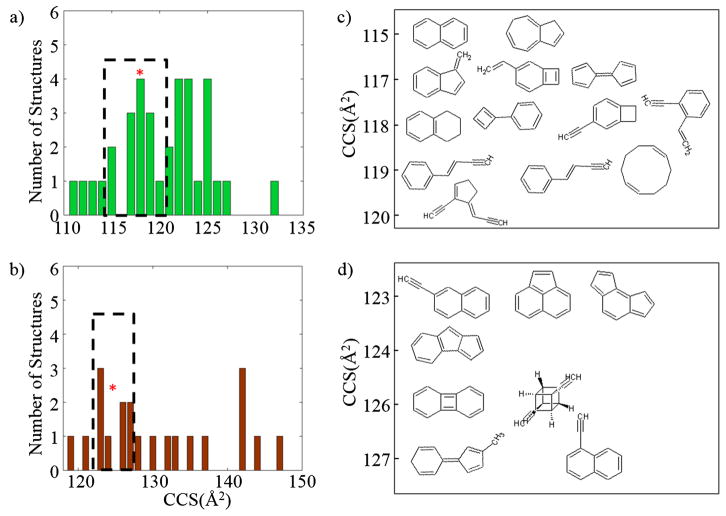
A common workflow during IMS-MS analysis is the combination of experimental and theoretical tools for structural assignment. Most of previous studies have focused on the identification of a limited number of mobility peaks. However, in the case of complex samples, the large number of chemical formulas and the structural diversity makes the structural assignment based on accurate mobility, chemical formula and DBE a challenging computational problem. To better illustrate the complexity, the structural diversity of PAH was studied for the case of C10H8 and C12H8 using the workflow described in the Scheme 1. Considering all the structures included in ChemSpider, the CCS calculations showed that there are multiple candidate structures at nominal CCS (see Fig. 2). Moreover, further analysis of the relative stability of the proposed candidate structures shows that if only the lowest energy structures are considered, structural assignment may be feasible (see supplemental tables 1–2). For example, the lowest energy structures for C10H8 are naphthalene, 1-methyenelindene, and azulene. In this case 1-methyenelindene can be resolved experimentally from the other two which have the same nominal CCS. A similar trend is observed with acenapthylene, 2-ethynyl-naphthalene, and 1-ethynyl-naphthalene for the formula C12H8. If compare with the SRM certificate information, naphthalene and acenapthylene assignments are confirmed [40]. However, structural verification can also be made from the experimental CCS observed. That is, IMS analysis only provided one IMS band for C10H8 and C12H8 and the experimental and theoretical CCS agree within 2 % difference (i.e., naphthalene CCSexp =118 and CCScalc = 115 and acenapthylene CCSexp =125 and CCScalc =125). Previous studies correlating theoretical calculations to experimental values have shown that a 3–5 % variation between the experimental and theoretical CCS from known structures can be expected [22, 26]. It should be noted that in general, this can be further complemented with IMSn and MSn data for a more accurate structural assignment.
Fig. 2.
Number of structures at nominal CCS for a) C10H8 and b) C12H8. Structures within 2 % of the experimental value (*) are shown for C10H8 and C12H8 in c) and d), respectively
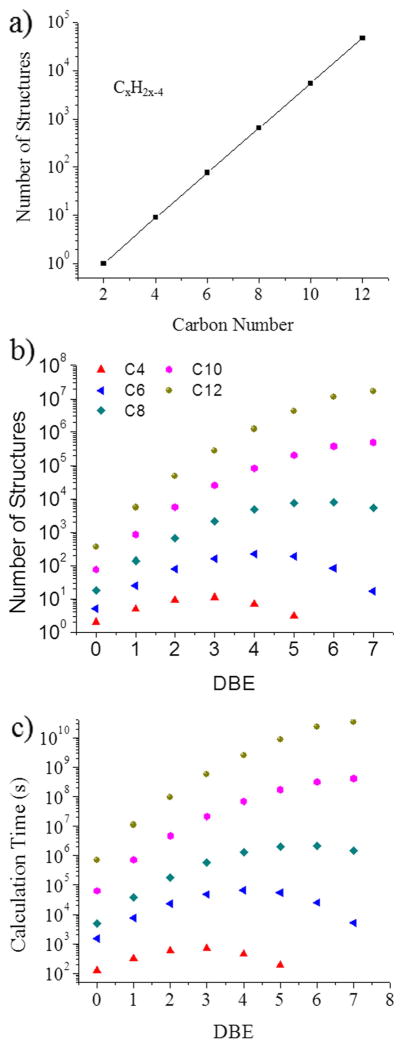
An important part of the workflow previously described is the search for candidate structures. Although the initial pool of structures can be compiled using existing databases, this approach is limited by the size and diversity of the database. On the other hand, one can better characterize the structural space using an in silico molecular structure generator based solely on the chemical formula. Although this approach looks straightforward, its implementation can be challenging because of the exponential increase in structural diversity with the carbon number (see example for the case of a hydrocarbon series in Fig. 3a). The structural complexity with the carbon number can be illustrated by the inspection of the number of structures as a function of DBE for the PAH class (see Fig. 3b). An interesting observation is that as the carbon number increases, there is a maximum in the number of structures that can be produced at each DBE. That is, for larger carbon number the DBE imposes constraints in the number of possible structures.
Fig. 3.
a) Number of structures as a function of the carbon number for CxH2x-4. b) Number of structures as a function of the DBE number, and c) estimated computational time as a function of the DBE
In the workflow proposed, the conversion from 2 to 3 dimensions includes geometry optimization prior to CCS calculations. To shorten the computation time, a small basis set (e.g., DFT/6-31G) is recommended as long as it accurately reproduces the PAH geometry [41, 42]. Although a single geometry optimization can be performed in short timescales using current computing resources (see Fig. 3c), the total time scales with the number of atoms (due to longer optimization times). For example, for the chemical formula C12H20, it would take 31 computational years to calculate all of the potential structures if performed in serial mode. Moreover, these calculations can be made over a more realistic time if parallel computing and multimode computer resources are utilized.
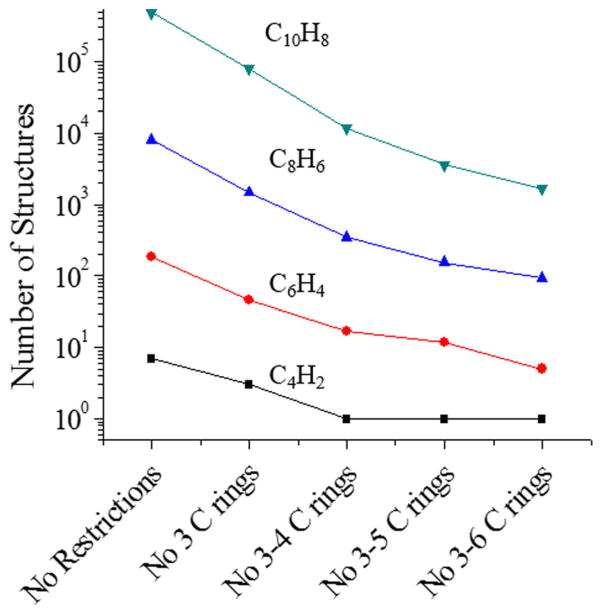
Another alternative to reduce the computational time is by introducing “chemical constraints” and filtering schemes to better reproduce PAH structural diversity. For example, one such scheme can be performed by introducing ring size constraints which will reduce the number of structures that are generated (see Fig. 4). The number of constraints typically depends on the type of molecules of interest. That is, for fossil fuel analysis the most common ring structures are napthenes and aromatics [43]. This strategy can be further developed by incorporating structural constraints from IMSn/MSn and structural features from the chemical class of interest. For example, if the parent molecular ion can be isolated by IMSn and/or MSn, the search algorithm will add constraints from the fragment ions, thus reducing the total number of candidate structures and the overall computational time. It should be noted, that structures for a given chemical formula only require to be calculated once; that is, a tridimensional database can be compiled and updated over time for the chemical class of interest. Another alternative to atomistic structural generation is the use of genetic algorithms, where structures are built according to set evolutionary rules. This has been shown in the case of small ionic cluster systems, [44] drug discovery where structures were generated de-novo as a tool alongside high throughput screening [45, 46], as well as in the case of NMR elucidation [47]. Although genetic algorithms have not been used in the workflow proposed, their implementation can be included as part of the in silico structural generation.
Fig. 4.
Number of potential structures dependence on the “chemical constraints”
Conclusion
A single analysis utilizing SA-TIMS-FTMS can provide a chemical formula and accurate mobility measurement from a complex mixture of fossil fuels without the need of sample pre-fractionation. Molecular structure elucidation from SA-TIMS-FTMS data typically requires the use of chemical standards and/or theoretical calculations of candidate structures. The workflow described here permits the generation of PAH structures by utilizing chemical databases and/or in silico structural generators, followed by geometry optimization and CCS calculations. Examples shown illustrate that this approach is feasible and that less than a 2 % difference is observed between theoretical and experimental CCS. Moreover, potential computational challenges and alternatives are discussed to minimize the computation time and to increase the confidence in the structural assignment with increasing carbon number and DBE. For example, it was shown that the use of chemical constraints, such as limiting functional groups, or ring size, allows a reduction in the number of potential structures that are theoretically generated and their computational time. The proposed workflow can be adapted to different IMS scenarios, utilize different CCS calculators, and has the potential to include MSn and IMSn measurements for faster and more accurate tridimensional structural assignment.
Supplementary Material
Acknowledgments
This work was supported by the National Institute of Health (Grant No. R00GM106414) and a FFL Bruker Daltonic, Inc. fellowship. The authors would like to thank Dr. Carlos Larriba-Andaluz for continued development of the IMoS software and acknowledge the Instructional & Research Computing Center (IRCC) at Florida International University for providing high performance computing resources that have contributed to the research results reported within this research.
Footnotes
Electronic supplementary material The online version of this article (doi:10.1007/s12127-015-0175-y) contains supplementary material, which is available to authorized users.
Conflict of interest: The authors declare no competing financial interest.
This article is submitted as part of the special issue on IMS modeling and simulation.
References
- 1.Kanu AB, Hill HH., Jr Identity confirmation of drugs and explosives in ion mobility spectrometry using a secondary drift gas. Talanta. 2007;73:692–699. doi: 10.1016/j.talanta.2007.04.058. [DOI] [PubMed] [Google Scholar]
- 2.Schenk ER, Mendez V, Landrum JT, Ridgeway ME, Park MA, Fernandez-Lima F. Direct observation of differences of carotenoid polyene chain cis/trans isomers resulting from structural topology. Anal Chem. 2014;86:2019–2024. doi: 10.1021/ac403153m. [DOI] [PMC free article] [PubMed] [Google Scholar]
- 3.Pierson NA, Chen L, Russell DH, Clemmer DE. Cis–trans isomerizations of proline residues are key to bradykinin conformations. J Am Chem Soc. 2013;135:3186–3192. doi: 10.1021/ja3114505. [DOI] [PMC free article] [PubMed] [Google Scholar]
- 4.Merenbloom SI, Glaskin RS, Henson ZB, Clemmer DE. High-resolution ion cyclotron mobility spectrometry. Anal Chem. 2009;81:1482–1487. doi: 10.1021/ac801880a. [DOI] [PMC free article] [PubMed] [Google Scholar]
- 5.Sawyer HA, Marini JT, Stone EG, Ruotolo BT, Gillig KJ, Russell DH. The structure of gas-phase bradykinin fragment 1–5 (RPPGF) ions: an ion mobility spectrometry and H/D exchange ion-molecule reaction chemistry study. J Am Soc Mass Spectrom. 2005;16:893–905. doi: 10.1016/j.jasms.2005.03.002. [DOI] [PubMed] [Google Scholar]
- 6.Schenk ER, Ridgeway ME, Park MA, Leng F, Fernandez-Lima F. Isomerization kinetics of at hook decapeptide solution structures. Anal Chem. 2014;86:1210–1214. doi: 10.1021/ac403386q. [DOI] [PMC free article] [PubMed] [Google Scholar]
- 7.Molano-Arevalo JC, Hernandez DR, Gonzalez WG, Miksovska J, Ridgeway ME, Park MA, Fernandez-Lima F. Flavin adenine dinucleotide structural motifs: from solution to gas phase. Anal Chem. 2014;86:10223–30. doi: 10.1021/ac5023666. [DOI] [PMC free article] [PubMed] [Google Scholar]
- 8.Ruotolo BT, Verbeck GF, Thomson LM, Woods AS, Gillig KJ, Russell DH. Observation of conserved solution-phase secondary structure in gas-phase tryptic peptides. J Proteome Res. 2002;1:303. doi: 10.1021/ja0178113. [DOI] [PubMed] [Google Scholar]
- 9.May JC, Goodwin CR, Lareau NM, Leaptrot KL, Morris CB, Kurulugama RT, Mordehai A, Klein C, Barry W, Darland E, Overney G, Imatani K, Stafford GC, Fjeldsted JC, McLean JA. Conformational ordering of biomolecules in the gas phase: nitrogen collision cross sections measured on a prototype high resolution drift tube ion mobility-mass spectrometer. Anal Chem. 2014;86:2107–2116. doi: 10.1021/ac4038448. [DOI] [PMC free article] [PubMed] [Google Scholar]
- 10.Gillig KJ, Russell DH. A periodic field focusing ion mobility spectrometer. The Texas A & M University System. 2001;36 [Google Scholar]
- 11.Gillig KJ, Ruotolo BT, Stone EG, Russell DH. An electrostatic focusing ion guide for ion mobility-mass spectrometry. Int J Mass Spectrom. 2004;239:43–49. [Google Scholar]
- 12.Silveira JA, Gamage CM, Blase RC, Russell DH. Gas-phase ion dynamics in a periodic-focusing DC ion guide. Int J Mass Spectrom. 2010;296:36–42. [Google Scholar]
- 13.Guo Y, Wang J, Javahery G, Thomson BA, Siu KWM. Ion mobility spectrometer with radial collisional focusing. Anal Chem. 2004;77:266–275. doi: 10.1021/ac048974n. [DOI] [PubMed] [Google Scholar]
- 14.Koeniger SL, Merenbloom SI, Valentine SJ, Jarrold MF, Udseth HR, Smith RD, Clemmer DE. An IMS-IMS analogue of MS-MS. Anal Chem. 2006;78:4161–4174. doi: 10.1021/ac051060w. [DOI] [PubMed] [Google Scholar]
- 15.Kurulugama RT, Nachtigall FM, Lee S, Valentine SJ, Clemmer DE. Overtone mobility spectrometry: Part 1. Experimental observations. J Am Soc Mass Spectrom. 2009;20:729–737. doi: 10.1016/j.jasms.2008.11.022. [DOI] [PMC free article] [PubMed] [Google Scholar]
- 16.Glaskin RS, Valentine SJ, Clemmer DE. A scanning frequency mode for ion cyclotron mobility spectrometry. Anal Chem. 2010;82:8266–8271. doi: 10.1021/ac1017474. [DOI] [PubMed] [Google Scholar]
- 17.Kolakowski BM, Mester Z. Review of applications of high-field asymmetric waveform ion mobility spectrometry (FAIMS) and differential mobility spectrometry (DMS) Analyst. 2007;132:842–864. doi: 10.1039/b706039d. [DOI] [PubMed] [Google Scholar]
- 18.Pringle SD, Giles K, Wildgoose JL, Williams JP, Slade SE, Thalassinos K, Bateman RH, Bowers MT, Scrivens JH. An investigation of the mobility separation of some peptide and protein ions using a new hybrid quadrupole/travelling wave IMS/oa-ToF instrument. Int J Mass Spectrom. 2007;261:1–12. [Google Scholar]
- 19.Bush MF, Hall Z, Giles K, Hoyes J, Robinson CV, Ruotolo BT. Collision cross sections of proteins and their complexes: a calibration framework and database for gas-phase structural biology. Anal Chem. 2010;82:9557–9565. doi: 10.1021/ac1022953. [DOI] [PubMed] [Google Scholar]
- 20.Fernandez-Lima FA, Kaplan DA, Park MA. Note: integration of trapped ion mobility spectrometry with mass spectrometry. Rev Sci Instrum. 2011;82:126106. doi: 10.1063/1.3665933. [DOI] [PMC free article] [PubMed] [Google Scholar]
- 21.Fernandez-Lima F, Kaplan D, Suetering J, Park M. Gas-phase separation using a trapped ion mobility spectrometer. Int J Ion Mobility Spectrom. 2011;14:93–98. doi: 10.1007/s12127-011-0067-8. [DOI] [PMC free article] [PubMed] [Google Scholar]
- 22.Castellanos A, Benigni P, Hernandez D, DeBord J, Ridgeway M, Park M, Fernandez-Lima F. Fast screening of polycyclic aromatic hydrocarbons using trapped ion mobility spectrometry–mass spectrometry. Anal Meth. 2014;6:9328–9332. doi: 10.1039/C4AY01655F. [DOI] [PMC free article] [PubMed] [Google Scholar]
- 23.Fernandez-Lima FA, Wei H, Gao YQ, Russell DH. On the structure elucidation using IMS and Molecular Dynamics. J Phys Chem A. 2009;113:8221–8234. doi: 10.1021/jp811150q. [DOI] [PubMed] [Google Scholar]
- 24.Schenk E, Almeida R, Miksovska J, Ridgeway M, Park M, Fernandez-Lima F. Kinetic intermediates of Holo- and apomyoglobin studied using HDX-TIMS-MS and molecular dynamic simulations. J Am Soc Mass Spectrom. 2015;26:555–563. doi: 10.1007/s13361-014-1067-9. [DOI] [PMC free article] [PubMed] [Google Scholar]
- 25.Schenk E, Nau F, Fernandez-Lima F. Theoretical predictor for candidate structure assignment from IMS data of biomolecule-related conformational space. Int J Ion Mobility Spectrom. 2015;18:1–7. doi: 10.1007/s12127-015-0165-0. [DOI] [PMC free article] [PubMed] [Google Scholar]
- 26.Benigni P, Thompson CJ, Ridgeway ME, Park MA, Fernandez-Lima F. Targeted high-resolution ion mobility separation coupled to ultrahigh-resolution mass spectrometry of endocrine disruptors in complex mixtures. Anal Chem. 2015;87:4321–5. doi: 10.1021/ac504866v. [DOI] [PMC free article] [PubMed] [Google Scholar]
- 27.Panda SK, Brockmann K-J, Benter T, Schrader W. Atmospheric pressure laser ionization (APLI) coupled with Fourier transform ion cyclotron resonance mass spectrometry applied to petroleum samples analysis: comparison with electrospray ionization and atmospheric pressure photoionization methods. Rapid Comm Mass Spectrom. 2011;25:2317–2326. doi: 10.1002/rcm.5122. [DOI] [PubMed] [Google Scholar]
- 28.Panda SK, Andersson JT, Schrader W. Mass-spectrometric analysis of complex volatile and nonvolatile crude oil components: a challenge. Anal Bioanal Chem. 2007;389:1329–1339. doi: 10.1007/s00216-007-1583-6. [DOI] [PubMed] [Google Scholar]
- 29.Schrader W, Panda SK, Brockmann KJ, Benter T. Characterization of nonpolar aromatic hydrocarbons in crude oil using atmospheric pressure laser ionization and Fourier transform ion cyclotron resonance mass spectrometry (APLI FT-ICR MS) Analyst. 2008;133:867–869. doi: 10.1039/b801031e. [DOI] [PubMed] [Google Scholar]
- 30.Gugisch R, Kerber A, Kohnert A, Laue R, Meringer M, Rücker C, Wassermann A. MOLGEN 5.0, a molecular structure generator. Bentham Science Publishers Ltd; 2012. 2013. [Google Scholar]
- 31.Bangov IP. Generation of molecular graphs based on flexible utilization of the available structural information. Discrete Appl Math. 1996;67:27–49. [Google Scholar]
- 32.Stoyanov B, Petrov E, Kochev N, Bangov I. A novel program for computer-aided generation of 2D chemical structures. Bulgarian Chem Comm. 2014;46:215. [Google Scholar]
- 33.Campuzano I, Bush MF, Robinson CV, Beaumont C, Richardson K, Kim H, Kim HI. Structural characterization of drug-like compounds by ion mobility mass spectrometry: comparison of theoretical and experimentally derived nitrogen collision cross sections. Anal Chem. 2011;84:1026–1033. doi: 10.1021/ac202625t. [DOI] [PubMed] [Google Scholar]
- 34.Kim HI, Kim H, Pang ES, Ryu EK, Beegle LW, Loo JA, Goddard WA, Kanik I. Structural characterization of unsaturated phosphatidylcholines using traveling wave ion mobility spectrometry. Anal Chem. 2009;81:8289. doi: 10.1021/ac900672a. [DOI] [PMC free article] [PubMed] [Google Scholar]
- 35.Larriba C, Hogan CJ. Ion mobilities in diatomic gases: measurement versus prediction with non-specular scattering models. J Phys Chem A. 2013;117:3887–3901. doi: 10.1021/jp312432z. [DOI] [PubMed] [Google Scholar]
- 36.Larriba C, Hogan CJ., Jr Free molecular collision cross section calculation methods for nanoparticles and complex ions with energy accommodation. J Comp Phys. 2013;251:344–363. [Google Scholar]
- 37.Ouyang H, Larriba-Andaluz C, Oberreit D, Hogan C., Jr The collision cross sections of iodide salt cluster ions in air via differential mobility analysis-mass spectrometry. J Am Soc Mass Spectrom. 2013;24:1833–1847. doi: 10.1007/s13361-013-0724-8. [DOI] [PubMed] [Google Scholar]
- 38.Cho Y, Kim YH, Kim S. Planar limit-assisted structural interpretation of saturates/aromatics/resins/asphaltenes fractionated crude oil compounds observed by fourier transform ion cyclotron resonance mass spectrometry. Anal chem. 2011;83:6068–6073. doi: 10.1021/ac2011685. [DOI] [PubMed] [Google Scholar]
- 39.Hsu CS, Lobodin VV, Rodgers RP, McKenna AM, Marshall AG. Compositional boundaries for fossil hydrocarbons. Energy & Fuels. 2011;25:2174–2178. [Google Scholar]
- 40.Wise S, Poster D, Leigh S, Rimmer C, Mössner S, Schubert P, Sander L, Schantz M. Polycyclic aromatic hydrocarbons (PAHs) in a coal tar standard reference material—SRM 1597a updated. Anal Bioanal Chem. 2010;398:717–728. doi: 10.1007/s00216-010-4008-x. [DOI] [PubMed] [Google Scholar]
- 41.Bouzzine SM, Bouzakraoui S, Bouachrine M, Hamidi M. Density functional theory (B3LYP/6-31G*) study of oligothiophenes in their aromatic and polaronic states. J Mol Struc-Theochem. 2005;726:271–276. [Google Scholar]
- 42.Förner W, Utz W. Correlated ab initio and density functional calculations on small model molecules for the unit cell of polyparaphenylene in its aromatic and quinoidal forms: equilibrium geometries and vibrational spectra. J Mol Struc-Theochem. 2002;618:65–84. [Google Scholar]
- 43.Silva SL, Silva AMS, Ribeiro JC, Martins FG, Da Silva FA, Silva CM. Chromatographic and spectroscopic analysis of heavy crude oil mixtures with emphasis in nuclear magnetic resonance spectroscopy: a review. Analytica Chimica Acta. 2011;707:18–37. doi: 10.1016/j.aca.2011.09.010. [DOI] [PubMed] [Google Scholar]
- 44.Fernandez-Lima FA, VilelaNeto OP, Pimentel AS, Ponciano CR, Pacheco MAC, Nascimento MAC, Silveira EFD. A theoretical and experimental study of positive and neutral LiF clusters produced by fast ion impact on a polycrystalline LiF target. J Phys Chem A. 2009;113:1813–1821. doi: 10.1021/jp8071684. [DOI] [PubMed] [Google Scholar]
- 45.Douguet D, Thoreau E, Grassy G. A genetic algorithm for the automated generation of small organic molecules: drug design using an evolutionary algorithm. J Comput Aided Mol Des. 2000;14:449–466. doi: 10.1023/a:1008108423895. [DOI] [PubMed] [Google Scholar]
- 46.Schneider G, Fechner U. Computer-based de novo design of drug-like molecules. Nat Rev Drug Discov. 2005;4:649–663. doi: 10.1038/nrd1799. [DOI] [PubMed] [Google Scholar]
- 47.Han Y, Steinbeck C. Evolutionary-algorithm-based strategy for computer-assisted structure elucidation. J Chem Inf Comp Sci. 2004;44:489–498. doi: 10.1021/ci034132y. [DOI] [PubMed] [Google Scholar]
Associated Data
This section collects any data citations, data availability statements, or supplementary materials included in this article.


