Abstract
Central nervous system (CNS) tissue motion of the brain occurs over 30 million cardiac cycles per year due to intracranial pressure differences caused by the pulsatile intracranial blood flow and cerebrospinal fluid (CSF) motion within the intracranial space. This motion has been found to be elevated in type 1 Chiari malformation. The impact of CNS tissue motion on CSF dynamics was assessed using moving-boundary computational fluid dynamics (CFD) models of the cervical-medullary junction (CMJ). The cerebellar tonsils and spinal cord were modeled as rigid surfaces moving in the caudocranial direction over the cardiac cycle. The CFD boundary conditions were based on in vivo MR imaging of a 35-year old female Chiari malformation patient with ~150 to 300 μm motion of the cerebellar tonsils and spinal cord, respectively. Results showed that tissue motion increased CSF pressure dissociation across the CMJ and peak velocities up to 120% and 60%, respectively. Alterations in CSF dynamics were most pronounced near the CMJ and during peak tonsillar velocity. These results show a small CNS tissue motion at the CMJ can alter CSF dynamics for a portion of the cardiac cycle and demonstrate the utility of CFD modeling coupled with MR imaging to help understand CSF dynamics.
Keywords: Cerebrospinal fluid, computational fluid dynamics, moving boundary simulation, central nervous system
1 INTRODUCTION
Since the discovery of cerebrospinal fluid (CSF) in 1741 by Emanuel Swedenborg 13, the importance of CSF dynamics at the cervical-medullary junction (CMJ) has been investigated to help understand pathological states such as Chiari malformation (CM) and syringomyelia. Early spinal CSF studies required invasive measurements such as lumbar puncture 1, to obtain CSF pressure, and x-ray myelography 9 to assess CSF space integrity. These early studies, and studies in recent years, have provided valuable information about the CSF pressure environment present in health and pathophysiological states 15.
Phase-contrast magnetic resonance imaging (PCMRI) has provided a non-invasive method to quantify CSF dynamics. In 1992, the first cardiac gated PCMRI study was conducted by Nitz et al. to qualitatively assess spinal CSF dynamics non-invasively 24. Similar to the early invasive measurements, PCMRI 15, and more recently 4D PCMRI 34, has revealed that CSF dynamics can be altered in disease states. However, at present, little correlation has been found between MR-based quantitative assessment of CSF dynamics and specific symptoms.
An engineering approach has been applied by many researchers to help understand the nature of CMJ CSF dynamics through in vitro models and in silico computational fluid dynamics (CFD) simulations. These engineering methods have been useful to non-invasively investigate flow parameters that can be difficult or impossible to measure using PCMRI or invasive measurements. In vitro 21, 23 and in silico modeling has been conducted with geometrically simplified 20 and subject-specific CMJ anatomy 14, 35 based on static geometry. These simulations provide a powerful tool for variational analysis to determine the importance of various anatomical features and properties and physiological functions on CSF dynamics such as: spinal cord nerve roots and denticulate ligaments 14, 30, frequency and magnitude of CSF pulsations 17, presence of arachnoid trabeculae 30, focal spinal arachnoiditis 3, tonsillar descent in CM patients 22, 29, 35, spinal stenosis 21, 23 and properties of the spinal cord and dura in syringomyelia 6. The engineering-based parameters are now being investigated to evaluate their potential for clinical use.
Near the CMJ, up to ~2 mm bulk motion of the spinal cord and cerebral tonsils has been measured by intraoperative ultrasound 25 and MRI-based methods 8, 35. These studies showed greater tonsillar motion in CM patients compared to controls. This greater motion is thought to be caused by brain expansion during systole and the obstruction to the rapid CSF flow across the foramen magnum25. As such, motion of the spinal cord and tonsils can impact the hydrodynamics of its surrounding CSF and thus, may contribute to the development of other related conditions, such as syringomyelia, in CM patients25. This elevated motion has also been cited as a factor that could lead to the inconsistency in CSF dynamics predicted by CFD and measured by in vivo PCMRI 35.
The goal of the present study was to investigate the importance of the CNS tissue motion on CSF dynamics using a patient-specific moving-boundary CFD model of the CMJ of a CM patient. A CM patient was chosen for this study to maximize the impact that CNS tissue motion may have on CSF dynamics since the CSF spaces near the CMJ in Chiari patients are restricted in comparison to healthy subjects 22, 29. Patient-specific CNS tissue motion of the spinal cord and cerebellar tonsils was measured by PCMRI and imposed in the CFD model as a rigid-walled moving boundary.
2 METHODS
2.1 Ethics statement
The MR data acquisition was performed at the Cleveland Clinic Foundation. This study was approved by the institutional review board of the Cleveland Clinic Foundation. Written informed consent was obtained before the MRI exams. MR data were anonymized prior to post-processing.
2.2 Patient selection
A single representative CM patient was chosen for this study to allow parametric assessment of the impact of CNS tissue motion on CSF dynamics within the same patient geometry. The chosen patient was a 35 years old female clinically diagnosed with type I Chiari Malformation (CM) without any previous surgical treatment with a mild tonsillar descent below the foramen magnum of 7.9 mm, obstructed CSF spaces near the CMJ and near-absent cisterna magna. The patient did not have any related comorbidities such as Ehlers-Danlos, hydrocephalus, idiopathic intracranial hypertension or spontaneous intracranial hypotension.
2.3 MRI geometry measurements
A T2-weighted 3D axial SPACE sequence covering the CMJ was acquired at 3T (Trio, Siemens MAGNETOM Trio, Siemens Healthcare, Malvern, PA, software version VB17A). Additional imaging parameters were as follows: slice thickness = 1.0 mm with no inter-slice spacing, isotropic in-plane pixel size of 0.875 mm, field of view (FOV) = 210×280 mm, matrix size = 240×320, TR = 1340, TE = 138, Flip angle = 150°. Imaging time was ~16 minutes.
2.4 Subject-specific geometry
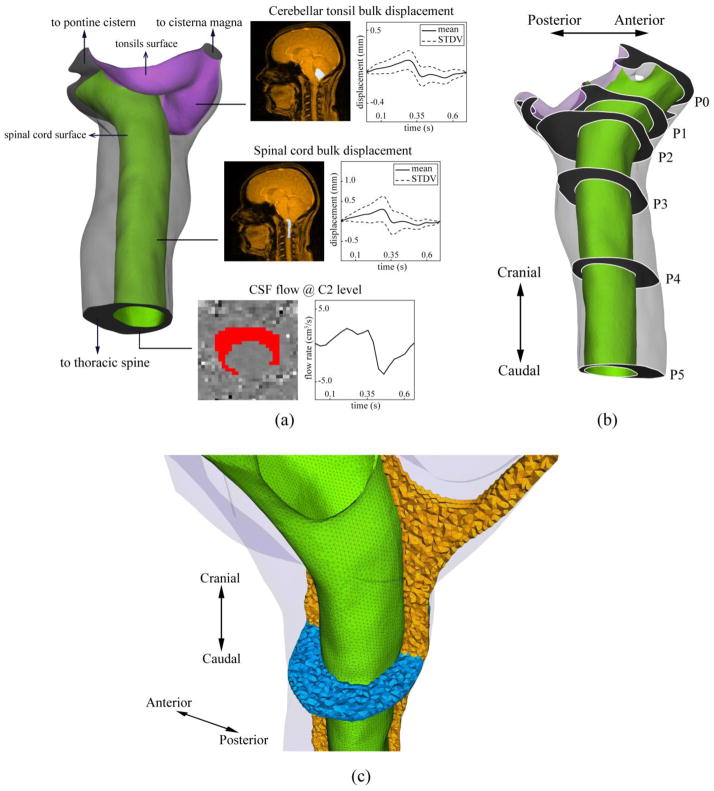
Based on the T2-weighted MRI images, the 3D anatomy of the subarachnoid space near the CMJ was manually segmented from the foramen magnum (FM) to the caudal end of the second cervical vertebrae (C2) (Figure 1-a) using the freely available Segment software (Medviso, Sweden). The cranial and caudal ends of the model were extended five hydraulic diameters to minimize the impact of inlet and outlet boundary conditions on the domain of interest. Maya software (Autodesk Inc. CA, USA) was used to extract and define the surface of the cerebellar tonsils and spinal cord from the overall geometry so that the displacement profiles could be imposed at each structure separately.
Figure 1.
a) Rendering of the reconstructed geometry of the upper cervical SAS (spinal cord and cerebellar tonsil are shown in green and purple respectively). Insets show the mask selections (white regions in MRI images) and the resulting waveforms used to obtain moving walls and velocity inlet boundary conditions. b) Axial planes along the geometry used to compare the results obtained from various computational models. c) Computational grid used for CFD simulations. Spinal cord surface mesh is shown in green. The volumetric mesh in the mid-sagittal and axial planes are shown in orange and blue, respectively.
2.5 PCMRI CSF flow and CNS tissue displacement measurements
To obtain the CSF flow at the CMJ, axial thru-plane PCMRI measurements were acquired at C2 22, 29. In brief, a retrospective peripheral pulse-gated sequence with encoding velocity of 10 cm/s was used to obtain 20 images over the cardiac cycle. Additional image parameters were as follows: TR = 49.3 ms, Flip angle = 15°, FOV = 240×180 mm, matrix size = 256×192, and slice thickness = 6 mm. Overall scan time was 1.5 minutes.
A high-temporal resolution PCMRI scan 18 was acquired for a mid-sagittal slice passing through the center of the spinal cord with in-plane caudocranial velocity encoding. Images were reconstructed retrospectively for 128 time steps over the cardiac cycle at 5.5 ms intervals (HR = 85 beats per minute). Additional imaging parameters were as follows: velocity encoding = 10 cm/s, TR = 20.45 ms, Flip angle =15°, FOV = 259×319, TE = 6.66 ms, slice thickness = 6 mm, in plane reconstructed pixel size 1.66 x 1.66 mm. Overall scan time was two minutes.
2.6 PCMRI post-processing
To define the CSF flow rate waveform for the CFD simulation, the axial PCMRI images acquired at C2 level were post-processed using an in-house code developed in MATLAB (Mathworks, Natick, USA). A region of interest (ROI) was manually defined by selection of pixels within the spinal subarachnoid space between the dura and spinal cord tissue. A CSF flow rate waveform was determined based on integration of the velocities of each pixel within the ROI and subtraction of any net CSF flow component due to eddy current artifact 34. The ROI selection and the resulting flow rate waveform is shown in Figure 1-a.
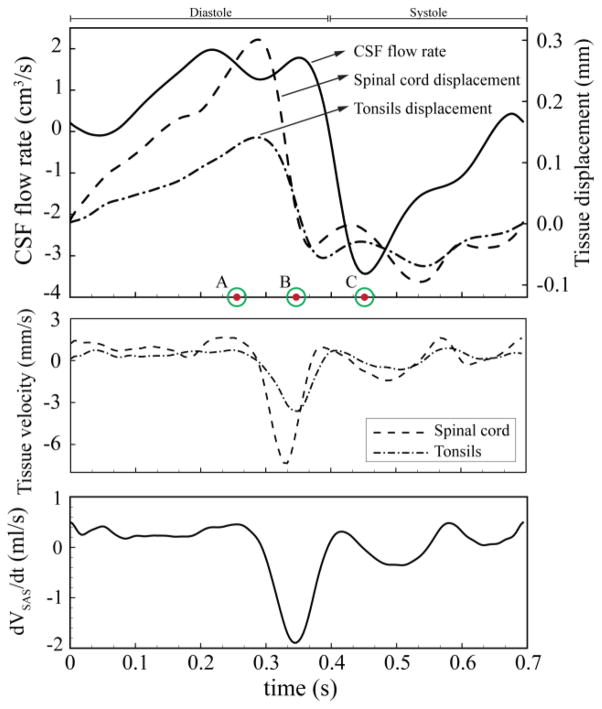
To define the caudocranial displacement of the cerebellar tonsils and spinal cord as a function of time, the mid-sagittal PCMRI images were post-processed using a similar methodology as above. Pixels were manually selected to define ROIs at the upper cervical spinal cord and cerebellar tonsils (see Figure 1-a for pixel mask). The average tonsil and spinal cord displacement for all pixels within each ROI was determined based on integration of the pixel velocities within each ROI (see Figure 1-a for displacement profile). Net tissue motion due to eddy current artifact was subtracted. Pixels near the tonsil and spinal cord edges were omitted to avoid selection of any pixels that included CSF flow. These measured waveforms were interpolated using a piece-wise 3rd order Spline to make them suitable for the CFD model. The interpolated waveforms and their relative timing with respect to each other are shown in Figure 2. In this figure, time points A, B, and C are marked to show peak cranially directed velocity of the spinal cord, peak caudally directed velocity of the cerebellar tonsils, and peak systolic CSF flow, respectively. Figure 2 also depicts the rate of change of subarachnoid space (SAS) volume waveform between P0 and P5 planes. The rate of change of the SAS volume between other axial planes had a similar waveform.
Figure 2.
Top: CSF volumetric flow rate used as inlet boundary condition. CNS tissue displacement waveforms used as moving boundary conditions. Time point A = peak cranially directed spinal cord velocity; time point B = peak caudally directed tonsillar velocity; time point C = peak systolic CSF flow. Middle: spinal cord and tonsillar velocity. Bottom: rate of SAS volume change (VSAS) between P0 and P5 axial planes.
2.7 Computational model
The anatomical geometry obtained from the segmentation process was smoothed to remove pixilation artifacts and then imported into ANSYS ICEM CFD software (ANSYS Inc., Canonsburg, USA) and a non-uniform unstructured grid was created by generating a total 1.6 million tetrahedral and prism elements on the internal and near-wall domain, respectively.
CSF was modeled as an incompressible, Newtonian fluid with the same rheological properties of water at body temperature 4. CSF flow was assumed to be laminar and this assumption was confirmed, as the Reynolds number based on hydraulic diameter and temporal maximum of the mean caudocranial velocity was calculated to be 260 for the model under study. A commercial finite volume CFD solver ANSYS FLUENT (ANSYS Inc., Canonsburg, USA) was used to numerically solve the governing fluid flow equations (Navier-Stokes equations) in the presence of rigid-walled moving boundaries. A pressure-based segregated solver was implemented with second-order spatial and temporal accuracy. The coupling of velocity and pressure field was achieved using the SIMPLE algorithm 26 with the gradient terms in the governing equations evaluated by the Green-Gauss node method. A time-step size of T/200 was used, where T represents the length of one CSF flow cycle (693 ms).
The interpolated displacement waveforms were imposed at the spinal cord and cerebral tonsils surfaces (Figure 1-a). The displacement of the moving boundaries required the computational grid to be altered at each time step. Prior to each iteration, a combination of built-in spring-based smoothing and local re-meshing algorithm in ANSYS FLUENT was used to evaluate mesh quality at each time-step and re-generate the grid if necessary. The quality metrics used for assessing mesh quality was cell skewness defined as:
| (2.1) |
where
 eq is the volume of and equilateral cell with the same circumsphere of the original cell and
 cell is the circumsphere inscribed in the cell at any time-step. The maximum allowable cell skewness of 0.8 was used throughout the simulation. Maximum number of iterations for the spring based smoothing algorithm was set to 20 and the satisfaction of skewness criterion was confirmed by inspection of grid quality at the end of each time step. CNS tissue motion and computational grid deformation are shown in Video 1.
No slip boundary conditions (BC) were used at the walls (zero velocity relative to wall). Velocity inlet and zero pressure boundary conditions were imposed on the caudal and cranial end of the geometry, respectively. The scaled residuals of 10−5 and 10−6 were used as convergence criteria for continuity and momentum equations, respectively. Results are presented based on the 3rd cycle to minimize the un-physiological startup effects. CFD simulations for dynamic and static models took ~18h and ~7h, respectively, on a workstation with 12 CPU cores (two Xeon E5-2630 processors).
2.8 Quantification of impact of motion on CSF dynamics
The approach of this study was to assess the impact of CNS tissue motion on CSF dynamics with CFD simulations conducted under the following four geometric conditions:
Static Baseline Model (SBM): The cerebellar tonsils and spinal cord modeled in a static position corresponding to the time-averaged geometry obtained from in vivo MR images.
Dynamic Model (DM): The cerebellar tonsils and spinal cord surfaces were modeled as moving boundaries according the displacement waveforms (Figure 2). The starting time point was at early diastole (t=0, Figure 2) that corresponds to SBM.
Static Systolic Model (SSM): Static geometry with the cerebellar tonsils and spinal cord at their furthest decent which occurs during systole (Figure 2). At this time point the CSF spaces at the CMJ are most restricted. The simulation on this model was conducted to investigate the impact of the geometrical alterations of the CNS tissues in absence of their motion but with maximum blockage to CSF flow.
Static Diastolic Model (SDM): Static geometry with the cerebellar tonsils and spinal cord at their furthest accent which occurs during diastole (Figure 2). At this time point the CSF spaces at the CMJ are least restricted or minimum blockage.
The simulation results obtained from SBM served as a baseline for comparison to the simulation results from the other models. The impact of these four geometric conditions on CSF dynamics was quantified by assessment of the following pressure and velocity-based parameters:
Pressure dissociation was defined as the difference between the area-weighted average pressure at the P0 and P4 axial planes. Also, the surface pressure distribution, measured relative to the pressure of the outlet boundary (0 Pa), was evaluated on the surface of tonsils and spinal cord.
-
Integrated longitudinal impedance (ILI) was computed across the model geometry. Longitudinal impedance provides a scalar parameter to quantify the blockage severity at the foramen magnum 22. In brief, longitudinal impedance (ZL) was defined to reflect the resistance against the pulsatile movement of CSF flow as the ratio of Fourier coefficients of the pressure gradient across the geometry,
 (ΔP(t)) and the input flow waveform,
 (Q(t)) at each harmonic as:
(2.2) The ILI was calculated by integrating the impedance curve in 1–8 Hz range over the entire model geometry.
Peak thru-plane CSF velocities in cranial and caudal directions and velocity magnitude profiles were obtained at six axial planes (shown in Figure 1-b). Peak velocities were assessed because they are a metric typically of interest to help understand CSF dynamics in health and disease such as CM.
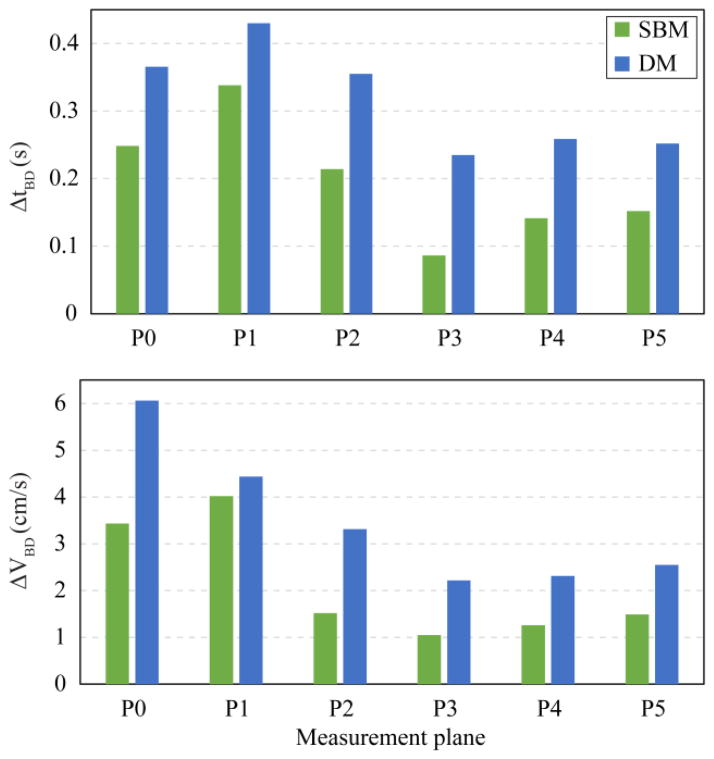
Duration of synchronous bidirectional CSF flow, ΔtBD, was measured at each axial plane when both cranially and caudally directed velocities were greater than 1 mm/s 14. Maximum instantaneous difference between caudal versus cranial directed CSF velocity, ΔVBD, is defined as the magnitude of bidirectional velocity. Bidirectional flow was assessed due to its usefulness in quantifying mixing/transport characteristics of the CSF flow.
Area weighted average wall shear stress as a function of time, WSSavg(t), was determined for the entire surface of the spinal cord and cerebral tonsils, omitting the dura. Wall shear stress was assessed due to the possible mechanotrasduction it may impart on the mechanosensitive CNS tissues 12.
3 Results
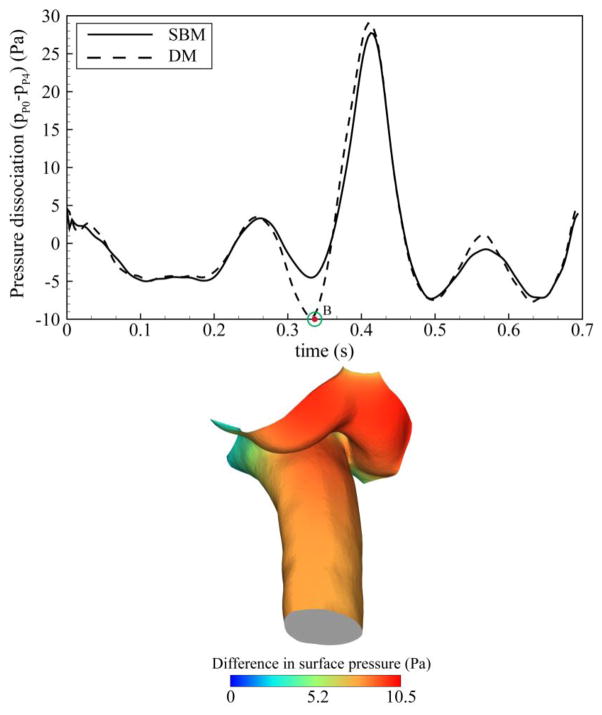
Figure 3 shows the impact of CNS tissue motion on the pressure dissociation calculated between P0 and P4 axial planes and the difference in the surface pressure between baseline and dynamic models. The impact of CNS tissue motion on this parameter was pronounced during caudal motion of the CNS tissues. A maximum difference of 120% (~4 Pa) was observed between SBM and DM at the time corresponding to the peak velocity of the tonsils (time point B). Comparison of the surface pressure between the SBM and DM revealed higher pressure on the surface of spinal cord and tonsils during caudal tissue displacement (maximum 10.5 Pa at time point B). This difference was most noticeable on the surface of the tonsils. The difference in pressure dissociation and distributions of surface pressure was less pronounced during the remainder of the cardiac cycle.
Figure 3.
Top: Pressure dissociation waveform obtained from baseline and dynamic models (ΔP is obtained between P0 and P4 planes as depicted in Figure 1) Bottom: Difference of the relative surface pressure between baseline and dynamic models at time point B showing the largest differences were present at the cerebellar tonsils.
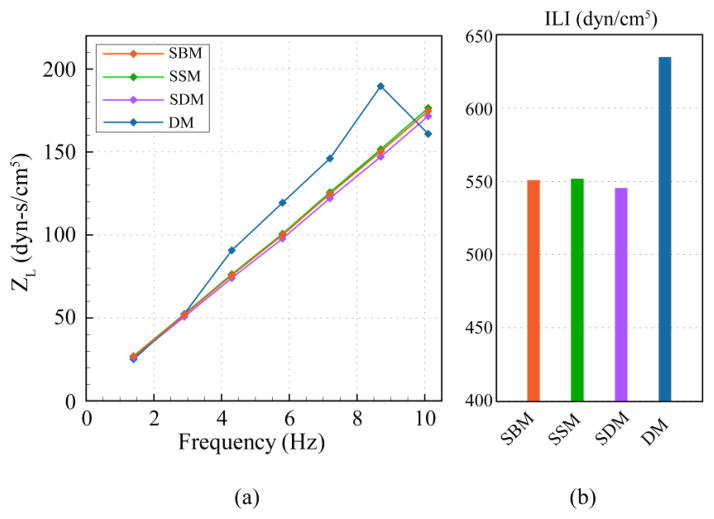
The inclusion of the CNS tissue motion in the DM increased the magnitude of ILI by 19% in comparison to SBM (Figure 4). Surprisingly, SSM and SDM only altered ILI up to 2% in comparison to the baseline model (SBM). The moduli values as a function of frequency for the dynamic model exhibited a non-linear variation, which was not observed in any of the static models.
Figure 4.
a) Frequency moduli of longitudinal impedance (ZL) plotted for different models. b) ILI from moduli in (a).
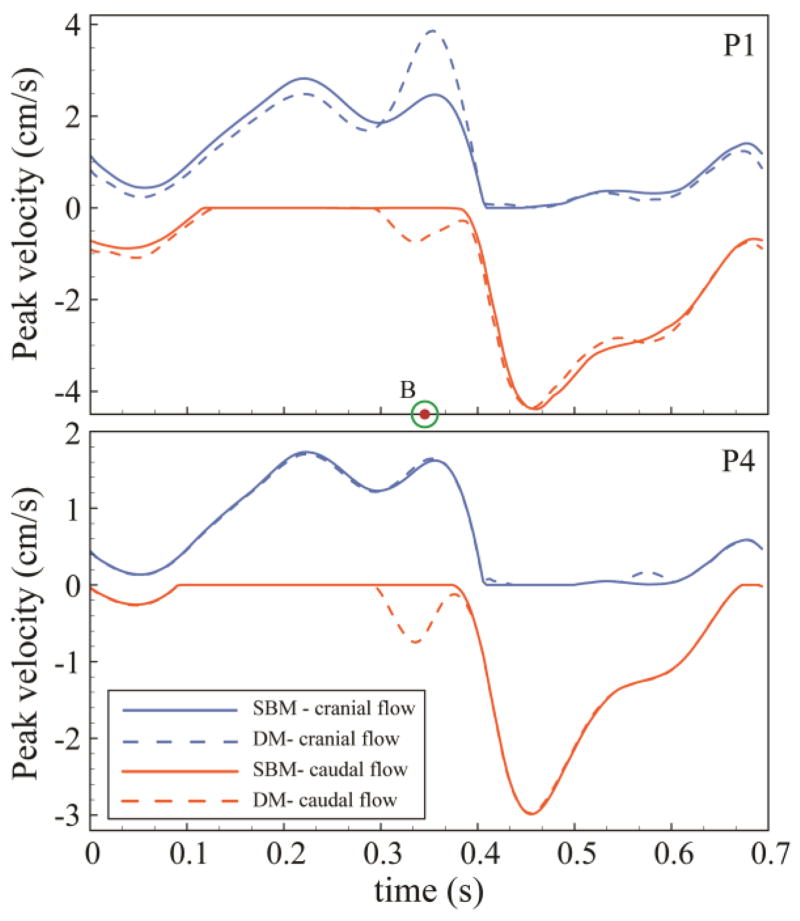
A tonsillar motion of ~150 μm over the cardiac cycle altered peak diastolic CSF velocities to a great degree near the CMJ. DM resulted in up to 60% increase (1.4 cm/s) in peak cranial directed CSF velocity at P0 in comparison to SBM. Figure 5 indicates the unsteady peak velocities at P1 and P4 in the cranial (blue line) and caudal (orange line) direction for SBM and DM. Portions of the CSF flow cycle had zero cranial or caudal directed flow; at these locations peak velocities were designated as zero (see Figure 5, flat line sections). Differences in peak velocities were less pronounced at planes near the caudal end of the geometry (see P1 versus P4 in Figure 5). For all planes analyzed, the maximum alteration in peak CSF velocities occurred at peak caudally directed tonsillar velocity (time point B) and it was less pronounced during the remainder of the cardiac cycle. SSM and SDM had similar peak velocities compared with SBM with a maximum difference of ~9% at the P1 plane (Figure 6).
Figure 5.
Variations of cranially (positive) and caudally (negative) directed peak thru-plane velocities in baseline and dynamic models at two representative axial planes (P1 and P4) along the upper cervical SAS (planes positions are shown in Figure 1).
Figure 6.
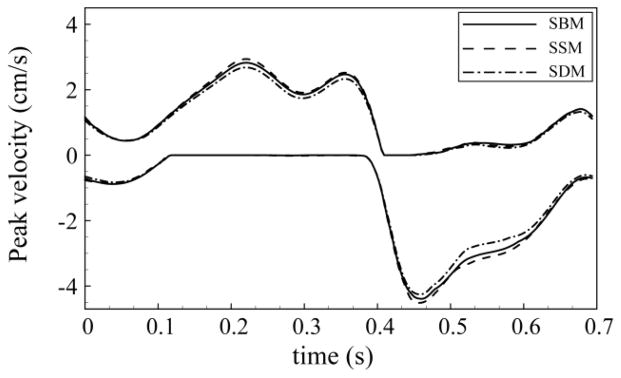
Variation of cranially and caudally directed peak thru-plane velocities in static models (SBM, SSM, and SDM) at P1 axial plane.
Velocity profiles for different axial planes in the baseline and dynamic model showed greater differences near the FM (P0, P1 and P2) compared to axial locations further down the spine (P3 – P5, Figure 7). Velocity distributions in the dynamic versus baseline model had the greatest differences at the time point corresponding to peak CNS tissue velocity in the cranial and caudal directions (Figure 2, time point A and B, respectively). These differences were smaller at peak systole. Inclusion of the CNS tissue motion increased the duration and magnitude of the bidirectional CSF flow at the six axial planes analyzed by 77±50% and 79±39% (mean ± standard deviation), respectively (Figure 8). The variation in bi-directional flow parameters caused by CNS tissue motion was greater at planes located near the cranial end of the geometry, where tissue motion had a greater impact on CSF dynamics.
Figure 7.
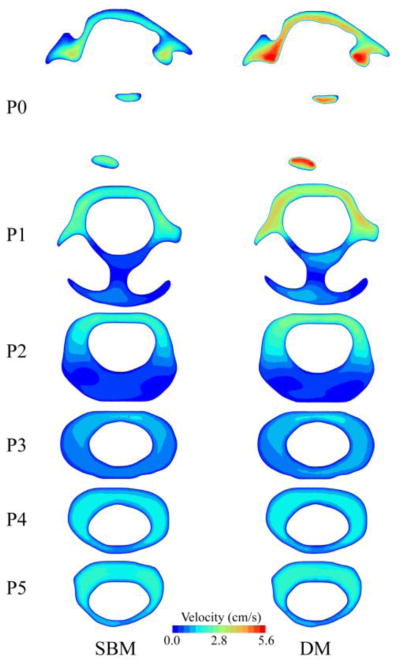
Comparison of velocity distribution on different axial planes along the upper cervical spinal SAS, between baseline and dynamic; plotted at the time corresponding to peak tonsillar velocity (time point B). Inset shows axial planes locations in the upper cervical geometry for the reference.
Figure 8.
Comparison of the duration (ΔtBD) and magnitude (ΔVBD) of synchronous bidirectional CSF flow on different axial planes along the upper cervical spinal SAS. Planes positions are shown in Figure 1.
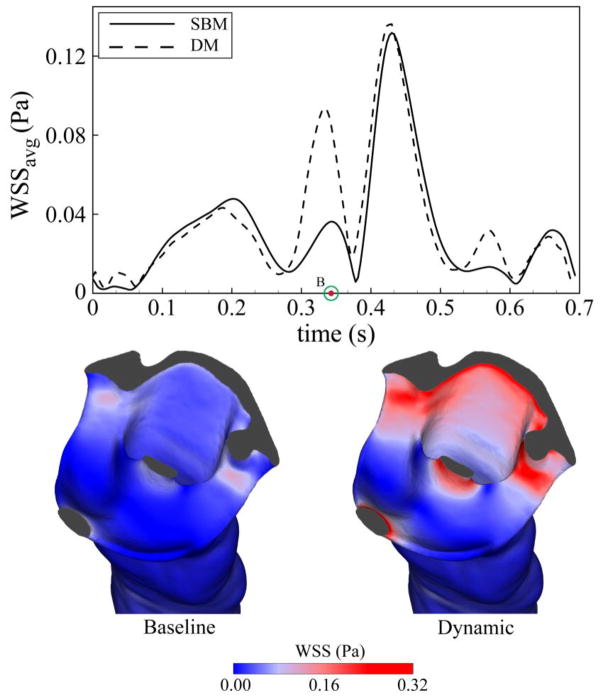
Wall shear stress (WSS) was impacted by CNS tissue motion to a greater degree than CSF velocities (Figure 9). Average WSS was altered in the DM during a relatively short portion of the cardiac cycle (~70 ms) with a peak increase from the SBM of 250%. The increase in WSS observed in the dynamic model was more pronounced in tight regions of the cervical SAS near the cranial end of the geometry and was maximum when CNS tissue and CSF velocities were opposed (time point B). The difference in average WSS between the baseline, diastolic and systolic models was less than 3%.
Figure 9.
Top: Comparison of area-weighted average of wall shear stress on the surface of spinal cord and tonsils, between baseline and dynamic model.
4 Discussion
Alterations of CSF dynamics at the CMJ have been considered to be an underlying factor in the pathophysiology of CM and syringomyelia 5, 7. CSF motion is accompanied by the pulsatile displacement of its surrounding CNS tissues, including cerebral tonsils, medulla, and spinal cord. Previous in vivo studies have quantified the motion of these tissues in healthy and patient cases 10, 16, 25, 27 and some theories have been postulated about the significance of the abnormal CNS tissue motion in clinical assessment of CM 16, 25, 27. The goal of this study was to conduct parametric CFD studies on a single representative CM patient case to understand the possible impact that CNS tissue motion may have on CSF dynamics near the CMJ.
This study characterized the impact of the CNS tissue motion on CSF dynamics using moving-boundary CFD simulations that take into account subject-specific CSF space geometry, CSF flow, and motion of the spinal cord and cerebellar tonsils. The findings of this study show that dynamic cardiac related CNS tissue motion has an important impact on CSF dynamics in terms of pressure and CSF velocity at the CMJ. A small tonsillar motion (150 μm) was found to alter CSF dynamics in CM to a great degree, albeit during a relatively short portion of the cardiac cycle (~70 ms), in terms of velocity (60% increase in peak diastolic velocity) and pressure (20% increase in ILI). Little changes in CSF dynamics were observed using static CFD models with a maximum systolic or diastolic displacement of the CNS tissue (SSM and SDM).
4.1 Importance of tissue motion on pressure dissociation and CSF flow impedance
The impact of CNS tissue motion on pressure dissociation and surface pressures throughout the upper cervical SAS was found to be greatest at the time point corresponding to peak tonsillar velocity (Figure 3). This was due to the alteration of CSF flow in the dynamic model during the same time period, (see section 4.3). CNS tissue motion also resulted in transient increase of relative pressure on the spinal cord and tonsil surfaces at the same time period; albeit the increase in surface pressure was only ~10 Pa. Abnormal pressure environment acting over long periods in cervical SAS may alter mechanical properties of CNS tissues and could potentially contribute to neurological symptoms in craniospinal disorders such as CM 32. A recent review detailed several studies showing the importance of cellular mechanosensitivity in CNS tissues 12. The long-term effect of altered pressure and tissue motion acting on the CNS tissue and meninges in CM patients should be examined.
ILI can be used to quantify the viscous resistance in a pulsatile flow36. This parameter has been reported to be useful in the assessment of CSF flow blockage at the CMJ and its value was measured to be greater in CM patients compared to controls 22, 29. Results from this study show that the inclusion of CNS tissue motion increased the magnitude of ILI by ~20%. Previous work by Martin et al. 22 and Shaffer et al. 29 showed that ILI was elevated by ~150% in CM patients compared to healthy subjects. Although the alteration in ILI in the present study due to CNS tissue motion is smaller than alterations between healthy and disease states, accounting for subject-specific CNS tissue motion in CFD models may help increase the accuracy of the ILI calculations.
4.2 Impact of CNS tissue motion on CSF velocities
The dynamic pulsatile action of the cerebellar tonsils and spinal cord was also found to have an impact on CSF dynamics during a portion of the cardiac cycle. The driving factor leading to alterations in CSF velocities was the CNS tissue velocity (e.g. abruptness of tissue motion) and not tissue static displacement. Evidence for this is shown by large alterations in CSF dynamics at high tissue velocity where displacement is small (Point B, Figure 2). Alterations in peak CSF velocities have been investigated as a potential diagnostic indicator of CM 5, 7, 28 and investigated by CFD studies of CSF flow 22, 35. The results of the present study showed that CNS tissue motion increased peak diastolic CSF velocities near the CMJ up to 60% (Figure 5). Maximum difference between peak CSF velocities in the baseline and dynamic models occurred at the time point of peak tonsillar velocity rather than peak displacement (time point B, Figure 5). This was despite having a smaller SAS cross-sectional area for the CSF to flow at the latter time point. A relatively small difference in peak CSF velocities between static models (SBM vs. SSM and SDM) was found (Figure 6), even for SDM that had the smallest SAS cross-sectional area.
The present study found an increase in the magnitude (~1 cm/s average) and duration (~100 ms average) of CSF bidirectional flow in the presence of the CNS tissue motion (Figure 8). Duration and magnitude of the bidirectional CSF flow have been suggested as a potential indicator of SAS blockage in CM patients 28. Previous PCMRI measurements reported higher values for these parameters in CM patients compared to healthy controls 28. The findings of this study suggest that the greater mobility of spinal cord and cerebral tonsils in CM patients can contribute an increase in magnitude and duration of bidirectional CSF flow.
Similar to the peak CSF velocities, WSSavg(t) showed an increase for the dynamic compared to the baseline model (Figure 9, top). The greatest increase in WSS acting on the CNS tissue was observed near the cerebellar tonsils (Figure 9, bottom) at the time point corresponding to the peak tonsillar velocity in the opposite direction as CSF flow (Time point B). The peak WSS values in this study are within the range reported by Loth et al. 20 (0–1 Pa). The pathophysiological importance, if any, of the low WSS magnitude and alterations for the dynamic model observed in this study is not known. The possible importance of mechanotrasduction of WSS caused by CSF flow on the CNS tissues has been investigated 19. Future studies are needed to investigate the impact of WSS on the delicate CNS tissues such pia and arachnoid mater.
4.3 Fluid dynamics of hydrodynamic parameters alteration
The alteration pattern of pressure-based and velocity-based hydrodynamic parameters in response to CNS tissue motion can be explained by considering the dynamic variation of cervical SAS volume and its role in the balance of CSF flow rate. In the presence of CNS tissue motion, volumetric flow rate balance (continuity) equation between inlet boundary and an arbitrary axial plane can be written as:
| (4.1) |
where Qin and Qp represent volumetric flow rate at the inlet and the desired axial plane, respectively and d
 /dt denotes the variation rate of CSF space volume between inlet and the axial plane under consideration. The results of this study showed that the change in the CSF space volume between any two axial planes follows the same trend as CNS tissues velocity (Figure 2). Thus, the increase in CNS tissues velocity results in greater d
 /dt values in equation (4.1) and leads to a greater difference between Qin and Qp. As such, the alteration of CSF flow rate, Qp is maximum at the time point corresponding to the peak tonsillar velocity (tB) and is the main reason behind the observed difference in hydrodynamic parameters between the baseline and dynamic models.
The presence of the cerebellar tonsils and the more tapered geometry of spinal cord near the cranial end of the geometry resulted in greater time variation of CSF space in this small volume region (larger d
 /dt values in equation (4.1)). This caused a more pronounced alteration of hydrodynamic parameters at axial planes located near this region in the presence of CNS tissue motion.
4.4 Previous assessment of the CNS tissue motion
Pulsatile motion of CNS tissue has been assessed in a number of studies using a variety of MRI techniques such as PCMRI, Bolus tracking, and Displacement Encoded Stimulated Echo (DENSE)16, 27, 31. For healthy subjects, cardiac related pulsatile CNS tissue motion has been reported to range from 0.17 to 0.43 mm. In disease states, such as CM, elevated CNS tissue motion has been quantified to be 0.37 to 0.57 mm 10, 16, 27, 33. Peak velocity of the spinal cord in healthy subjects and CM patients were reported to be 3.8 and 8.0 mm/s respectively 2, 10. The magnitude of CNS tissue displacement (150–300 μm) and peak velocity (3–6 mm/s) used in the present study is within the range of above measurements; albeit on the lower end of displacement and peak velocities reported for CM patients. The magnitude and direction of CNS tissue motion was found to vary spatially depending on the location within the brain analyzed 37. The increased velocity of the spinal cord and tonsillar tissues has been postulated to result from conservation of momentum during the transmission of inter-structural forces from the more massive cortex tissue to the smaller CNS tissues inferior to the brain 11.
The observed overall pattern of the CNS tissue motion in this study consisted of spinal cord and tonsils displacement waveforms with similar phases. Synchronous motion of spinal cord and tonsils was reported by Hofmann et al. 16 and Wolpert et al. 33. Enzmann and Pelc 10 reported the onset of caudal tonsil movement to occur before the spinal cord for healthy subjects.
In the MRI measurements of the present study, the onset of the caudal motion of the CNS tissues preceded that of the CSF flow (Figure 2). While the same pattern was observed by Pujol et al.27 in PCMRI measurements of CM patients, Hofmann et al. 16 and Enzmann and Pecl 10 reported the caudal motion of the CNS tissues to be in sync with that of the CSF flow in the cervical SAS of CM patients and healthy volunteers, respectively.
5 Limitations
The simulations performed in this study were based on a single CM patient with mild tonsillar descend below the FM of 7.9 mm. Assessment of only one representative case precludes a definitive statement about the pathophysiological implications of the results. Also, the relatively small CNS tissue motion (150–300 μm) considered in the present study may not show the larger CSF dynamics alternations in more severe CM cases with greater degree of CNS tissue motion. However, the pattern of hydrodynamic alterations observed in the present study are expected to be similar even with a greater degree of motion.
Geometric segmentation of the MRI images was completed by a single operator. Inter-operator variation in this segmentation will impact the CFD results. However, the observed alterations in CSF dynamics due to CNS tissue motion are expected to be similar for a similar segmentation from a different operator. The motion obtained for the spinal cord and tonsils could be altered by a different mask selection. In this study, many voxels were present in each mask and thus, omission/addition of some voxels on the edge of the mask is not expected to alter the averaged motion waveform to a great degree.
Tissue motion of the spinal cord and cerebellar tonsils were measured and imposed in the CFD model solely in the craniocaudal direction. Significant difference in magnitude and direction of lateral motion of tonsils, spinal cord, and medulla has been reported CM patients and controls 33. Wolpert et al. 33 reported a pronounced posteroanterior motion of the medulla in CM patients compared to controls. More accurate CFD models including three-directional motion of CNS tissues could help to understand the possible significance of CNS tissue motion in other directions.
The modeling approach used in this study did not account for the 2-way fluid-structure interaction (FSI) between CSF and its surrounding CNS tissue. Adding FSI component to the current moving boundary model may lead to more a more accurate CFD simulation. Also, the current model did not include secondary motion caused by tissue-to-tissue contact. The cranial end of the tonsil geometry was truncated within a region of space so that contact between the tonsil and surrounding dura and nearby spinal cord did not occur. An FSI simulation that includes contact and the resulting internal stresses within the soft and highly anisotropic CNS tissues is technically challenging and little information is available on the material properties of CNS tissues. As such, the approach of this study was to model a case with a degree of motion appropriate for simulation using the moving boundary technique with rigid walls.
6 Conclusion
A patient-specific moving-boundary CFD study was completed to understand how CNS tissue motion can alter CSF dynamics near the CMJ. The results showed that a small degree of CNS tissue motion (tonsillar displacement ~150 μm) can have an important impact on CSF dynamics at the CMJ. The impact of CNS tissue motion was more pronounced near the FM where the CMJ space was restricted by tonsillar descent. At this location, the CSF dynamics were most altered when peak tonsillar velocity occurred and not at peak tissue displacement, when the SAS had the smallest volume.
Supplementary Material
Pulsatile motion of CNS tissue motion and the resulting deformation in the computational grid. Cerebral tonsils and spinal cord tissues are show in transparent purple and greet respectively.
Acknowledgments
Authors would like to appreciate Conquer Chiari and National Institutes of Health (NIH) (Grant No. 1R15NS071455-01) for the support of this work. The authors also thank Nicholas Shaffer for helping with the post-processing of MRI data.
Abbreviations
- CSF
cerebrospinal fluid
- CNS
central nervous system
- CMJ
cervical-medullary junction
- SAS
subarachnoid space
- CM
Chiari malformation
- PCMRI
phase-contrast magnetic resonance imaging
- CFD
computational fluid dynamics
- FM
foramen magnum
- HR
heart rate
- ROI
region of interest
- FOV
field of view
- TR
repetition time
- TE
echo time
- SPACE
sampling perfection with application optimized contrasts using different flip angle evolutions
- BC
boundary condition
- ILI
integrated longitudinal impedance
- WSS
wall shear stress
- SBM
static baseline model
- DM
dynamic model
- SSM
static systolic model
- SDM
static diastolic model
- DENSE
displacement encoded stimulated echo
- FSI
fluid-structure interaction
Appendices
Independence studies
The independence studies were carried out for computational grid size, time-step size and period number using the following methods. Three different meshes with total cell counts of 0.6, 1.6 and 7.8 million elements were used to evaluate grid independence. Magnitude of peak velocities obtained from each of these meshes were compared at six axial planes along the geometry (figure 1) at four different time points corresponding to peak systolic flow, peak diastolic flow, maximum displacement of CNS tissues, and maximum velocity of CNS tissues motion.
Independence of the results from period number and time-step size were evaluated by comparing the same parameters obtained from the first 4 cycles and among the models with three different time-step sizes of T/100, T/200, and T/400 respectively, where T is the length of one cardiac cycle.
Peak velocities were compared by defining the relative error, e, as:
| (2.2) |
where Vpeak is peak velocity calculated on each of the six planes and at each desired time point. The subscripts “medium” and “fine” refer to calculations carried out with the medium and fine grid/time step size respectively. They also represent the parameters reported in the 3rd and 4th cycles respectively. Table 1 shows the values of the relative error in peak velocity calculations at each time point as averaged over the six axial planes. Based on these results, all of the simulations were carried out using the medium computational grid size and T/200 time steps size and their results were reported on the 3rd cycle.
Table 1.
Summary of the results obtained from independence studies – values shows mean±SD of the relative error values among six axial plane.
| Independence study | Parameter to study | Constant parameters | Relative error for Vpeak (%)
|
|||
|---|---|---|---|---|---|---|
| @ peak systole | @ peak diastole | @ peak tissue displacement | @ peak tissue velocity | |||
|
| ||||||
| Grid size (GS) | 0.55 M 1.6 M 7.8 M |
TS = T/200 PN = 3 |
2.1±2.4 | 3.4±1.3 | 3.9±3.3 | 3.6±2.3 |
|
| ||||||
| Time step size (TS) | T/100 T/200 T/400 |
GS = 1.6 M PN = 3 |
0.4±0.4 | 0.4±0.3 | 0.9±0.8 | 0.2±0.5 |
|
| ||||||
| Period number (PN) | 2 3 4 |
GS = 1.6 M TS = T/200 |
1.1±0.7 | 0.8±0.6 | 2.2±1.9 | 2.5±1.4 |
(MS = mesh size, PN = period number, M = million cells, T = cycle period in seconds, TS = time-step size in seconds)
Footnotes
Conflict of interest
Authors have no conflict of interests.
References
- 1.Editorial: Lumbar puncture. Br Med J. 1975;1:3. [PMC free article] [PubMed] [Google Scholar]
- 2.Alperin N, Loftus JR, Oliu CJ, Bagci A, Lee SH, Ertl-Wagner B, Green B, Sekula R. MRI Measures of Posterior Cranial Fossa Morphology and CSF Physiology in Chiari Malformation Type I. Neurosurgery. 2014 doi: 10.1227/NEU.0000000000000507. [DOI] [PMC free article] [PubMed] [Google Scholar]
- 3.Bertram CD, Bilston LE, Stoodley MA. Tensile radial stress in the spinal cord related to arachnoiditis or tethering: a numerical model. Med Biol Eng Comput. 2008;46:701–707. doi: 10.1007/s11517-008-0332-0. [DOI] [PubMed] [Google Scholar]
- 4.Bloomfield IG, I, Johnston H, Bilston LE. Effects of proteins, blood cells and glucose on the viscosity of cerebrospinal fluid. Pediatr Neurosurg. 1998;28:246–251. doi: 10.1159/000028659. [DOI] [PubMed] [Google Scholar]
- 5.Bunck AC, Kroeger JR, Juettner A, Brentrup A, Fiedler B, Crelier GR, Martin BA, Heindel W, Maintz D, Schwindt W, Niederstadt T. Magnetic resonance 4D flow analysis of cerebrospinal fluid dynamics in Chiari I malformation with and without syringomyelia. European Radiology. 2012;22:1860–1870. doi: 10.1007/s00330-012-2457-7. [DOI] [PubMed] [Google Scholar]
- 6.Cirovic S. A coaxial tube model of the cerebrospinal fluid pulse propagation in the spinal column. J Biomech Eng. 2009;131:021008. doi: 10.1115/1.3005159. [DOI] [PubMed] [Google Scholar]
- 7.Clarke EC, Stoodley MA, Bilston LE. Changes in temporal flow characteristics of CSF in Chiari malformation Type I with and without syringomyelia: implications for theory of syrinx development Clinical article. Journal of Neurosurgery. 2013;118:1135–1140. doi: 10.3171/2013.2.JNS12759. [DOI] [PubMed] [Google Scholar]
- 8.Cousins J, Haughton V. Motion of the cerebellar tonsils in the foramen magnum during the cardiac cycle. AJNR Am J Neuroradiol. 2009;30:1587–1588. doi: 10.3174/ajnr.A1507. [DOI] [PMC free article] [PubMed] [Google Scholar]
- 9.du Boulay G, Shah SH, Currie JC, Logue V. The mechanism of hydromyelia in Chiari type 1 malformations. Br J Radiol. 1974;47:579–587. doi: 10.1259/0007-1285-47-561-579. [DOI] [PubMed] [Google Scholar]
- 10.Enzmann DR, Pelc NJ. Brain motion: measurement with phase-contrast MR imaging. Radiology. 1992;185:653–660. doi: 10.1148/radiology.185.3.1438741. [DOI] [PubMed] [Google Scholar]
- 11.Feinberg DA, Mark AS. Human brain motion and cerebrospinal fluid circulation demonstrated with MR velocity imaging. Radiology. 1987;163:793–799. doi: 10.1148/radiology.163.3.3575734. [DOI] [PubMed] [Google Scholar]
- 12.Franze K, Janmey PA, Guck J. Mechanics in neuronal development and repair. Annu Rev Biomed Eng. 2013;15:227–251. doi: 10.1146/annurev-bioeng-071811-150045. [DOI] [PubMed] [Google Scholar]
- 13.Hajdu SI. A note from history: discovery of the cerebrospinal fluid. Ann Clin Lab Sci. 2003;33:334–336. [PubMed] [Google Scholar]
- 14.Heidari Pahlavian S, Yiallourou T, Tubbs RS, Bunck AC, Loth F, Goodin M, Raisee M, Martin BA. The Impact of Spinal Cord Nerve Roots and Denticulate Ligaments on Cerebrospinal Fluid Dynamics in the Cervical Spine. PLoS ONE. 2014;9:e91888. doi: 10.1371/journal.pone.0091888. [DOI] [PMC free article] [PubMed] [Google Scholar]
- 15.Heiss JD, Suffredini G, Smith R, DeVroom HL, Patronas NJ, Butman JA, Thomas F, Oldfield EH. Pathophysiology of persistent syringomyelia after decompressive craniocervical surgery. Clinical article. J Neurosurg Spine. 2010;13:729–742. doi: 10.3171/2010.6.SPINE10200. [DOI] [PMC free article] [PubMed] [Google Scholar]
- 16.Hofmann E, Warmuth-Metz M, Bendszus M, Solymosi L. Phase-contrast MR imaging of the cervical CSF and spinal cord: volumetric motion analysis in patients with Chiari I malformation. AJNR Am J Neuroradiol. 2000;21:151–158. [PMC free article] [PubMed] [Google Scholar]
- 17.Hsu Y, Hettiarachchi HD, Zhu DC, Linninger AA. The frequency and magnitude of cerebrospinal fluid pulsations influence intrathecal drug distribution: key factors for interpatient variability. Anesthesia and Analgesia. 2012;115:386–394. doi: 10.1213/ANE.0b013e3182536211. [DOI] [PubMed] [Google Scholar]
- 18.Kalata W, Martin BA, Oshinski JN, Jerosch-Herold M, Royston TJ, Loth F. MR Measurement of Cerebrospinal Fluid Velocity Wave Speed in the Spinal Canal. IEEE Trans Biomed Eng. 2009 doi: 10.1109/TBME.2008.2011647. [DOI] [PubMed] [Google Scholar]
- 19.Lee L. Riding the wave of ependymal cilia: Genetic susceptibility to hydrocephalus in primary ciliary dyskinesia. J Neurosci Res. 2013 doi: 10.1002/jnr.23238. [DOI] [PubMed] [Google Scholar]
- 20.Loth F, Yardimci MA, Alperin N. Hydrodynamic modeling of cerebrospinal fluid motion within the spinal cavity. J Biomech Eng. 2001;123:71–79. doi: 10.1115/1.1336144. [DOI] [PubMed] [Google Scholar]
- 21.Martin BA, Kalata W, Loth F, Royston TJ, Oshinski JN. Syringomyelia hydrodynamics: An in vitro study based on in vivo measurements. Journal of Biomechanical Engineering-Transactions of the Asme. 2005;127:1110–1120. doi: 10.1115/1.2073687. [DOI] [PubMed] [Google Scholar]
- 22.Martin BA, Kalata W, Shaffer N, Fischer P, Luciano M, Loth F. Hydrodynamic and longitudinal impedance analysis of cerebrospinal fluid dynamics at the craniovertebral junction in type I Chiari malformation. PLoS ONE. 2013;8:e75335. doi: 10.1371/journal.pone.0075335. [DOI] [PMC free article] [PubMed] [Google Scholar]
- 23.Martin BA, Labuda R, Royston TJ, Oshinski JN, Iskandar B, Loth F. Spinal Subarachnoid Space Pressure Measurements in an In Vitro Spinal Stenosis Model: Implications on Syringomyelia Theories. Journal of Biomechanical Engineering-Transactions of the Asme. 2010;132 doi: 10.1115/1.4000089. [DOI] [PubMed] [Google Scholar]
- 24.Nitz WR, Bradley WG, Jr, Watanabe AS, Lee RR, Burgoyne B, O’Sullivan RM, Herbst MD. Flow dynamics of cerebrospinal fluid: assessment with phase-contrast velocity MR imaging performed with retrospective cardiac gating. Radiology. 1992;183:395–405. doi: 10.1148/radiology.183.2.1561340. [DOI] [PubMed] [Google Scholar]
- 25.Oldfield EH, Muraszko K, Shawker TH, Patronas NJ. Pathophysiology of syringomyelia associated with Chiari I malformation of the cerebellar tonsils. Implications for diagnosis and treatment. J Neurosurg. 1994;80:3–15. doi: 10.3171/jns.1994.80.1.0003. [DOI] [PubMed] [Google Scholar]
- 26.Patankar S. Numerical Heat Transfer and Fluid Flow. Taylor & Francis; 1980. [Google Scholar]
- 27.Pujol J, Roig C, Capdevila A, Pou A, Marti-Vilalta JL, Kulisevsky J, Escartin A, Zannoli G. Motion of the cerebellar tonsils in Chiari type I malformation studied by cine phase-contrast MRI. Neurology. 1995;45:1746–1753. doi: 10.1212/wnl.45.9.1746. [DOI] [PubMed] [Google Scholar]
- 28.Quigley MF, Iskandar B, Quigley ME, Nicosia M, Haughton V. Cerebrospinal fluid flow in foramen magnum: temporal and spatial patterns at MR imaging in volunteers and in patients with Chiari I malformation. Radiology. 2004;232:229–236. doi: 10.1148/radiol.2321030666. [DOI] [PubMed] [Google Scholar]
- 29.Shaffer N, Martin BA, Rocque B, Madura C, Wieben O, Iskandar B, Dombrowski S, Luciano M, Oshinski J, Loth F. Cerebrospinal Fluid Flow Impedance is Elevated in Type I Chiari Malformation. J Biomech Eng. 2013 doi: 10.1115/1.4026316. [DOI] [PMC free article] [PubMed] [Google Scholar]
- 30.Stockman HW. Effect of anatomical fine structure on the flow of cerebrospinal fluid in the spinal subarachnoid space. J Biomech Eng. 2006;128:106–114. doi: 10.1115/1.2132372. [DOI] [PubMed] [Google Scholar]
- 31.Terae S, Miyasaka K, Abe S, Abe H, Tashiro K. Increased pulsatile movement of the hindbrain in syringomyelia associated with the Chiari malformation: cine-MRI with presaturation bolus tracking. Neuroradiology. 1994;36:125–129. doi: 10.1007/BF00588077. [DOI] [PubMed] [Google Scholar]
- 32.Williams H. A unifying hypothesis for hydrocephalus, Chiari malformation, syringomyelia, anencephaly and spina bifida. Cerebrospinal Fluid Res. 2008;5:7. doi: 10.1186/1743-8454-5-7. [DOI] [PMC free article] [PubMed] [Google Scholar]
- 33.Wolpert SM, Bhadelia RA, Bogdan AR, Cohen AR. Chiari I malformations: assessment with phase-contrast velocity MR. AJNR Am J Neuroradiol. 1994;15:1299–1308. [PMC free article] [PubMed] [Google Scholar]
- 34.Yiallourou TI, Kroger JR, Stergiopulos N, Maintz D, Martin BA, Bunck AC. Comparison of 4D phase-contrast MRI flow measurements to computational fluid dynamics simulations of cerebrospinal fluid motion in the cervical spine. PLoS ONE. 2012;7:e52284. doi: 10.1371/journal.pone.0052284. [DOI] [PMC free article] [PubMed] [Google Scholar]
- 35.Yiallourou TI, Kröger JR, Stergiopulos N, Maintz D, Martin BA, Bunck AC. Comparison of 4D Phase-Contrast MRI Flow Measurements to Computational Fluid Dynamics Simulations of Cerebrospinal Fluid Motion in the Cervical Spine. PLoS ONE. 2012;7:e52284. doi: 10.1371/journal.pone.0052284. [DOI] [PMC free article] [PubMed] [Google Scholar]
- 36.Zamir M. The Physics of Coronary Blood Flow. Springer US; 2010. [Google Scholar]
- 37.Zhong X, Meyer CH, Schlesinger DJ, Sheehan JP, Epstein FH, Larner JM, Benedict SH, Read PW, Sheng K, Cai J. Tracking brain motion during the cardiac cycle using spiral cine-DENSE MRI. Med Phys. 2009;36:3413–3419. doi: 10.1118/1.3157109. [DOI] [PMC free article] [PubMed] [Google Scholar]
Associated Data
This section collects any data citations, data availability statements, or supplementary materials included in this article.
Supplementary Materials
Pulsatile motion of CNS tissue motion and the resulting deformation in the computational grid. Cerebral tonsils and spinal cord tissues are show in transparent purple and greet respectively.


