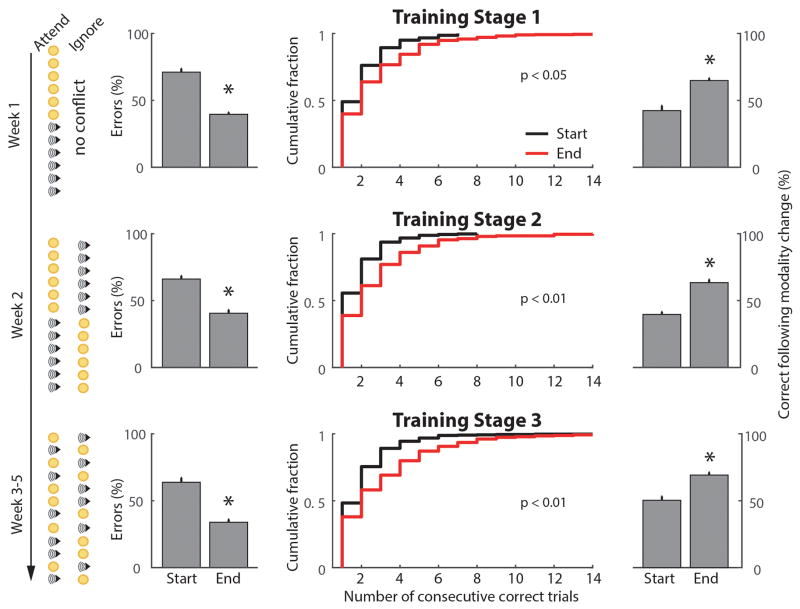
Extended Data Figure 1. Cross-Modal Task Training and Performance Validation.
Quantification of performance across training stages for the cross-modal task. The trial sequence for each training stage is indicated on the left. Improved performance was observed in the last three days of training relative to the first three for each stage. Column 1 shows the reduction in the error fraction (n = 15 mice,* p < 0.05, Wilcoxon Rank-Sum Test), column 2 shows the number of consecutive correct responses (p values shown, KS-Test), column 3 shows the probability of correct response following a modality shift (* p<0.05, Wilcoxon Rank-Sum Test).

