Abstract
Currently, there remains a critical need to develop real-time imaging resources for life sciences. Here, we demonstrate the use of high resolution in situ imaging to observe biological complexes in liquid at the nanoscale. Using a model virus system, we produced the first time-resolved videos of individual biological complexes moving in solution within an electron microscope.
Recent advances in the design and manufacture of nanometer-thick materials has spurred a new era in the imaging field.1, 2 When used in combination with microfluidic devices3, it is now possible to observe electrochemical processes4, the growth of nanoparticles5, drug delivery systems6, and live cellular targeting events7 at unprecedented resolution. We refer to this new innovative mode of imaging as “in situ” microscopy as experiments can now be directly observed “inside” a transmission electron microscope (TEM). Although in situ imaging has gained a great deal of momentum in the materials science field, its application to biological systems is not as widespread. To address this issue, we developed a unique platform to directly observe movements in biological complexes using in situ TEM. Here, we present the first time-resolved movies and mathematical analysis of a model virus system moving in solution at the nanoscale. Specifically, we used purified rotavirus (RV) double-layered particles (DLPs) in our experiments since DLPs can be enzymatically activated in vitro by the addition of nucleotide triphosphates (NTPs) to initiate viral mRNA synthesis.8, 9
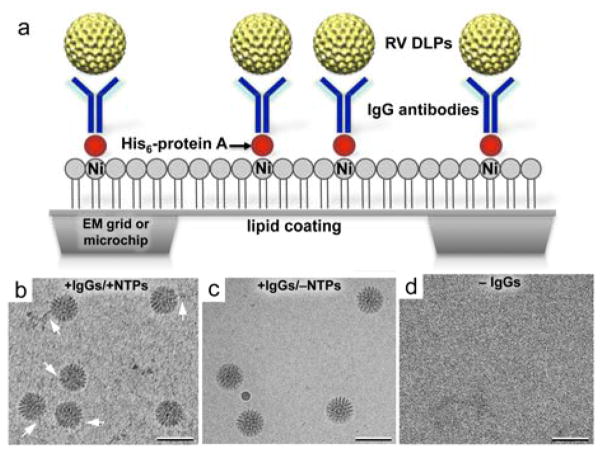
To capture enzymatically active RV DLPs for downstream in situ image recordings, we employed a well-defined immunocapture tethering system. This system promotes the attachment of individual DLPs to surfaces coated with Nickel-nitrilotriacetic acid (Ni-NTA)-containing lipid monolayers and adaptor proteins.10,11 The hydrophobic carbon chains of the lipid layers adhere readily to the naturally hydrophobic surface of carbon-coated EM grids or SiN microchips (Fig 1a). We used lipid monolayers comprised of 25% (v/v) Ni-NTA lipids and 75% (v/v) 1,2-dilauryl-phosphatidylcholine (DLPC) filler lipids (Avanti Polar Lipids). Adaptor proteins including His-tagged (His6) protein A (Abcam) and IgG antibodies against the viral protein (VP6) were added sequentially to the Ni-NTA-coated microchips. Aliquots (3-μl of 0.01 mg ml−1) of His-tagged protein A in buffer solution containing 50 mM HEPES, pH 7.5, 150 mM NaCl, 10 mM MgCl2 and 10 mM CaCl2 were incubated for 1 minute on each EM grid or microchip prior to removing the excess solution by blotting with filter paper. Next, we added 3-μl aliquots of VP6-specific guinea pig polyclonal antisera (#53963; 0.01 mg ml−1) prepared in buffer solution containing 50 mM HEPES (pH 7.5), 150 mM NaCl, 10 mM MgCl2 and 10 mM CaCl2. Following a 1-minute incubation step, the excess solution was removed using a Hamilton syringe (Fig. 1a).
Fig. 1. Tethering DLPs to functionalized surfaces.
(a) Schematic to illustrate the immunocapture procedure used to tether asynchronously transcribing RV DLPs to antibody (IgG)-decorated surfaces via protein A adaptors. (b) Transcribing DLPs tethered to EM grids or SiN microchips in the presence of VP6-specific IgGs showed varying lengths of associated mRNA transcripts (white arrows) in cryo-EM images. (c) DLPs prepared in the absence of nucleotides needed for transcription do not show associated mRNA in cryo-EM images. (e) EM specimens prepared in the absence of IgGs generally failed to recruit DLPs. Scale bar is 100 nm.
In parallel as negative controls, we also prepared 1) DLP samples lacking ATP, a nucleotide needed for enzymatic activation, and 2) protein A-coated microchips lacking IgG antibodies against VP6. All samples were imaged using cryo-EM to assess the specificity of the method. We found that within a 2-minute incubation period, the antibody-decorated microchips could recruit DLPs diluted to 0.1 mg ml−1 in 50 mM HEPES buffer solution (pH 7.5) containing 150 mM NaCl, 20 mM CaCl2 and 20 mM MgCl2, and NTPs (Fig. 1b). DLPs lacking nucleotides could still bind to antibody-decorated surfaces but viral mRNA transcripts were not present in the images (Fig. 1c,). Microchips prepared without antibodies did not recruit appreciable quantities of DLPs (Fig. 1d).
To biochemically verify transcriptional competence of the viral particles, the purified DLPs were subjected to in vitro mRNA synthesis in eppendorf tubes in the presence of [32P]-UTP for 30 minutes at 37°C. Each reaction contained DLPs, NTPs, and [32P]-UTP (Fig. S1a,b +ATP; ESI†). Negative control reactions contained all transcription cocktail components except ATP (Fig. 1a,b -ATP; ESI†). Radiolabeled mRNA products were only detected in the reactions containing complete transcription cocktail; no radiolabeled products were seen in the reaction lacking ATP. Therefore, our functional analysis confirmed that purified DLPs could be enzymatically activated. These results were consistent with previous experiments11 and suggested that the system could be used to recruit and image active DLPs in solution. Therefore, we proceeded to record images of the virus particles using in situ TEM.
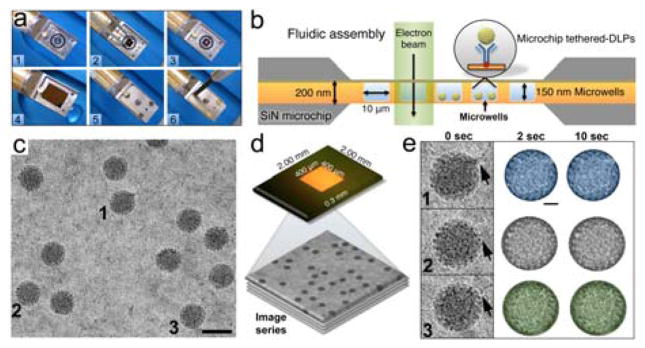
For in situ imaging experiments, we tethered enzymatically-active DLPs as described in Figure 1, onto SiN microchips that were loaded into the Poseidon 200 specimen holder (Protochips, Inc.) (Fig. 2a, b). This tethering step served to limit long-range diffusion of the viral particles in solution during imaging. Each microchip contained central imaging windows (~30-nm thick) that are transparent to the electron beam and form an environmental chamber at the tip of the holder. The bottom chip that defined the base of the assembly contained a 400 × 400 micron array of microwells within the central imaging window.6 Each microwell (10 × 10 microns) was etched down to accommodate a solution thickness of 150 nm. A metal faceplate, held in place by 3 brass screws, was placed on top of the assembled unit. The enclosed DLPs were examined using a FEI Spirit Bio-Twin TEM equipped with a LaB6 filament and operating at 120kV. We recorded at least five image series at time intervals up to 10 seconds (4 frames second−1) while optimizing output conditions. Images were recorded on an Eagle 2k HS CCD camera employing low-dose conditions (~0.1 electrons per Å2) at a 60,000× magnification, yielding a final sampling of 5 Å per pixel. Image series proved reproducible between replicates.
Fig. 2. Microfluidic system for in situ TEM imaging of virus particles.

(a) The microfluidic chamber was assembled by placing O-ring fittings in the empty tip of the holder (steps 1 – 3). A flat chip was placed over top of the wet specimen chip (step 4) and the assembly was covered with a metal face-plate held in place by 3 brass screws (step 5 – 6). (b) Schematic of a cross-section through the fluidic chamber assembly positioned within the EM beam. Integrated microwells (10 × 10 μm) etched into the chip can each accommodate a solution layer of 150 nm thick. (c) Representative image of DLPs in liquid. (d) The base chip contained a transparent imaging window having array of microwells (400 × 400 μm). DLPs were tethered to the base chips and image series were recorded in the EM. (e) Representative DLPs (1 – 3) with viral mRNAs transcripts (black arrows). Width of individual panels is ~120 nm. Individual DLPs were contrast-inverted, masked by a diameter of ~80 nm and colored for visualization purposes. Please see Movies S1 – S3, ESI†.
To produce time-resolved movies of the viral particles in liquid, we selected from the image series representative DLPs having different lengths of RNA strands associated with their exterior shells (Fig. 2c, d). The selected particles were contrast-inverted and arbitrarily colored (blue, gray, and green) for tracking purposes (Fig. 2e). Images sequences of the DLPs within a 10-second time interval were compiled using the iMovie (Apple, Inc.) software package (Fig. S2, Movies S1 – S3, ESI†). The compiled movies revealed real-time movements of the DLPs in the surrounding liquid. We attributed the overall particle movements at the molecular level to Brownian motion, biological activity, beam-induced movement, and beam damage – or some combination of these factors. Another important consideration that can influence protein subunit mobility within individual DLPs is the antibody-tethering step. Although, we did not directly measure the collective forces imposed on the particles by the attached antibodies, we are continuing to investigate these interactions in our on-going experiments.
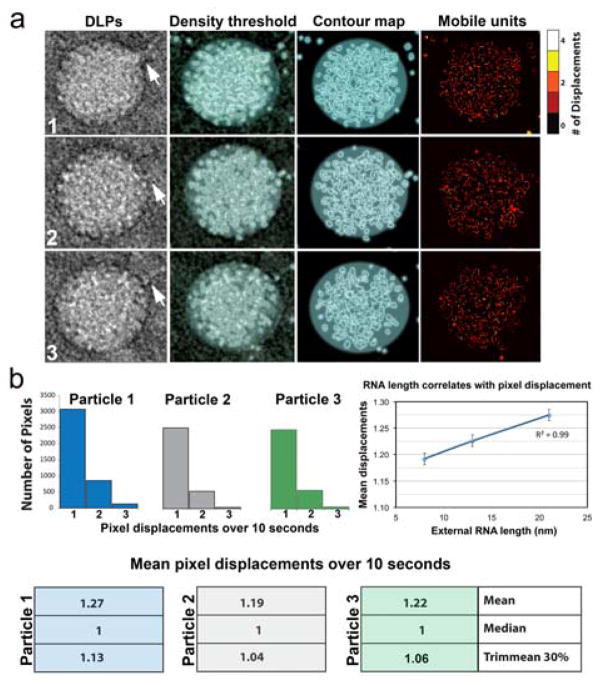
To better visualize mobile units in the DLPs, we segmented the strongest features in the particles by applying a density threshold filter of 3σ, where σ is the standard deviation in the contrast values of each particle image.12 By focusing on these strongest features, we could attenuate noise in the images due to variations in the liquid flow and to some extent, radiolysis. After applying the density threshold, we were able to visualize the highest electron scattering components within each particle image in the series (Fig. 3a). This density included both protein subunits and viral RNA (>12 MDa) that constitutes a significant portion of the DLP (~50 MDa). Representative contour maps within a 10 second timeframe were compiled using the iMovie software package (Movies S4 – S6, ESI†).
Fig. 3. Visualizing and quantifying DLP mobility in liquid.
(a) Representative DLPs (1 – 3) with associated viral mRNA strands (white arrows) were selected from an image series and subjected to a density threshold filter. Contour maps were generated based on a 3σ-cutoff, highlighting pixel displacements in the particles. Cumulative differences in the mobile units of the viral particles were represented in heat maps using a scale of 0 – 4 to indicate the number of pixel displacements within a 10-second interval. (b) Histograms that represent the total number of pixels displacements within 10 seconds revealed non-uniform movements between the DLPs. Means pixel displacement values are also summarized. The plot shows the correlation (R2=0.99) between the mean pixel displacements and the lengths of external RNA associated with each particle. Error bars represent the standard error values for each mean pixel displacement. Please see Movies S4 – S6, ESI†.
The compiled movies of the contoured regions showed the strongest visual differences in the individual virus particles and their associated mRNAs. This information provided a new time-resolved view of biological assemblies in liquid at the nanoscale. We also noted the presence of the viral mRNA transcripts (~10 Å in width) associated with the viral particles at the beginning and the end of the image series (Movies 4 – 6, ESI†). The conserved presence of these fragile mRNA strands throughout the image series supports the idea that beam damage, or beam induced movements do not impose a stronger influence on the observed particle mobility than Brownian motion or biological activity.
To quantify the pixel movements in the particle images over time, the binary thresholded images were combined into time series. The temporal derivative of each pixel returned values of 1 when a pixel changed from empty to full, and -1 when the pixel changed from full to empty. Summing the absolute value of each pixel’s temporal derivative returned a value that represents how frequently each pixel changed value. When applied to the entire time series, we could quantify how much the entire particle moved or changed over the imaging duration (Fig. 3b). This algorithm unlike nearest neighbor, cluster detection, or cross-correlation calculations has no assumptions about whether a particle moved into or out of a feature. Summary data for the three representative particles demonstrated that Particle 1 (blue) exhibited statistically more pixel displacements than the other particles examined over a 10 second timeframe. Particle 2 (gray) showed the least overall mean pixel displacements, while Particle 3 (green) displayed an intermediate value of mean pixel displacements (Fig. 3b). A heat map summarizing the positions of the cumulative movements for each particle is given in Figure 3a.
To build upon these measurements, we also quantified the lengths of the mRNA strands surrounding each particle, starting from the edge of the DLPs and extending to a 150-nm region in all directions. The total length of mRNA that surrounded Particle 1 (blue) was ~21 nm. Particle 2 (gray) was surrounded by ~8 nm of mRNA, while ~13 nm of mRNA surrounded Particle 3 (green). We plotted the mean pixel displacements for each particle versus the relative lengths of associated mRNAs. These values represented a combination of more than 10,000 pixel movements in total. Upon examining a linear regression analysis of these measurements, we found a strong correlation (R2=0.99) existed (Fig. 3b). This information suggested that particles having more mobile units were associated with greater quantities of viral mRNAs. Although, the asynchronous nature of the DLPs does not permit us to fully determine the history of each particle, the use of these newly developed tools and analysis can be used to probe more deeply into viral transcription events in future experiments.
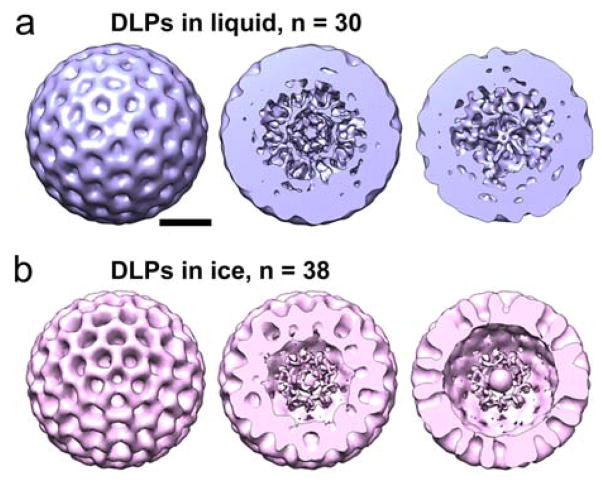
To validate the integrity of the DLPs used in our analysis, we calculated a 3D image reconstruction on the initial image in the series. We used the PARTICLE software package to select 30 individual DLPs from the image as previously described.6 For reference, when imposing icosahedral (60-fold symmetry) during the reconstruction phase, 30 particles equates to 1800 asymmetric particles. The selected particles were then exported into the RELION software package13. Using RELION, we calculated a 3D structure of the DLPs while enforcing icosahedral symmetry operators over an angular search space of 7.5° throughout 25 cycles of refinement (Fig. 4a). Refinement parameters in RELION included a DLP reference model14 low-pass filtered to 50 Å, a pixel size of 5 Å, and a regularization parameter of T = 4. Consistent with previous 3D structures of enzymatically activated particles,6 the resulting reconstruction of the DLPs in liquid showed dynamic features in their core interiors at ~2.8 nm-resolution (Fig. 4a).
Fig. 4. 3D structures of DLPs reveal internal densities in liquid and ice specimens.
(a) A 3D reconstruction was calculated for actively transcribing particles in a liquid environment. Cross-sections of the reconstruction are show at ~20-nm intervals to the midsection. The diameter of the reconstruction is ~80-nm. (b) A 3D reconstruction was calculated for frozen-hydrated particles using the same image processing steps and while imposing icosahedral symmetry during the refinement procedure. The diameter of the resulting reconstruction is ~80-nm. Scale bar is 30 nm.
As an additional control, we analysed images of frozen-hydrated active DLPs. We implemented the same computing procedures and calculated a reconstruction using 38 particles from a single EM image while enforcing icosahedral symmetry. For reference, when enforcing icosahedral (60-fold symmetry) during the reconstruction phase, 38 particles equates to 2280 asymmetric particles. We chose to use slightly more particles for the cryo-EM calculations as we anticipated more views of the static DLPs would be needed to equate with the fluid system. The resulting 3D structure was strikingly similar to the DLP reconstruction in liquid and resolved to ~2.5 nm. (Fig. 4b). A notable difference between reconstructions calculated for DLPs in ice and liquid is that the liquid structure had a continuum of density throughout the particles while the ice structure had more rigidly defined segmented features visible in cross-sections through the density map (Fig. 4a, b). These differences may be due to a lack of fluidity in the captured particles resulting from the specimen freezing process. Overall, the 3D structural information in both the liquid and ice preparations complements the time-resolved measurements by ensuring the proper integrity of the activated viral assemblies.
As we continue to make progress toward real-time molecular imaging of biological systems, one item that can elevate our efforts is the use of direct electron detectors. These new detectors can operate in movie-mode at lower magnifications to further minimize issues of electron dose and frame rate. In addition, the use of thinner silicon nitride windows or graphene liquid cells may enable us to gather more information of how single-stranded mRNA transcripts emerge from viral particles. Similarly, reducing the thickness of the liquid cell in general could enable us to view protein-protein interactions or other viral processes. Improving each of these technologies will be important as we move toward examining smaller, active biological macromolecules. Smaller biological entities are weak phase contrast objects and pose a great challenge to image in liquid with currently available resources. On course with data presented here, molecular imaging of biological assemblies at the nanoscale inspires a new era in microscopy, with the potential to further decode life processes and improve our knowledge of human health worldwide.
Supplementary Material
Acknowledgments
The authors acknowledge the following funding sources that supported this work, 1R21AI113402-01 NIAID/NIH (D.F.K., S.M.M) and 1R01AI116815-01 NIAID/NIH (D.F.K., S.M.M).
Footnotes
Electronic supplementary information (ESI) available: Full description of experimental methods, biochemical results, and real-time movies of virus particles in solution are available as supplemental materials.
Notes and references
- 1.Ring EA, Peckys DB, Dukes MJ, Baudoin JP, de Jonge N. Silicon nitride windows for electron microscopy of whole cells. J Microsc-Oxford. 2011;243:273–283. doi: 10.1111/j.1365-2818.2011.03501.x. [DOI] [PMC free article] [PubMed] [Google Scholar]
- 2.Yuk JM, et al. High-resolution EM of colloidal nanocrystal growth using graphene liquid cells. Science. 2012;336:61–64. doi: 10.1126/science.1217654. [DOI] [PubMed] [Google Scholar]
- 3.Ring EA, de Jonge N. Microfluidic system for transmission electron microscopy. Microsc Microanal. 2010;16:622–629. doi: 10.1017/S1431927610093669. [DOI] [PubMed] [Google Scholar]
- 4.Radisic A, Vereecken PM, Hannon JB, Searson PC, Ross FM. Quantifying electrochemical nucleation and growth of nanoscale clusters using real-time kinetic data. Nano Lett. 2006;6:238–242. doi: 10.1021/nl052175i. [DOI] [PubMed] [Google Scholar]
- 5.Park J, et al. Direct observation of nanoparticle superlattice formation by using liquid cell transmission electron microscopy. ACS Nano. 2012;6:2078–2085. doi: 10.1021/nn203837m. [DOI] [PubMed] [Google Scholar]
- 6.Dukes MJ, et al. Improved microchip design and application for in situ transmission electron microscopy of macromolecules. Microsc Microanal. 2014;20:338–345. doi: 10.1017/S1431927613013858. [DOI] [PubMed] [Google Scholar]
- 7.Pohlmann ES, et al. Real-time visualization of nanoparticles interacting with glioblastoma stem cells. Nano Lett. 2015;15:2329–2335. doi: 10.1021/nl504481k. [DOI] [PubMed] [Google Scholar]
- 8.Lawton JA, Estes MK, Prasad BV. Three-dimensional visualization of mRNA release from actively transcribing rotavirus particles. Nat Struct Biol. 1997;4:118–121. doi: 10.1038/nsb0297-118. [DOI] [PubMed] [Google Scholar]
- 9.Lawton JA, Estes MK, Prasad BV. Comparative structural analysis of transcriptionally competent and incompetent rotavirus-antibody complexes. Proc Natl Acad Sci U S A. 1999;96:5428–5433. doi: 10.1073/pnas.96.10.5428. [DOI] [PMC free article] [PubMed] [Google Scholar]
- 10.Degen K, Dukes M, Tanner JR, Kelly DF. The development of affinity capture devices-a nanoscale purification platform for biological in situ transmission electron microscopy. Rsc Adv. 2012;2:2408–2412. [Google Scholar]
- 11.Gilmore BL, et al. Visualizing viral assemblies in a nanoscale biosphere. Lab Chip. 2013;13:216–219. doi: 10.1039/c2lc41008g. [DOI] [PubMed] [Google Scholar]
- 12.Frank J. Three-dimensional electron microscopy of macromolecular assemblies: visualization of biological molecules in their native state. 2. Oxford University Press; 2006. [Google Scholar]
- 13.Scheres SH. A Bayesian view on cryo-EM structure determination. J Mol Biol. 2012;415:406–418. doi: 10.1016/j.jmb.2011.11.010. [DOI] [PMC free article] [PubMed] [Google Scholar]
- 14.Zhang X, et al. Near-atomic resolution using electron cryomicroscopy and single-particle reconstruction. Proc Natl Acad Sci U S A. 2008;105:1867–1872. doi: 10.1073/pnas.0711623105. [DOI] [PMC free article] [PubMed] [Google Scholar]
- 15.Frank J, et al. SPIDER and WEB: processing and visualization of images in 3D electron microscopy and related fields. J Struct Biol. 1996;116:190–199. doi: 10.1006/jsbi.1996.0030. [DOI] [PubMed] [Google Scholar]
Associated Data
This section collects any data citations, data availability statements, or supplementary materials included in this article.


