

Abstract
Allele-specific sequencing reads provide a powerful signal for identifying molecular quantitative trait loci (QTLs), however they are challenging to analyze and prone to technical artefacts. Here we describe WASP, a suite of tools for unbiased allele-specific read mapping and discovery of molecular QTLs. Using simulated reads, RNA-seq reads and ChIP-seq reads, we demonstrate that WASP has a low error rate and is far more powerful than existing QTL mapping approaches.
Next generation sequencing data can be used to identify allele-specific signals because reads that overlap heterozygous sites can be assigned to one chromosome or the other. Molecular QTLs are associated with allelic imbalance1–4, and thus allele-specific reads can potentially augment the power of statistical tests for QTL discovery5,6. However, use of allele-specific reads can introduce artefacts into many stages of analysis. Uncorrected mapping of allele-specific reads can be highly biased and can easily yield false signals of allelic imbalance7,8. Homozygous sites which are incorrectly called as heterozygous are another source of false positives, and allele-specific read counts are overdispersed compared to the theoretical expectation of a binomial distribution9. Here we describe a suite of tools called WASP that is designed to overcome these technical hurdles. WASP carefully maps allele-specific reads, corrects for incorrect heterozygous genotypes and other sources of bias, and models overdispersion of sequencing reads. Finally, by integrating allele-specific information into a QTL mapping framework WASP attains greater power than standard QTL mapping approaches.
Mapping of reads to a reference genome is biased by sequence polymorphisms7. Reads which contain the non-reference allele may fail to map uniquely or map to a different (incorrect) location in the genome7. A common approach is to map to a ‘personalized’ genome where the reference sequence is replaced by non-reference alleles that are known to be present in the sample10. However, personalized genomes do not fully address the mapping problem because the genomic locations that are uniquely mappable in the reference and non-reference genome sequences differ (Fig. 1a). While these type of errors may only affect a small number of sites, they comprise a large fraction of the most significant results when tests of allelic imbalance are performed genome-wide. Genomic DNA sequencing reads can also be used to control for mapping bias, however this method reduces power to detect allelic imbalance11.
Figure 1.

Mapping of allele specific reads. (a) Mapping to ‘personalized’ genomes can result in allelic bias because reads from one allele may not map uniquely. (b) Schematic of mapping pipeline to remove allelic bias. (c) The percentage of simulated 100 bp reads at heterozygous sites where a read with one allele maps correctly and the corresponding read with the other allele does not. Reads were simulated with sequencing errors introduced at several different rates. (d) The fraction of false-positives as a function of the effect size using a nominal Benjamini-Hochberg false-discovery rate of 10%. We simulated 100 bp allele-specific reads under null (odds ratio = 1) and alternative models (odds-ratio > 1) of allelic imbalance at heterozygous sites in the genome. 90% and 10% of sites were assumed to be null and alternative sites respectively. We mapped reads using WASP, personal-genome (AlleleSeq10) or N-masked-genome mapping strategies and called allele-specific sites using a binomial test.
WASP uses a simple approach to overcome mapping bias that can be readily incorporated into any read mapping pipeline. First, reads are mapped normally using a mapping tool selected by the user; mapped reads that overlap single nucleotide polymorphisms (SNPs) are then identified. For each read that overlaps a SNP, its genotype is swapped with that of the other allele and it is re-mapped. If a re-mapped read fails to map to exactly the same location, it is discarded (Fig. 1b). Unknown polymorphisms in the sample are not considered but will typically have little effect since the tests of allelic imbalance are only performed at known heterozygous sites. We performed a simulation to assess the impact of unknown polymorphisms and found that the proportion of heterozygous sites with biased mapping is very small (Supplementary Fig. 1 and Supplementary Note 1).
We evaluated the performance of WASP’s remapping method by simulating reads at heterozygous sites in a lymphoblastoid cell line (LCL) that has been completely genotyped and phased (GM12878). At each heterozygous SNP we simulated all possible overlapping reads from both haplotypes, additionally allowing reads to contain mismatches at a predefined sequencing error rate. We mapped the simulated reads using three approaches to account for mapping bias: mapping to a genome with N-masked SNPs, mapping to a personalized genome using AlleleSeq10, and mapping to the genome using WASP. While reads mapped to the N-masked and personalized genomes were substantially biased and gave rise to a large number of false positives, reads mapped using WASP were almost perfectly balanced (Fig. 1c,d).
One disadvantage of WASP’s approach is that some reads are discarded, which can cause the overall expression level of a locus to be underestimated. Several statistical methods can recover ambiguously mapped reads12,13, however, they are not designed for unbiased allele-specific mapping and incorporating them into WASP would be technically challenging.
WASP employs a number of techniques to remove noise and biases from mapped reads. Amplification bias is a common feature of experiments that yield libraries with low complexity (e.g. ChIP-seq). To control for amplification bias it is common to remove ‘duplicate’ reads that map to the same location. However, existing tools that remove duplicate reads retain the one with the highest mapping score, which will usually match the reference14. WASP provides a tool to filter duplicate reads at random, thus eliminating reference bias from this step.
GC content often affects read depth in a manner that is inconsistent between sequencing experiments3,15. In addition, the distribution of read depths across the genome differs from experiment to experiment. For example, ChIP-seq experiments with more efficient pull-downs tend to have more reads within peaks. WASP corrects for both of these issues by fitting polynomials to the genome-wide read counts and calculating a corrected read depth for each region (Supplementary Note 2).
Both allele-specific and total read depth counts are more dispersed than expected under models of binomial and Poisson sampling9,16. To accommodate overdispersion in the data, WASP estimates separate overdispersion parameters for each individual and genomic region used in a study (Supplementary Note 3). Finally, to account for any remaining unknown covariates, WASP allows principal components to be included in the model fitting procedure (Supplementary Note 4).
Following correction for biases described above, WASP uses a statistical test, the combined haplotype test (CHT), to identify cis-acting QTLs. The CHT tests whether the genotype of a ‘test SNP’ is associated with total read depth and allelic imbalance in a ‘target region’ (Fig. 2a). The CHT jointly models two components: the allelic imbalance at phased heterozygous SNPs and the total read depth in the target region. The two components of the test are linked together by shared parameters that define their effect sizes.
Figure 2.
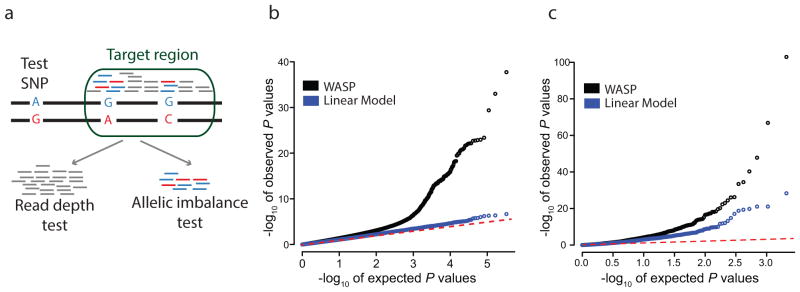
The combined haplotype test and its performance. (a) Schematic of the combined haplotype test. A ‘test SNP’ is tested for association with mapped reads within a ‘target region’. All reads are used by the read depth component of the test; allele-specific reads are used by the allelic imbalance component of the test. (b) Identification of novel QTLs using H3K27ac ChIP-seq data from 10 Yoruba lymphoblastoid cell lines. (c) Identifying European eQTLs from the GEUVADIS consortium using an independent dataset of RNA-seq from 69 Yoruba lymphoblastoid cell lines.
For a target region and test SNP pair, the CHT models the expected number of reads for an individual as a function of the individual’s genotype, the effect size, the GC content, additional covariates (such as principal component loadings), and the total number of mapped reads in the region (across all individuals). The probability of the observed number of reads in the target region is calculated using the expected number of reads and two overdispersion parameters.
Allelic imbalance of reads overlapping heterozygous SNPs within a target region is modeled as a function of the shared effect size parameters. The probability of the observed allele-specific read counts is then defined by the effect size and a single overdispersion parameter. We also allow for the possibility of genotyping errors by assuming that allele-specific read counts are drawn from a mixture, with a small probability that a given individual is a mistyped homozygote. WASP combines information across multiple heterozygous sites and the current implementation assumes that haplotype phasing is correct. Incorrect phasing will decrease WASP’s power to detect associations (Supplementary Note 5) but will not increase false positives.
To evaluate the performance of WASP on a small dataset, we used it to call novel QTLs genome-wide using data from H3K27ac ChIP-seq experiments that were performed in 10 LCLs16. Remarkably, WASP identifies 2426 H3K27ac QTLs (10% FDR), whereas a linear regression approach is unable to identify any (Fig. 2b and Supplementary Note 5).
We also evaluated the ability of WASP to call gene expression QTLs (eQTLs) in a larger dataset (Fig 2c and Supplementary Note 5). We obtained a set of 2098 eQTLs identified in 52 LCLs derived from European individuals17. We tested whether we could identify these eQTLs, using an independent dataset of RNA-seq from 69 Yoruba LCLs3. WASP discovers 627 of the eQTLs at a false discovery rate (FDR) of 10%, which is impressive considering (1) our smaller sample size, (2) that some fraction of the original eQTLs are false positives, and (3) that some of the European eQTLs will be absent or at very low frequency in the Yoruba. This number increases to 673 when 5 principal components are included as covariates. By comparison, when we adopt a standard eQTL discovery method (linear regression on quantile normalized and GC-corrected data), we identify only 446 eQTLs (617 when 5 principal components are included as co-variates). P values obtained by running the CHT on the same dataset with permuted genotypes do not depart substantially from the null expectation, indicating that the test is well-calibrated (Supplementary Fig. 2).
We compared the CHT to several other methods by simulating reads under null and alternative models of genetic association (Supplementary Fig. 3 and Supplementary Note 6). For small samples (10 or 20 individuals), the CHT outperforms all other tests, but for large samples (50 or 100 individuals) TReCASE6 performs similarly well. Like the CHT, TreCASE uses both allelic imbalance and read depth information, however it does not account for overdispersion, genotyping errors, or biased mapping, which increase the false positive rate when using real data.
WASP can only test for gene-level expression differences and does not consider the expression of individual transcript isoforms. Some QTLs detected by WASP may therefore be due to differences in isoform usage rather than differences in overall gene expression18,19.
Our results demonstrate that WASP is a powerful approach for the identification of molecular QTLs, particularly when sample sizes are small. WASP accounts for numerous biases in allele-specific data and is flexible enough to work with different read mappers and multiple types of sequencing data such as ChIP-seq and RNA-seq. By modeling biases and dispersion differences directly, WASP eliminates the need for quantile normalization of the data, thereby making estimated effect sizes more interpretable.
The source code and documentation for WASP are open source and can be downloaded from https://github.com/bmvdgeijn/WASP/.
Online Methods
Unbiased read mapping with WASP
To detect differences in molecular phenotypes from sequencing data it is essential to remove read mapping biases, which are a major source of false positives. The WASP read mapping pipeline accomplishes this task by ensuring that the mapping of each individual read is unbiased.
The user first maps reads to the genome using any mapper that outputs BAM or SAM format (Supplementary Fig. 4). For example, ChIP-seq reads can be mapped by BWA or Bowtie 2, and RNA-seq reads can be mapped using tophat. WASP then identifies mapped reads that overlap known polymorphisms. For each read that overlaps a polymorphism, all possible allelic combinations that differ from the original read are generated and re-mapped to the genome. For example, when a read overlaps two bi-allelic SNPs, four allelic combinations are possible, three of which differ from the original read. The original read is discarded if any of the allelic combinations map non-uniquely or map to another location. Reads which overlap insertion or deletion polymorphisms are currently discarded by WASP.
This simple method has the advantages that it works with almost any existing mapping pipeline and it handles reads with sequencing errors, which are a major source of biased mapping7.
Discovery of quantitative trait loci with WASP
To discover molecular quantitative trait loci (QTLs) WASP uses a statistical test, which we call the combined haplotype test (CHT). As input, the CHT takes genotype probabilities at known SNPs as well as mapped reads from sequencing-based experiments such as ChIP-seq or RNA-seq. The CHT combines two types of information: the depth of mapped reads and the allelic imbalance of mapped reads that overlap heterozygous sites. The CHT models the overdispersion of read counts (both across regions and across individuals) and accounts for variability introduced by GC content and the fraction of reads that fall within peaks (Supplementary Fig. 5).
The combined haplotype test
The combined haplotype test (CHT) determines whether the genotype of a test SNP, m, is associated with read depth and allelic imbalance within a nearby target region, j, on the same chromosome (Figure 2a). Each test is performed on a test SNP and target region pair, h = {m, j}. A target region may be discontiguous and span multiple genomic loci. For example, the exons of a gene can be used as a target region when searching for expression QTLs using RNA-seq reads. The test SNP is not required to be within the target region, but is assumed to be nearby and cis-acting. This allows us to combine information from across phased heterozygous SNPs and assign reads to one haplotype or the other. Mathematical variables for the CHT are summarized in Supplementary Table 1.
The basic CHT model
The CHT is a likelihood ratio test with two components. One component models the depth of mapped reads within the target region, and the other component models the allelic-imbalance of reads that overlap heterozygous SNPs. Both components of the test are parameterized by αh and βh, which define the expected read depth from chromosomes with the reference and alternative alleles. Since variants are assumed to be additive and cis-acting, the expected allelic imbalance in heterozygotes is .
Modeling the read depths
The number of reads mapping to a target region is often modeled using a Poisson distribution. However, the Poisson assumption that the variance is equal to the mean is often violated because read counts from target regions are overdispersed. Part of this overdispersion can be accommodated by modeling the data with a negative-binomial distribution with a variance parameter for each test. However, the negative binomial distribution assumes that the mean and variance have a quadratic relationship that is consistent across individuals. We have found that this assumption is violated by sequencing data and causes poor calibration of the tests, particularly when sample sizes are small. The CHT therefore includes negative binomial overdispersion parameters for each individual, Ωi, and for each target region, ϕj. After adding these additional dispersion parameters, the data are modeled with a beta-negative binomial (BNB) distribution. The expected number of read counts for an individual, λhi, is defined as:
where Gim is the genotype of individual i at test SNP m, and Ti is the total number of reads mapped genome-wide for individual i.
The likelihood of the parameters is then given by the equation:
where xij is the number of reads for individual i in target region j.
The CHT can additionally adjust the total reads for each target region and individual by taking into account the GC content and the fraction of reads found in target regions (Supplementary Note 2). To account for unknown co-variates the total reads can also be adjusted using principal component analysis (Supplementary Note 4).
Modeling the allelic imbalances
Allele-specific read counts are sometimes modeled using the binomial distribution, however, we have found that allele-specific read counts are overdispersed. We instead model allele-specific read counts with a beta-binomial (BB) distribution and include a parameter ϒi (estimated separately) that captures the overdispersion for each individual. The likelihood of the parameters given the data is then:
where yik is the number of allele-specific reads from the reference haplotype and nik is the total number of allele-specific reads for individual i at target SNP k. The expected fraction of allele-specific reads from the reference allele is .
Correcting for incorrect genotype calls
SNP genotypes that are incorrectly called as heterozygous are a major source of false positives, since reads that overlap them appear to come from only one allele. To account for this issue, we assume that allele-specific reads are drawn from a mixture of two beta-binomials, with probabilities Hik and 1 − Hik, where Hik is the probability that individual i is heterozygous for SNP k. Reads from heterozygous individuals contain the reference allele with probability ph. We assume that reads from homozygous individuals still have a small probability of coming from the other allele due to sequencing errors, which occur with probability, perr. The probability of observing yik reads from the reference allele for individual i at SNP k then becomes:
We found that even SNPs with heterozygous probabilities of 1.0 are occasionally miscalled so we set heterozygous probabilities to a maximum value of 0.99. We then update this heterozygous probability using sequencing data obtained from the same individual. Sequencing data may consist of DNA sequencing reads or reads aggregated across multiple types of experiments performed on the same individual (e.g. RNA-seq and ChIP-seq reads).
For a SNP with heterozygous probability , we define the updated heterozygous probability, Ĥik as:
The combined likelihood ratio test
The combined likelihood of both components of the model is:
The overdispersion parameters for the combined likelihood model can be estimated using a maximum likelihood approach that uses data from many genomic regions (Supplementary Note 3).
To test for an association with genotype we perform a likelihood ratio test that compares the alternative hypothesis αh ≠ βh to the null hypothesis αh = βh. The CHT returns a likelihood ratio statistic where θ̂1 and θ̂0 are maximum likelihood estimates of the parameters under the alternative and null hypotheses. P values can be calculated from the test statistic under the asymptotic assumption that −2log(Λ) is χ2 distributed with one degree of freedom.
The CHT is robust to non-additive allelic effects (Supplementary Note 7), and has a running time that is linear with the number of individuals in the study (Supplementary Note 8).
Supplementary Material
Acknowledgments
We thank members of the Liu, Pritchard, Stephens and Gilad labs for helpful discussions. We would like to thank X. Shirley Liu’s lab for hosting G.M. as a visitor in the Department of Biostatistics and Computational Biology at the Dana-Farber Cancer Institute while this work was conducted. We thank many early users of WASP, and particularly Christopher DeBoever, who contributed bug fixes and code improvements. This work was supported by the Howard Hughes Medical Institute, NIH grants HG007036, HG006123, MH101825, and GM007197 and by a NSF Graduate Research Fellowship (DGE-0638477) to B.v.d.G.
Footnotes
Author Contributions
B.v.d.G., G.M., J.K.P. and Y.G. conceived of the project. B.v.d.G. and G.M. performed the analyses and implemented the software. G.M. and B.v.d.G. wrote the manuscript with input from all authors. J.K.P. and Y.G. directed the project.
Competing Financial Interests Statement
The authors declare no competing financial interests.
References for main text
- 1.Degner JF, et al. Nature. 2012;482:390–394. doi: 10.1038/nature10808. [DOI] [PMC free article] [PubMed] [Google Scholar]
- 2.Montgomery SB, et al. Nature. 2010;464:773–777. doi: 10.1038/nature08903. [DOI] [PMC free article] [PubMed] [Google Scholar]
- 3.Pickrell JK, et al. Nature. 2010;464:768. doi: 10.1038/nature08872. [DOI] [PMC free article] [PubMed] [Google Scholar]
- 4.Skelly DA, Johansson M, Madeoy J, Wakefield J, Akey JM. Genome research. 2011;21:1728–1737. doi: 10.1101/gr.119784.110. [DOI] [PMC free article] [PubMed] [Google Scholar]
- 5.Harvey CT, et al. Bioinformatics. 2015;31:1235–1242. doi: 10.1093/bioinformatics/btu802. [DOI] [PMC free article] [PubMed] [Google Scholar]
- 6.Sun W. Biometrics. 2012;68:1–11. doi: 10.1111/j.1541-0420.2011.01654.x. [DOI] [PMC free article] [PubMed] [Google Scholar]
- 7.Degner JF, et al. Bioinformatics. 2009;25:3207–3212. doi: 10.1093/bioinformatics/btp579. [DOI] [PMC free article] [PubMed] [Google Scholar]
- 8.Panousis NI, Gutierrez-Arcelus M, Dermitzakis ET, Lappalainen T. Genome biology. 2014;15:467. doi: 10.1186/s13059-014-0467-2. [DOI] [PMC free article] [PubMed] [Google Scholar]
- 9.Anders S, Huber W. Genome biology. 2010;11:R106. doi: 10.1186/gb-2010-11-10-r106. [DOI] [PMC free article] [PubMed] [Google Scholar]
- 10.Rozowsky J, et al. Mol Syst Biol. 2011;7:522. doi: 10.1038/msb.2011.54. [DOI] [PMC free article] [PubMed] [Google Scholar]
- 11.Liu Z, et al. Genet Epidemiol. 2014;38:591–598. doi: 10.1002/gepi.21846. [DOI] [PubMed] [Google Scholar]
- 12.Roberts A, Pachter L. Nat Methods. 2013;10:71–73. doi: 10.1038/nmeth.2251. [DOI] [PMC free article] [PubMed] [Google Scholar]
- 13.Turro E, et al. Genome biology. 2011;12:R13. doi: 10.1186/gb-2011-12-2-r13. [DOI] [PMC free article] [PubMed] [Google Scholar]
- 14.Li H, et al. Bioinformatics. 2009;25:2078–2079. doi: 10.1093/bioinformatics/btp352. [DOI] [PMC free article] [PubMed] [Google Scholar]
- 15.Benjamini Y, Speed TP. Nucleic Acids Res. 2012;40:e72. doi: 10.1093/nar/gks001. [DOI] [PMC free article] [PubMed] [Google Scholar]
- 16.McVicker G, et al. Science. 2013;342:747–749. doi: 10.1126/science.1242429. [DOI] [PMC free article] [PubMed] [Google Scholar]
- 17.Lappalainen T, et al. Nature. 2013;501:506–511. doi: 10.1038/nature12531. [DOI] [PMC free article] [PubMed] [Google Scholar]
- 18.Katz Y, Wang ET, Airoldi EM, Burge CB. Nat Methods. 2010;7:1009–1015. doi: 10.1038/nmeth.1528. [DOI] [PMC free article] [PubMed] [Google Scholar]
- 19.Trapnell C, et al. Nat Biotechnol. 2013;31:46–53. doi: 10.1038/nbt.2450. [DOI] [PMC free article] [PubMed] [Google Scholar]
Associated Data
This section collects any data citations, data availability statements, or supplementary materials included in this article.