Abstract
Objective: To demonstrate feasibility of performing quantitative MRI measurements in an immuno-competent rat model of pancreatic cancer by comparing in vivo anatomic and quantitative imaging measurements to tumor dissemination observations and histologic assays at necropsy. Meterials and methods: Rat ductal pancreatic adenocarcinoma DSL-6A/C1 cell line and Lewis rats were used for these studies. 108 DSL-6A/C1 cells were injected subcutaneously into the right flank of donor rats. Donor tumors reaching 10 mm were excised, and 1 mm3 tumor fragments were implanted within recipient rat pancreas during mini-laparotomy. T1-weighted, T2-weighted, diffusion-weighted, and dynamic contrast-enhanced (DCE) MRI were performed using a Bruker 7.0T ClinScan. After MRI, all animals underwent autopsy. Primary tumor size was measured, and dissemination score was used to assess local invasion and distant metastasis. Primary tumor and all sites of metastases were harvested and fixed for H&E, Masson’s trichrome, and rat anti-CD34 staining. Trichrome slides were scanned and digitized for measurement of fibrotic tissue areas. Anti-CD34 slides were used for microvessel density (MVD) measurements. Results: Primary tumors, local invasion, and distant metastases were confirmed for all rats. No significant differences were found between in vivo MRI measurements (48.7 ± 5.3 mm) and ex vivo caliper measurements (43.6 ± 3.6 mm) of primary tumor sizes (p > .05). Spleen, liver, diaphragm, peritoneum, and abdominal wall metastases were observed on MRI but smaller lung, mediastinum, omen, and mesentery metastases were only observed at necropsy. Contrast uptake observed during DCE measurements was significantly greater in both primary and metastatic tumor tissues compared to skeletal muscle and normal liver tissues. Both primary and metastatic tumors were hyper-intense in T2-weighted images and hypo-intense in T1-weighted images, but no differences were found between quantitative T2 measurements in primary tumors and that in metastases. Similarly, quantitative ADC measurements were similar for both primary tumor and liver metastases (1.13 ± 0.3 × 10⁻³ and 1.24 ± 0.4 × 10⁻³ mm2/s, respectively). Histologic fibrosis and MVD measurements were similar in primary tumors and metastases. Conclusions: Anatomic and quantitative functional MRI measurements are feasible in orthotropic DSL rat model and will permit non-invasive monitoring of tumor responses during longitudinal studies intended to develop new interventional therapies for primary and metastatic disease.
Keywords: Magnetic resonance imaging, imaging biomarker, pancreatic cancer, immunocompetent Lewis rats
Introduction
Pancreatic cancer is one of the five most frequent causes of cancer-related deaths in the US [1,2]. Surgical resection is the only potential treatment with 5-year survival exceeding 20% [2,3]. Unfortunately, surgical resection is not feasible in the vast majority of patients due to early local and metastatic spread of the disease, limiting the overall 5-year overall survival to roughly 5% [1-4]. Superior therapeutic approaches are desperately needed to improve the prognosis of patients with pancreatic cancer.
Animal models remain critical for studying carcinogenesis in humans and investigating innovative therapeutic approaches. However, the development of models that accurately resemble human pancreatic cancer is difficult. Transgenic mouse models have been valuable for studying the pathogenesis of pancreatic cancer as well as establishing both genomic and proteomic hallmarks. However, these models require extended breeding schedules with associated high costs and often produce a broad range of spontaneously occurring neoplasms within multiple organs, potentially complicating longitudinal studies and their associated results. The promising hamster model reflects many clinical, morphologic, and molecular aspects of human disease [5,6]. However, a lack of molecular and immunologic research tools available for the species limits the practical value of the hamster model [6]. Immuno-deficient rodents (nude mice) are widely used as hosts for human tumors, but these models lack inflammatory and esmoplastic reactions characteristic of human pancreatic cancer and do not reflect immunological modulation of tumor growth and spread. Pancreatic tumors can be chemically induced in rats through azaserine injections, but the resulting acinar carcinomas grow slowly, rarely metastasize, and lack many important hallmarks of human pancreatic cancer [7].
More recently, orthotopic immuno-competent Lewis rat model have been developed using either intra-pancreatic injection of cultured rat pancreatic carcinoma cells (DSL-6A/C1 line) or intra-pancreatic implantation of DSL tumor fragments [8,9]. These intra-pancreatic inoculation procedures are highly reproducible and result in locally invasive and moderate to well-differentiated ductal adenocarcinomas with histological characteristics of human pancreatic tumors [1-4]. This model may be ideal for pre-clinical studies of therapy response. Furthermore, DSL Lewis rat models also possess larger anatomic size compared to alternative mouse models, making them more suitable for development of loco-regional percutaneous ablation or arterial infusion therapies.
Noninvasive monitoring of tumor growth and regression is critical for longitudinal therapeutic response studies. Magnetic resonance imaging (MRI) is a well-established tool for noninvasively providing anatomic, physiologic, and functional information for serial assessment of the tumor microenvironment during both disease progression and treatment response. Previously, several groups have reported the potential to perform computed tomography (CT) in mouse orthotopic pancreatic cancer models [10]. MRI offers several advantages over CT, including superior soft tissue contrast, the potential to perform quantitative measurements of multiple functional biomarkers, and avoidance of exposing patients to ionizing radiation.
The purpose of this study was to demonstrate the feasibility of performing quantitative MRI measurements in the immunocompetent DSL rat model of pancreatic cancer by comparing in vivo anatomic and quantitative imaging measurements to tumor dissemination observations and histologic assays at necropsy.
Materials and methods
Experiments were approved by the institutional animal care and use committee of Northwestern University.
Cell line and culture
The rat ductal pancreatic adenocarcinoma cell line DSL-6A/C1 was purchased from the American Type Culture Collection (Rockville, MD, USA) and cultured in Waymouth’s MB 752/1 medium (Gibco, Grand Island, NY, USA). The cell culture medium was supplemented with 10% heat-inactivated fetal bovine serum (FBS; Gibco), penicillin G (100 U/mL), and streptomycin (100 mg/mL). The cells were incubated in a humidified atmosphere of 5% CO2 at 37°C.
Orthotopic pancreatic cancer in immunocompetent Lewis rats
Five-week-old male Lewis rats weighing 100 to 150 g were purchased (Charles River, Wilmington, MA, USA). Animals were maintained in micro-isolator cages. The Lewis rat orthotopic pancreatic cancer model was prepared as previously described with our modification [8,9]. DSL-6A/C1 cells were centrifuged at 1500 rpm for 5 minutes. The supernatant was discarded, and the cell pellet was re-suspended in methylcellulose media (StemCell Technologies, Vancouver, British Columbia, Canada). Donor Lewis rats were anesthetized with 2% isoflurane and oxygen at 1 L/min inhalation. 108 DSL-6A/C1 cells in 3 mL media were injected subcutaneously into the right flank. After 5 weeks, donor tumors reached at most 15 mm diameter and were excised under aseptic conditions. Tumors were then minced with a scalpel into 1 mm3 fragments, which were placed on ice until the time of implantation (Figure 1).
Figure 1.
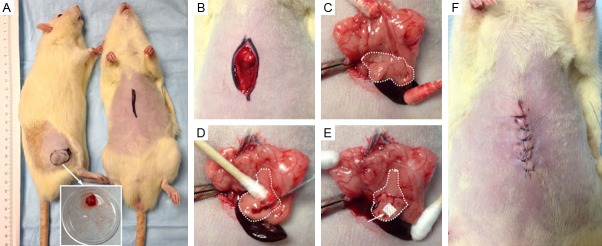
Implantation method for establishment of pancreatic tumors. A: The donor rat with tumor (left) and tumor-recipient rat (right). B, C: Pancreas is identified and exposed extracorporeally. D, E: Incision is made in the pancreatic tissue and a small tumor piece is inserted. The incision is sealed with Surgicel (absorbable hemostat) and tumor implanted pancreas placed into the abdomen. F: Abdominal wall was closed in three layers.
The recipient rat pancreas was exposed following a mini-laparotomy. A small stab wound (1-2 mm) at the head of the pancreatic parenchyma was made. One tumor fragment was deeply inserted into the stab wound. To prevent the fragment from being dislodged, a 0.2 cm2 piece of Surgicel (Ethicon/Johnson & Johnson, Somerville, New Jersey, USA) was placed upon the incision site. The abdomen was then closed in three layers.
In vivo MRI detection of tumors and metastases
At 7 weeks following tumor implantation, MRI studies were performed using a Bruker 7.0T ClinScan high field small animal MRI system (Bruker Biospin, Ettlingen, Germany) with 75 mm rat coil (Bruker BioSpin) and Siemens gradient system and pulse sequences. Temperature was monitored continuously using a thermometer and controlled with a water-bed. Heart rate, respiration rate, and blood pressure were monitored with an MRI-compatible small animal gating system (SA Instruments, Stony Brook, NY). T1-weighted (T1W) and T2-weighted (T2W) images were acquired in both coronal and axial orientations and images covered from liver to kidneys. The parameters for in vivo measurements were as follows. T2W: turbo spin echo (TSE) sequence, repetition time (TR)/echo time (TE) = 1500/44 ms; field of view (FOV) = 70 × 70 mm2; matrix = 256 × 256; slice thickness = 1 mm, number of slices = 70; acquisition was synchronized to the respiratory cycle to minimize motion artifacts. T1W: TSE sequence, TR/TE = 200/2.6 ms; FOV = 70 × 70 mm2; matrix = 256 × 256; slice thickness = 1 mm; number of slices = 70. Following tumor identification MR, quantitative MRI (T2 map and DW-MRI) and functional MRI (DCE-MRI) will be performed as listed below.
Quantitative MRI T2 measurements
T2 maps were acquired in both coronal and axial orientations with parameters as follows: Carr Purcell Meiboom Gill (CPMG) sequence with four echoes per excitation, TR/TEs = 2000/14.1, 28.2, 42.3, 56.4 ms; FOV = 70 × 70 mm2; matrix = 128 × 128; slice thickness = 1 mm. An offline voxel-wise post-processing algorithm was implemented in the Matlab 7.1 (MathWorks, Natick, MA) software package and used to generate T2 maps (based upon mono-exponential fitting of voxel-wise TE-dependent signal decay in CPMG images, respectively).
Quantitative diffusion-weighted MRI (DW-MRI) measurements
DW-MRI was performed in axial orientation. For DW-MRI measurements, Stejskal-Tanner DW spin-echo sequence, FOV = 70 × 70 mm2, matrix = 128 × 128, TR/TE = 500/51.1 ms, ST = 1.0 mm, b-values = 0, 500, and 800 s/mm2 [11,12].
Dynamic contrast-enhanced MRI (DCE-MRI)
A standard 24-gauge intravenous catheter was inserted into the tail vein for injection of gadolinium contrast agent PROHANCE (0.2 mmol/kg Gadoteridol, Gd-HP-DO3A; Schering, Berlin, Germany). DCE datasets were acquired using a GRE sequence with the following parameters: TR/TE = 50/3.1 ms, FOV = 70 × 70 mm2, matrix size = 88 × 128, flip angle 30°, 3 adjacent coronal slices with thickness of 1 mm and a temporal resolution of 4 sec. A total of 400 (scans) images were acquired. The first 60 dynamic scans (measurement of reliable pre-injection baseline signal intensity levels) served as baseline data, and then remaining 340 scans were acquired following PROHANCE injection by intravenous tail vein catheter.
Autopsy measurements of primary tumor size and metastasis
Animals were euthanized by a lethal dose of sodium pentobarbital (100 mg, i.p.) immediately after MRI. All animals underwent an autopsy. The longest diameter of each primary tumor was measured with a caliper. A dissemination score was used to assess tumor local invasion and distant metastasis [8,9]. Spread of primary tumor to healthy tissues immediately surrounding the tumor is defined as local invasion. Distant metastases were defined as lesions isolated from the primary tumor or without anatomic connection to the primary tumor. Clinical consequences of tumor growth were incorporated into this scoring system: formation of ascites, development of jaundice, and cachexia [8,9].
Histology and immunohistochemistry
The primary tumor and all sites of metastases were harvested and fixed in 10% formalin, embedded in paraffin, and sliced (4 µm slice thickness). These slices were placed upon glass slides for hematoxylin and eosin (H&E) staining and Masson’s trichrome staining [13,14]. One trichrome-stained central slice from each primary tumor or liver metastases was scanned at 20 × magnification and digitized using the TissueFAXS system (TissueGnostics, Los Angeles, CA, USA). The digitized images were analyzed using HistoQuest cell analysis software (TissueGnostics) for automated measurement of the fibrotic tissue areas within each slide [13,14]. Necrotic regions were manually excluded from these measurements. Finally, the percentage of fibrotic tissue was expressed as a ratio: A fibrosis/A total × 100 (A total, the total tumor tissue area; A fibrosis, the fibrotic tissue area) [13,14].
Additional slices were used for rat anti-CD34 staining for microvessel density (MVD) measurement. MVD measurements were performed as described in the literature [15]. All blood vessels were highlighted by staining endothelial cells as described previously [16]. Individual microvessels from tumors, liver metastases, and normal liver tissues were counted on a 200 × field (i.e., 20 × objective lens and 10 × ocular lens; 0.7386 mm2 per field) in order to assess MVD. Any brown-staining endothelial cells or endothelial-cell clusters that were clearly separate from adjacent microvessels, tumor cells, and other connective-tissue elements were considered to be single, countable microvessels. Ten fields were counted by the investigator using a double-headed light microscope.
MRI data analysis
Within the MRI dataset collected from each rat (n = 6), primary tumors and metastases (liver) were detected and the longest diameter of each tumor measured from transverse T2W images by consensus of an experienced radiologist (Dr. Zhang) using the image that best depicted the boundaries of the lesion. On the T2 maps, specific regions of interest (circle ROIs, radius = 5 mm) were carefully drawn in primary tumor, liver metastases, and normal liver tissue by a radiologist (Dr. Zhang). Average T2 values for each tissue type were measured from each ROI. All ROIs were carefully delineated to minimize partial-volume effects. T2 values were measured using these T2 maps for primary pancreatic tumors, liver metastases, and normal liver tissues (each n = 6).
Post-processing algorithms were implemented within the Matlab 7.1 (MathWorks, Natick, MA, USA) software package to produce ADC maps (n = 6). These were generated by voxel-wise fitting of the resulting signal intensities within the DW images to the Stejskal-Tanner equation, Sb = S(0)e-bADC, where S(0) is the signal intensity in the absence of diffusion weighting and Sb is the signal intensity for those images acquired with diffusion-weighting [17]. ROIs were drawn around the primary tumors, liver metastases, and normal liver tissues (single ROI drawn for each primary tumor and one liver metastatic lesion for each rats). ADC values for the primary tumors, liver metastases, and normal liver tissues (each n = 6) were recorded as the mean value from voxels within the ROI.
Quantitative analysis of the DCE-MRI data was performed as previously described [18,19]. For semi-quantitative analysis of DCE-MRI datasets, ROIs were drawn for each of three tissue types (primary tumor, normal liver tissue, and skeletal muscle (SM)) (each n = 6). The signal intensity (SI) time course from each ROI was extracted and then converted into a quantitative Gd contrast concentration curve (CGd (t) in mM, conversion based upon the known R1 relaxivity of the Gd contrast probe and the corresponding post-infusion SI changes within the T1W image series) [20]. In order to provide a robust set of quantitative indicators of the vascular characteristics of the tissues, the initial area under the curve (IAUC) for CGd (t) was calculated with integration times of 60 and 120 seconds post-contrast infusion (IAUC60 and IAUC120); two integration times were selected in order to capture both tracer wash-in and wash-out characteristics.
Statistical analysis
Statistical calculations were performed using the Graphpad Prism V6 software package (Graphpad, La Jolla, CA, USA). Data are presented as mean ± standard deviation (SD) as indicated. Statistical significance was defined as p values less than 0.05. T2, ADC, and IAUC for different tissue types were compared with Student’s t-test.
Results
Autopsy and histology
The primary tumor was identified in each rat model. Local invasion and distant metastases were confirmed for all rats (Figure 2). Local invasion was found in the spleen, stomach, liver, retroperitoneum area, and diaphragm (Figure 2A). Distant metastases were found in spleen, liver, diaphragm, retroperitoneum area, abdominal wall, lung, mediastinum, omentum, and mesentery (Figure 2B). Clinical signs are shown in Figure 2C. All tumors and metastases were firm white-yellow masses (Figure 3). The sizes of primary tumors were 43.6 ± 3.6 mm (mean ± SD). Microscopy revealed that tumors formed glands and were characterized by infiltrating small glands lined with low-columnar, mucin-containing cells. Figure 4 showed representative H&E (Figure 4A-C), trichrome (Figure 4D-F), and CD34 (Figure 4G-I) histology slides from primary tumor (Figure 4A, 4D and 4G), liver metastases (Figure 4B, 4E and 4H), and peritoneum metastases (Figure 4C, 4F and 4I) from the same rat model. Nuclei pleomorphism, hyperchromasia, loss of polarity, and prominent nucleoli were observed in these H&E stained slices. Trichrome histology slides clearly depicted the fibrotic stroma seen histologically as blue-stained bands of collagen enveloping the tumor cells in each sample. There were no significant differences between quantitative measurements of fibrotic tissue area (trichrome stain analyses) in primary tumors and liver metastases (or peritoneum metastases); the percentage of fibrotic areas were 3.38 ± 2.14, 3.69 ± 2.32, and 2.97 ± 1.27 for primary tumors, liver metastases, and peritoneal metastases, respectively (Figure 4J, all p > .05). Quantitative MVD measurements (using anti-CD34 stained slices) were 83.7 ± 13.6/cm2, 78.5 ± 17.4/cm2, and 89.5 ± 9.7/cm2 for primary tumors, liver metastases, and peritoneum metastases, respectively (Figure 4K, all p > .05). MVD measurements of normal liver tissue and SM and 37.2 ± 6.1/cm2 and 13.2 ± 4.8, respectively (p < .05). Significant differences in MVD were observed between tumors tissues and both normal liver and SM tissues (p < .05).
Figure 2.
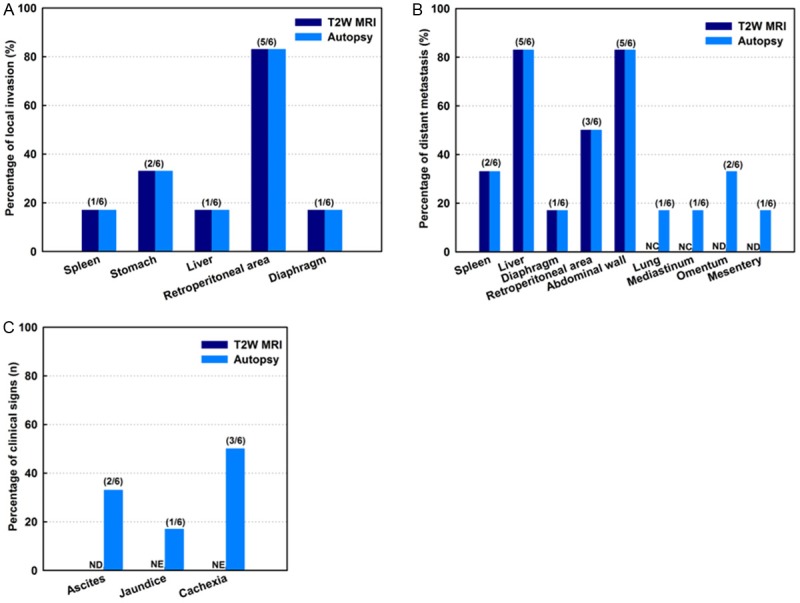
Dissemination score and sign by autopsy. Local invasion was found in spleen, stomach, liver, retroperitoneum area, and diaphragm (A). Distant metastases were found in spleen, liver, diaphragm, retroperitoneum area, abdominal wall, lung, mediastinum, omentum, and mesentery (B). Clinical signs were shown in (C). NC = not covered within imaging volume; ND = not detected; NE = not evaluated.
Figure 3.
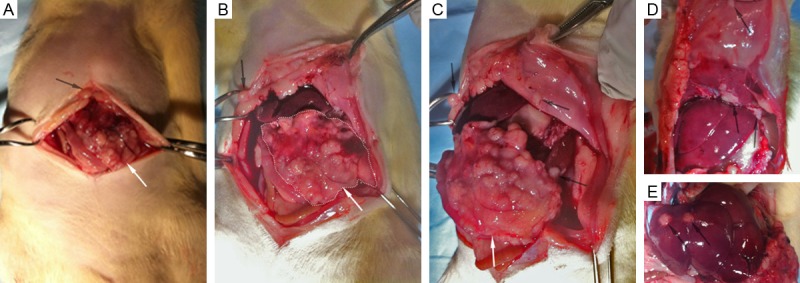
Photographs during autopsy of pancreatic tumor recipient rat. Primary tumor in recipient rat (white arrows in A-C) and local invasion to spleen, stomach, liver, retroperitoneum area, and diaphragm. Distant metastases were found in spleen, liver, diaphragm, retroperitoneum area, and abdominal wall (black arrows in A-E).
Figure 4.
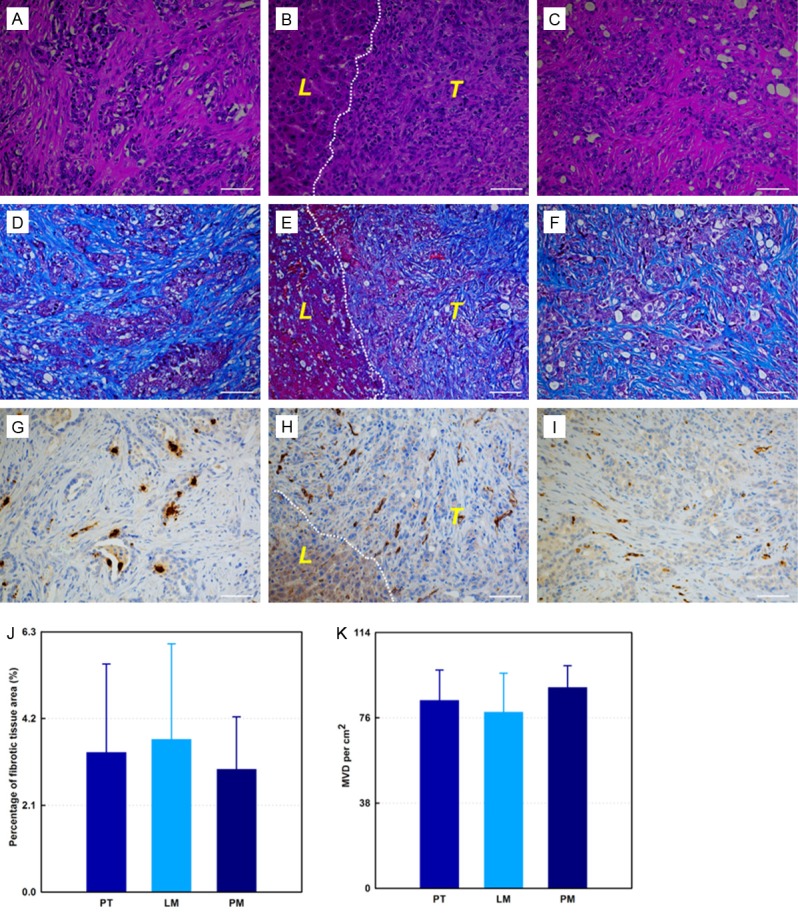
Representative H&E (A-C), trichrome (D-F), and CD34 (G-I) histology slides from same rat model. Primary tumor (A, D and G), liver metastases (B, E and H), and peritoneum metastases (C, F and I). Fibrotic stroma is depicted as blue-stained bands of collagen within trichrome stained slices (D-F). The endothelial cells are depicted as brown-stained cells on CD34 stained slices (G-I). (J) is the percentage fibrosis for primary tumors, liver metastases, and peritoneum metastases, respectively. (K) shows quantitative MVD measurements in primary tumors, liver metastases, and peritoneum metastases, respectively. Dashed lines in (B, E and H) are the boundary between tumor and adjacent liver tissue. T and L (within B, E, and H) = tumor, and normal liver tissue surrounding the tumor, respectively. PT = primary tumor, LM = liver metastases, PM = peritoneal metastases. All scale bars = 50 µm.
In vivo MRI identification of tumors and metastases
Representative T1W and T2W images from one rat model are shown in Figure 5 (A-D and E-H are T1W and T2W images, respectively). All six primary pancreatic tumors (one in each rat) were identified on T2W images, and tumor sizes were measured using T2W axial images. The average diameter of primary tumors was 48.7 ± 5.3 mm, with no significant difference between in vivo MRI measurements and ex vivo caliper measurements (p > .05). Local invasion was observed in spleen, stomach, liver, retroperitoneum area, and diaphragm consistent with necropsy findings (Figure 2A). Distant metastases were detected in the spleen, liver, diaphragm, retroperitoneum area, and abdominal wall. Lung lesions and meditational lesions were not detected as these were not included in the MR imaging volome (MRI examination FOV covered from liver to kidney). Lesions in mesentery (one) and omentum (two) were not detected using MRI but were detected by autopsy.
Figure 5.
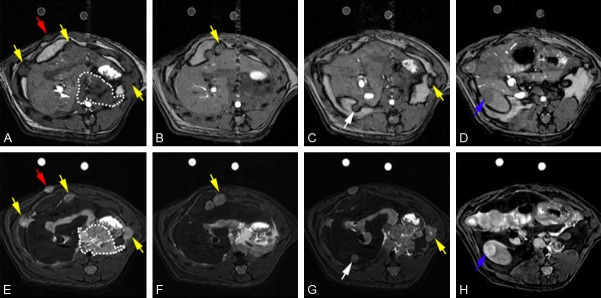
Representative axial T1W and T2W images from one rat model. A-D are T1W images, and E-H are T2W images. Red arrow points to abdominal wall metastasis, white arrow points to liver metastasis, and blue arrow points to kidney metastasis. Yellow arrows point sites of local invasion.
Quantitative T2 measurements
T2 values (msec) are 85.57 ± 12.64, 78.61 ± 9.83, and 37.74 ± 8.13 for primary tumors, liver metastases, and normal liver tissues. T2 values were significantly different between primary tumors/liver metastases and normal liver tissues (all p < .05); no significant differences were found between primary tumors and liver metastases (p > .05).
ADC measurement
Representative DWI images of primary tumor and metastases from the same animal are shown in Figure 6A-C (b values are 0, 500, and 800 for A-C, respectively). ADC values of primary tumors, liver metastases, and normal liver tissues were (1.13 ± 0.3) × 10-3 mm2/s, (1.24 ± 0.4) × 10-3 mm2/s, and (1.49 ± 0.27) × 10-3 mm2/s, respectively (Figure 6D). There were no significant differences between ADC values measured in primary tumors and in liver metastases (p > .05), but significant differences were found between primary tumors/liver metastases and normal liver tissues (all p < .05).
Figure 6.
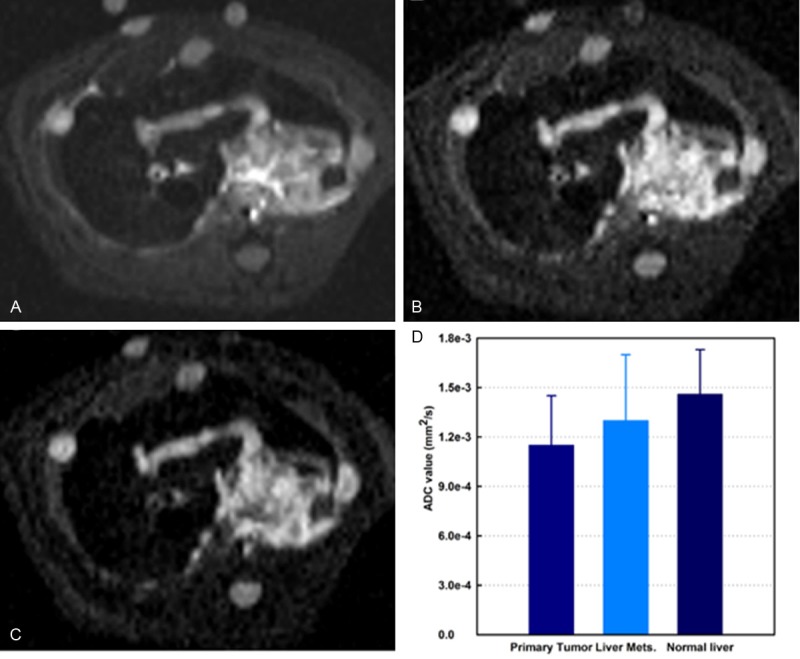
Representative axial DW-MRI images from rat DSL model. Stejskal-Tanner DW spin-echo sequence; b-values = 0, 500, and 800 s/mm2 for A-C; respectively. Quantitative ADC measurements are shown in D. There was significant differences found between both primary tumors and liver metastases and normal liver tissues (all p < .05). Mets = metastases.
Quantitative DCE MRI measurements
Quantitative DCE measurements were successfully performed in all rats. Representative contrast agent (Gd tracer) concentration versus time curves for three tissues of interest (primary tumor, normal liver, and SM) are shown in Figure 7A. The calculated IAUC values for the recorded animals and each tissue type are listed in Table 1. DCE IAUC measurements were significantly higher in primary tumor tissues compared to both normal liver and muscle tissues. These measurements were concordant with corresponding immune-stained MVD counts that were significantly larger in tumor tissues compared to in both normal liver and SM tissues (Figure 7B, 7C).
Figure 7.
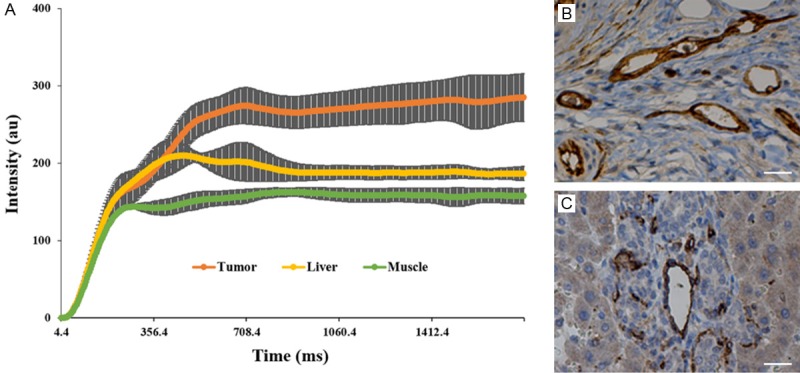
Representative in vivo contrast agent tracer concentration versus time curves for three tissues of interest (primary tumor, normal liver tissue, and skeletal muscle, SM) (A). Primary tumors demonstrated significantly greater contrast uptake compared to normal liver tissue and SM. (B, C) are representative CD34 slices of the primary tumor and the normal liver tissue. SM = skeletal muscle. Scale bar in (B, C) = 50 µm.
Table 1.
Calculated first 60-second initial area under the curve values
| Parameter | SM | L | PT | SM-L | SM-PT | L-PT |
|---|---|---|---|---|---|---|
| IAUC60 (mM sec) | 0.52 ± 0.1 | 1.5 ± 0.2 | 3.6 ± 0.6 | p < .001 | p < .001 | p = .003 |
| IAUC120 (mM sec) | 1.83 ± 0.1 | 5.1 ± 0.3 | 9.4 ± 0.8 | p < .001 | p < .001 | p = .001 |
| MVD (/cm2) | 13.2 ± 4.8 | 37.2 ± 6.1 | 83.7 ± 13.6 | p = .004 | p < .001 | p = .001 |
Note: SM = skeletal muscle; L = normal liver; PT = primary tumor; SM-L = SM compared with L; SM-PT = SM compared with PT; L-PT = L compared with PT; IAUC60 = first 60-second initial area under the curve; sec = second; IAUC120 = first 120-second initial area under the curve; MVD = microvessel density.
Discussion
The highly reproducible immuno-competent DSL rat model should be ideal for pre-clinical studies of therapy response and the development and validation of new loco-regional therapies. Our current studies demonstrate the potential to perform quantitative MRI measurement in the DSL rat model. Both primary and metastatic tumors were well depicted during these in vivo MRI measurements; quantitative ADC measurements reflected restricted diffusion characteristics within both the primary tumors and metastases and DCE measurements within these tumors were elevated relative to muscle and normal liver tissues. During future studies, these therapeutically relevant functional biomarkers should be highly effective for monitoring therapy responses in the DSL rat model.
During these studies, we made several modification to methods employed during prior DSL rat studies. 108 DSL-6A/C1 cells in methylcellulose media were injected subcutaneously into the flank of the donor rats rather than 107 cells in PBS as described in prior reports [8,9]. A semi-solid methylcellulose media was used to avoid reflux of the injected cells from the implantation site. Resulting donor tumor masses grew to 15 mm in diameter within 5-weeks, must faster than the 8-week period required during prior studies [8,9]. For current study, one fragment of 1 mm3 tumor tissue was implanted in the head of pancreatic parenchyma instead of multiple (3-5) 1 mm3 fragments as described in previous reports [8,9]. This modification was intended to produce a single primary tumor at the pancreatic head mimicking common trait of human clinical disease while continuing to exhibit local invation as istant metastases.
Quantitative T2, ADC, and DCE MRI measurements demonstrated significant differences between primary tumors, metastases, and normal liver tissues. DCE IAUC measurements were significantly higher in primary tumor tissue (or liver metastases) than in normal liver tissue, with tracer uptake curves consistently demonstrating increased tracer uptake in the primary tumors/liver metastases compared to uptake in normal liver tissues. Prior studies have demonstrated that T2 measurements can also be a sensitive marker of immunological inflammatory activity, tissue edema, and tumor response to cytotoxic anti-cancer therapies [21]. The results of the current study with liver metastases, where T2 values are consistently increased compared to adjacent normal liver tissues, were highly consistent with prior clinical PDAC studies [22]. ADC measurements should offer a particularly valuable biomarker of treatment response, as these have previously demonstrated sensivity to functional changes at much early time points than anatomic and/or contrast enhanced measurements. These studies were performed using a preclinical 7T MRI system (Bruker Clinscan), running on a clinical scanner interface/development platform (Siemens Syngo). In the future, functional imaging methods developed/validated in these models should be readily transferrable to patient settings using clinical scanner utilizing same interface and platform.
The current study had several limitations. First, our current study focused primarily upon morphological characteristics of the model; further investigations should include comparisons of our functional MRI measurements to pancreatic cancer molecular genetics. Second, this developmental study involved imaging each animal at only one single time-point, and DCE measurements were evaluated only semi-quantitatively with simple integration of the tracer uptake curves rather than using fully quantitative tracer modeling approaches. While the latter quantitative schemes should be feasible with the currently derived datasets, simple semi-quantitative approaches were chosen to avoid the complexity and post-processing times required for rigorous compartmental modeling methods. Finally, the current study only focused on quantitative imaging of primary tumors and liver metastases; further studies are necessary to fully investigate the potential to perform MRI measurements at all sites of metastatic disease.
In conclusion, the clinical DSL rat model provides an ideal platform for the assessment of new therapeutic strategies. Quantitative MRI measurements should serve as effective biomarkers for the detection of therapy response in this pancreatic cancer model providing both non-invasive serial markers of progression/regression and surrogate functional endpoints.
Acknowledgements
MRI was performed at the Northwestern University Center for Translational Imaging. The pathlogical study was performed by the Northwestern University Mouse Histology and Phenotyping Laboratory and microscopy work was performed at the Northwestern University Cell Imaging Facility. This study was generously supported by NIH NCI R01CA196967. Linfeng Zheng is grateful for the State Scholarship Fund from the China Scholarship Council and the Award for “The Best Youth Medical Scholars” from Shanghai First People’s Hospital, Shanghai Jiao Tong University.
Disclosure of conflict of interest
None.
References
- 1.Vincent A, Herman J, Schulick R, Hruban RH, Goggins M. Pancreatic cancer. Lancet. 2011;378:607–620. doi: 10.1016/S0140-6736(10)62307-0. [DOI] [PMC free article] [PubMed] [Google Scholar]
- 2.Hartwig W, Werner J, Jäger D, Debus J, Büchler MW. Improvement of surgical results for pancreatic cancer. Lancet Oncol. 2013;14:e476–e485. doi: 10.1016/S1470-2045(13)70172-4. [DOI] [PubMed] [Google Scholar]
- 3.Ryan DP, Hong TS, Bardeesy N. Pancreatic adenocarcinoma. N Engl J Med. 2014;371:1039–1049. doi: 10.1056/NEJMra1404198. [DOI] [PubMed] [Google Scholar]
- 4.Tol JAMG, Gouma DJ, Bassi C, Dervenis C, Montorsi M, Adham M, Andrén-Sandberg A, Asbun HJ, Bockhorn M, Büchler MW, Conlon KC, Fernández-Cruz L, Fingerhut A, Friess H, Hartwig W, Izbicki JR, Lillemoe KD, Milicevic MN, Neoptolemos JP, Shrikhande SV, Vollmer CM, Yeo CJ, Charnley RM. Definition of a standard lymphadenectomy in surgery for pancreatic ductal adenocarcinoma: A consensus statement by the International Study Group on Pancreatic Surgery (ISGPS) Surgery. 2014;156:591–600. doi: 10.1007/978-1-4939-1726-6_59. [DOI] [PMC free article] [PubMed] [Google Scholar]
- 5.Kitahashi T, Takahashi M, Imai T. Biphasic Alterations in Expression and Subcellular Localization of MUC1 in pancreatic ductal carcinogenesis in Syrian hamsters. Pancreas. 2015;44:76–86. doi: 10.1097/MPA.0000000000000178. [DOI] [PubMed] [Google Scholar]
- 6.Murtaugh LC. Pathogenesis of pancreatic cancer: Lessons from animal models. Toxicol Pathol. 2014;42:217–228. doi: 10.1177/0192623313508250. [DOI] [PMC free article] [PubMed] [Google Scholar]
- 7.Bax J, Schippers-Gillissen C, Woutersen RA, Scherer E. Kinetics of induction and growth of potative precancerous acinar cell foci in azaserine-induced rat pancreas carcinogenesis. Carcinogenesis. 1990;11:245–250. doi: 10.1093/carcin/11.2.245. [DOI] [PubMed] [Google Scholar]
- 8.Hotz HG, Reber HA, Hotz B, Foitzik T, Buhr HJ, Cortina G, Hines OJ. An improved clinical model of orthotopic pancreatic cancer in immunocompetent Lewis rats. Pancreas. 2001;22:113–121. doi: 10.1097/00006676-200103000-00002. [DOI] [PubMed] [Google Scholar]
- 9.Hotz B, Buhr H, Hotz H. Intravital microscopic characterization of suramin effects in an orthotopic immunocompetent rat model of pancreatic cancer. J Gastrointest Surg. 2008;12:900–906. doi: 10.1007/s11605-008-0507-x. [DOI] [PubMed] [Google Scholar]
- 10.Ghansah T, Vohra N, Kinney K, Weber A, Kodumudi K, Springett G, Sarnaik AA, Pilon-Thomas S. Dendritic cell immunotherapy combined with gemcitabine chemotherapy enhances survival in a murine model of pancreatic carcinoma. Cancer Immunol Immunother. 2013;62:1083–1091. doi: 10.1007/s00262-013-1407-9. [DOI] [PMC free article] [PubMed] [Google Scholar]
- 11.Jin N, Deng J, Zhang L, Zhang Z, Lu G, Omary RA, Larson AC. Targeted single-shot methods for diffusion-weighted imaging in the kidneys. J Magn Reson Imaging. 2011;33:1517–1525. doi: 10.1002/jmri.22556. [DOI] [PMC free article] [PubMed] [Google Scholar]
- 12.Deng J, Jin N, Yin X, Yang GY, Zhang Z, Omary RA, Larson AC. Quantitative multiparametric PROPELLER MRI of diethylnitrosamine-induced hepatocarcinogenesis in wister rat model. J Magn Reson Imaging. 2010;31:1242–1251. doi: 10.1002/jmri.22138. [DOI] [PMC free article] [PubMed] [Google Scholar]
- 13.Li W, Zhang Z, Nicolai J, Yang GY, Omary RA, Larson AC. Quantitative magnetization transfer MRI of desmoplasia in pancreatic ductal adenocarcinoma xenografts. NMR Biomed. 2013;26:1688–1695. doi: 10.1002/nbm.3004. [DOI] [PMC free article] [PubMed] [Google Scholar]
- 14.Li W, Zhang Z, Nicolai J, Yang GY, Omary RA, Larson AC. Magnetization transfer MRI in pancreatic cancer xenograft models. Magn Reson Med. 2012;68:1291–1297. doi: 10.1002/mrm.24127. [DOI] [PMC free article] [PubMed] [Google Scholar]
- 15.Weidner N, Semple JP, Welch WR, Folkman J. Tumor angiogenesis and metastasis--correlation in invasive breast carcinoma. N Engl J Med. 1991;324:1–8. doi: 10.1056/NEJM199101033240101. [DOI] [PubMed] [Google Scholar]
- 16.Pinkus GS, Etheridge CL, O’Connor EM. Are keratin proteins a better tumor marker than epithelial membrane antigen? A comparative immunohistochemical study of various paraffin-embedded neoplasms using monoclonal and polyclonal antibodies. Am J Clin Pathol. 1986;85:269–277. doi: 10.1093/ajcp/85.3.269. [DOI] [PubMed] [Google Scholar]
- 17.Wang Z, Vemuri BC, Chen Y, Mareci T. A constrained variational principle for direct estimation and smoothing of the diffusion tensor field from DWI. Inf Process Med Imaging. 2003;18:660–671. doi: 10.1007/978-3-540-45087-0_55. [DOI] [PubMed] [Google Scholar]
- 18.Barnes SL, Whisenant JG, Loveless ME, Yankeelov TE. Practical dynamic contrast enhanced MRI in small animal models of cancer: data acquisition, data analysis, and interpretation. Pharmaceutics. 2012;4:442–478. doi: 10.3390/pharmaceutics4030442. [DOI] [PMC free article] [PubMed] [Google Scholar]
- 19.Yankeelov TE, Luci JJ, Lepage M, Li R, Debusk L, Lin PC, Price RR, Gore JC. Quantitative pharmacokinetic analysis of DCE-MRI data without an arterial input function: a reference region model. Magn Reson Imaging. 2005;23:519–529. doi: 10.1016/j.mri.2005.02.013. [DOI] [PubMed] [Google Scholar]
- 20.Kubassova OA, Boyle RD, Radjenovic A. Quantitative analysis of dynamic contrast-enhanced MRI datasets of the metacarpophalangeal joints. Acad Radiol. 2007;14:1189–1200. doi: 10.1016/j.acra.2007.06.027. [DOI] [PubMed] [Google Scholar]
- 21.Sun Y, Mulkern RV, Schmidt K, Doshi S, Albert MS, Schmidt NO, Ziu M, Black P, Carrol R, Kieran MW. Quantification of water diffusion and relaxation times of human U87 tumors in a mouse model. NMR Biomed. 2004;17:399–404. doi: 10.1002/nbm.894. [DOI] [PubMed] [Google Scholar]
- 22.Muller-Schimpfle M, Brix G, Layer G, Schlag P, Engenhart R, Frohmuller S, Hess T, Zuna I, Semmler W, van Kaick G. Recurrent rectal cancer: diagnosis with dynamic MR imaging. Radiology. 1993;189:881–889. doi: 10.1148/radiology.189.3.8234720. [DOI] [PubMed] [Google Scholar]


