

Abstract
Key points
Muscle contraction is triggered by Ca2+ ions released from the sarcoplasmic reticulum (SR) in response to depolarization of skeletal muscle fibres. Muscle activation is also known to be associated with a voltage‐activated trans‐sarcolemmal Ca2+ influx.
Because removal of external Ca2+ does not impede fibres from contracting, a negligible role has been initially attributed to this Ca2+ entry. Furthermore, it is not clearly established whether Ca2+ exclusively flows through L‐type channels.
By monitoring the quenching of fura‐2 fluorescence resulting from Mn2+ influx in voltage‐controlled mouse and zebrafish muscle fibres, we show that the L‐type current is the only contributor to Ca2+ influx during long‐lasting depolarizations.
Calibration of the Mn2+ quenching signal allowed us to estimate an Mn2+ current of 0.31 A F–1 flowing during a train of action potentials.
Measurements of SR Ca2+ changes with fluo‐5N in response to depolarization indicated that voltage‐activated Ca2+/Mn2+ influx contributes to SR Ca2+/Mn2+ loading.
Abstract
Muscle contraction is triggered by Ca2+ ions released from the sarcoplasmic reticulum (SR) in response to depolarization of skeletal muscle fibres. Muscle activation is also associated with a voltage‐activated trans‐sarcolemmal Ca2+ influx early identified as a current flowing through L‐type Ca2+ channels. Because removal of external Ca2+ does not impede fibres from contracting, a negligible role was given to this voltage‐activated Ca2+ entry, although the decline of Ca2+ release is more pronounced in the absence of Ca2+ during long‐lasting activation. Furthermore, it is not clearly established whether Ca2+ exclusively flows through L‐type channels or in addition through a parallel voltage‐activated pathway distinct from L‐type channels. Here, by monitoring the quenching of fura‐2 fluorescence resulting from Mn2+ influx in voltage‐controlled mouse and zebrafish isolated muscle fibres, we show that the L‐type current is the only contributor to Ca2+ influx during long‐lasting depolarizations in skeletal muscle. Calibration of the Mn2+ quenching signal allowed us to estimate a mean Mn2+ current of 0.31 ± 0.06 A F–1 flowing through L‐type channels during a train of action potentials. Measurements of SR Ca2+ changes with fluo‐5N in response to depolarization revealed that an elevated voltage‐activated Ca2+ current potentiated SR Ca2+ loading and addition of external Mn2+ produced quenching of fluo‐5N in the SR, indicating that voltage‐activated Ca2+/Mn2+ influx contributes to SR Ca2+/Mn2+ loading.
Introduction
Muscle contraction is triggered by Ca2+ ions released from the sarcoplasmic reticulum (SR) in response to depolarization of skeletal muscle fibres. Muscle activation is known to be also associated with a trans‐sarcolemmal Ca2+ influx, the role and pathway of which are not clearly established. The first and best characterized Ca2+ influx occurring in response to depolarization is the voltage‐gated L‐type Ca2+ current flowing through the dihydropyridine receptors (DHPRs) which also fulfil the function of voltage sensors of excitation–contraction coupling (Rios & Pizarro, 1991; Melzer et al. 1994; Schneider, 1994). This current displays a high voltage threshold of activation and slow kinetics of activation and inactivation (Collet et al. 2003). Another Ca2+ entry induced by depolarization and independent of L‐type Ca2+ current has been described initially in cultured myotubes (Cherednichenko et al. 2004). Different groups have explored this Ca2+ entry, called ECCE for excitation‐coupled Ca2+ entry, but reached different conclusions, some claiming that DHPR is the major and perhaps sole component of ECCE and others arguing that ECCE engages a specific pathway different from L‐type Ca2+ channels (Bannister et al. 2009; Berbey & Allard, 2009; Dirksen, 2009). Finally, depletion of Ca2+ in the SR, which may be produced by depolarization‐evoked Ca2+ release, leads to the opening of sarcolemmal Ca2+ channels. The resulting Ca2+ influx should, however, mainly occur upon repolarization if depletion persists and not during excitation as depolarization was shown to inhibit Ca2+ entry probably by reducing the electrochemical Ca2+ gradient (Kurebayashi and Ogawa, 2001). The pathway involved in this store‐operated Ca2+ entry (SOCE) remains of intense debate (Dirksen, 2009; Cully & Launikonis, 2013).
Removal of external Ca2+ does not impede fibres from contracting (Armstrong et al. 1972) but contraction and Ca2+ release are known to drastically decline during long‐lasting activation and this decline is faster and more pronounced in the absence of external Ca2+ (Lüttgau & Spiecker, 1979; Brum et al. 1988; Dulhunty & Gage, 1988). It is tempting to propose that Ca2+ entering the fibre during excitation helps to compensate for SR Ca2+ depletion, as it was shown that depletion is the main process that contributes to the decline in Ca2+ release during long‐lasting muscle activation (Robin & Allard, 2013). However, removal of external Ca2+ has been shown to shift inactivation of Ca2+ release towards negative voltages, to inhibit a Ca2+ priming site that controls Ca2+ release and to promote a leaky state of SR Ca2+ release channels, which all contribute to a decline in Ca2+ release (Brum et al. 1988; Pizarro et al. 1989; Robin & Allard, 2012). Additionally, the L‐type Ca2+ channel blocker nifedipine was shown to negligibly affect muscle contraction but the drug was also found to induce an increase in resting SR Ca2+ leak (Posterino & Lamb, 1998; Robin & Allard, 2012). The use of Ca2+‐free solutions and nifedipine to explore the role of voltage‐gated Ca2+ entry is thus inconclusive. Interestingly, a recent study has shown that potentiation of the L‐type Ca2+ current is associated with an increase in muscle strength in JP45/CASQ1 double knockout mice (Mosca et al. 2013), suggesting that the voltage‐gated Ca2+ influx contributes to maintain an adequate level of releasable SR Ca2+ content during sustained muscle activity. However, it could not be excluded that ablation of JP45 and CASQ1 proteins induced an increase in muscle performance independently from the change in Ca2+ channel activity and it was also not demonstrated that Ca2+ ions entering through L‐type Ca2+ channels had access to the SR lumen.
Measuring the quenching of fluorescence of Ca2+ indicators by Mn2+ is a high‐resolution technique that has been extensively used to explore resting Ca2+ influx, SOCE and ECCE (Kurebayashi & Ogawa, 2001; Cherednichenko et al. 2004; Berbey & Allard, 2009). However, Mn2+ entry monitored by the quenching technique during excitation and under voltage control has not been investigated, so the kinetic and voltage dependence of the voltage‐gated Mn2+ entry have not been determined, hampering our understanding of the functional role of Ca2+ entry. In this study, we investigated the pathway and the role of Ca2+ entry during activity on freshly isolated adult mouse skeletal muscle fibres by combining for the first time voltage clamp and the Mn2+ quenching technique. We show that, despite an apparent complete block of the L‐type current by Cd2+, an Mn2+ influx displaying similar properties to L‐type currents still develops in response to depolarization, suggesting that DHPR is the unique contributor to influx of voltage‐activated divalent ions. Calibration of the Mn2+ quenching signal also allowed us to calculate the magnitude of the transmembrane Ca2+ current that develops during a train of action potentials. Overall, by measuring SR Ca2+ changes, we demonstrate that Ca2+ ions entering the cell in response to depolarization have access to the SR lumen and probably help to maintain SR Ca2+ release during long‐lasting activation of muscle fibres.
Methods
Preparation of mouse and zebrafish muscle fibres
All experiments were performed in accordance with the guidelines of the French Ministry of Agriculture (87/848) and of the European Community (86/609/EEC). Adult male OF1 mice were killed by cervical dislocation before removal of flexor digitorum brevis muscles. Single fibres were isolated by 50 min of enzymatic treatment at 37°C using a Tyrode solution containing 2 mg ml–1 collagenase type I (Sigma). Ten 5‐ to 6‐day‐old zebrafish larvae were anaesthetized with 0.017% tricaine, decapitated and incubated at 37°C in a Tyrode solution containing 2 mg ml–1 collagenase type I. Whole fishes were triturated to isolate fibres.
Electrophysiology
Single fibres were voltage clamped using the silicone clamp technique as previously described (Robin et al. 2012). The major part of a single fibre was electrically insulated with silicone grease and a micropipette was inserted into the fibre through the silicone layer to current clamp or voltage clamp the portion of the fibre free of grease (50–100 μm length) using a patch‐clamp amplifier (Bio‐Logic RK‐400, Claix, France) in whole‐cell configuration. Command voltage or current pulse generation and data acquisition were done using the pClamp10 software (Axon Instruments, Union City, CA, USA) driving an A/D converter (Digidata 1400A, Axon Instruments). Analog compensation was systematically used to decrease the effective series resistance. Currents or membrane potentials were acquired at a sampling frequency of 10 kHz. Cell capacitance was determined by integration of a current trace obtained with a 10 mV hyperpolarizing pulse from the holding potential and was used to calculate the density of Mn2+ currents (A F–1). Leak currents were subtracted from all recordings using the same pulse preceding every test pulse supposing a linear evolution of leak current with depolarization. The voltage dependence of the mean Mn2+ current density was fitted using the following equation: I(V) = G max (V – V rev)/{1 + exp [(V ½ – V)/k]}, where I(V) is the mean density of the current measured, V the test pulse, G max the maximum conductance, V rev the apparent reversal potential, V ½ the half‐activation voltage and k a steepness factor.
Single zebrafish muscle fibres were voltage clamped using the whole cell configuration of the patch clamp technique. The experimental procedures were the same as those used for mouse muscle fibres experiments except that leak currents were not subtracted.
Mn2+ quenching experiments
Mn2+ influx was monitored by measuring the extinction of fura‐2 fluorescence produced by Mn2+ binding to the indicator. Fura‐2 fluorescence was measured at 520 nm. Images were captured with a charge‐coupled device camera at a frequency indicated in the figure legends. Fluorescence values were expressed as percentage of the initial fluorescence recorded at the beginning of the experiment and corrected for background fluorescence measured next to each fibre. For mouse muscle fibres, prior to experiments, cells were dialysed over 20 min with an internal pipette solution containing 100 μm fura‐2 and 15 mm EGTA (voltage clamp) or 200 μm fura‐2 and 5 mm EGTA (current clamp). At the beginning of each experiment, the isosbestic point was searched by applying 1 s voltage steps to +20 mV and changing the excitation wavelength around 360 nm in 1 nm steps in the presence of an external solution containing Ca2+ until no change in fura‐2 fluorescence was observed. Once the isosbestic point was found, 2.5 mM Ca2+ was replaced by 10 mM Mn2+ in the external solution. The derivative of the fluorescence signal was determined by averaging the slopes of two adjacent fluorescence data points. The voltage dependence of the percentage of quenching or of the quenching rate was fitted using the same equation as that used for the Mn2+ current. In one series of experiments, fura‐2 fluorescence was detected at 485 nm by one photomultiplier upon excitation at 360 nm, recorded at a sampling rate of 10 kHz and further filtered at 150 Hz (Fig. 1 B).
Figure 1. Voltage dependence of Mn2+ influx .
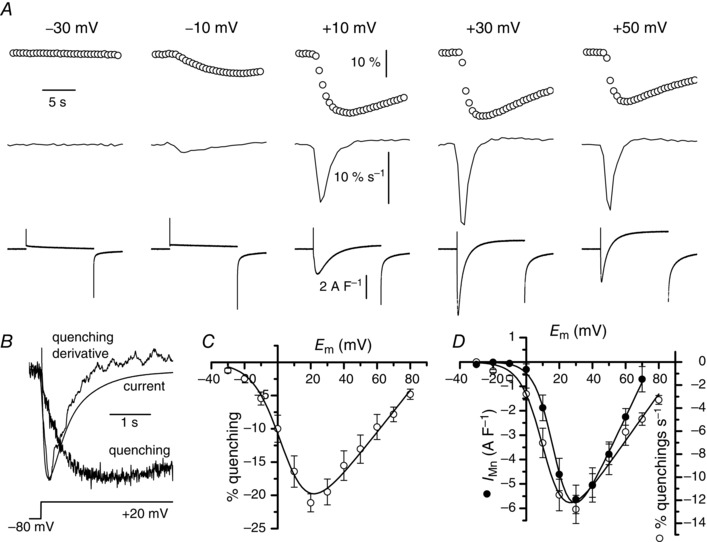
A, simultaneous recordings of changes in fura‐2 fluorescence (upper traces) and membrane currents (lower traces) in the same fibre in response to depolarizing pulses of 10 s duration to the voltages indicated above the fluorescence traces. Middle traces correspond to derivatives of the fluorescence traces. Fluorescence images were captured at 2 Hz. B, superimposition of the traces of the current, the fura‐2 fluorescence change and its derivative on a fast time scale in response to the indicated voltage protocol. C, relationship between the mean changes in fura‐2 fluorescence and membrane potential (n = 8). D, relationships between the mean peak values of rate of changes in fura‐2 fluorescence (open symbols), corresponding to the derivative of the fluorescence signal, and membrane potential and between the mean Mn2+ current (closed symbols) and membrane potential (n = 7).
For zebrafish muscle experiments, cells were dialysed through the patch pipette for 5 min with an internal solution containing 100 μm fura‐2, 2 mm EGTA and 0.8 mm CaCl2. This Ca2+‐buffered solution was required to ensure Ca2+ repletion of the SR.
Measurements of Ca2+ changes in SR lumen using fluo‐5 N
SR Ca2+ changes were measured as previously described (Robin et al. 2012). In brief, fibres were incubated in a Tyrode solution containing 10 μm fluo‐5N‐AM at room temperature for 2 h to allow entry of the dye into the SR and subsequent deesterification. Cells were then dialysed for 20 min through the micropipette used for voltage clamping with an internal solution containing 50 mm EGTA to prevent possible contraction during imaging and avoid contribution of cytosolic Ca2+ changes to SR Ca2+ signals. Fluo‐5N was excited at 488 nm and the emitted fluorescence was measured at 520 nm after background subtraction. Changes in SR Ca2+ content were expressed as F/F 0, where F 0 is the measured fluorescence before applying voltage pulses or train of action potentials, corrected for background fluorescence measured next to each fibre. The frequency of image capture is indicated in the figure legends.
Solutions
For quenching experiments under voltage clamp conditions in mouse and zebrafish muscle fibres, the external solution contained (in mm) 140 TEA‐MeSO3, 1 MgCl2, 10 MnCl2, 0 Ca, 0.002 TTX, 1 4‐aminopyridine and 10 HEPES adjusted to pH 7.2 with TEA‐OH. The intrapipette solution for mouse muscle experiments contained (in mm) 120 potassium glutamate, 15 EGTA, 5 Na2‐ATP, 5 Na2‐phosphocreatine, 5.5 MgCl2, 5 glucose and 5 HEPES adjusted to pH 7.2 with KOH. The intrapipette solution for zebrafish muscle experiments contained (in mm) 120 caesium aspartate, 15 EGTA, 5 HEPES, 3 Mg‐ATP, 5 Na2‐phosphocreatine and 2.5 MgCl2 at pH 7.2. For quenching experiments under current clamp conditions, the external solution contained (in mm) 140 NaCl, 5 KCl, 10 MnCl2, 1 MgCl2 and 10 HEPES adjusted to pH 7.2 with NaOH. The intrapipette solution contained (in mm) 120 potassium glutamate, 5 EGTA, 5 Na2‐ATP, 5 Na2‐phosphocreatine, 5.5 MgCl2, 5 glucose and 5 HEPES adjusted to pH 7.2 with KOH. For fluo‐5N experiments under voltage clamp conditions, the external solution contained (in mm) 140 TEA‐MeSO3, 10 MnCl2 (or 10 mm MgCl2), 1 MgCl2, 2.5 Ca, 0.002 TTX, 1 4‐aminopyridine and 10 HEPES adjusted to pH 7.2 with TEA‐OH. The intrapipette solution contained (in mm) 50 EGTA‐KOH, 50 potassium glutamate, 5 Na2‐ATP, 5 Na2‐phosphocreatine, 5.5 MgCl2, 5 glucose and 5 HEPES adjusted to pH 7.2 with KOH. Stock solutions of fura‐2, fluo‐5N AM and BayK 8644 were dissolved in water at 10 mm, and in DMSO at 1 mm and 10 mm, respectively. Experiments were carried out at room temperature.
Statistics
Fits were performed with Microcal Origin (Microcal Software, Northampton, MA, USA). Data are given as means ± SEM and compared using two‐tailed Student's t tests, with Bonferroni correction for data compared in Fig. 10. Differences were considered significant at P < 0.05. Asterisks indicate significant differences at *P < 0.05, **P < 0.005 and ***P < 0.0005.
Figure 10. Effect of an increase in external [Ca2+] and of replacement of Mg2+ by Mn2+ on voltage‐induced SR Ca2+ signals .
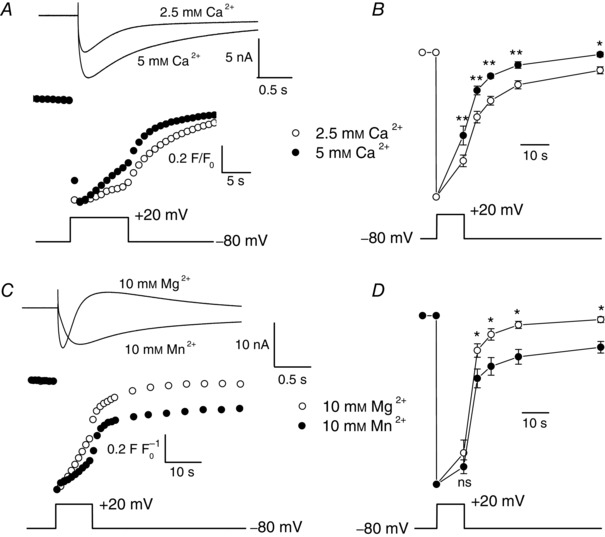
A, simultaneous recordings of membrane currents (upper traces) and fluo‐5N fluorescence changes (middle traces) in response to a 10 s voltage pulse (lower trace) in the presence of 2.5 and 5 mm external Ca2+. Note the different time scales used for the current and the fluorescence traces. Fluorescence images were captured at 1 Hz. Before normalization, the absolute mean values of F/F 0 were 0.99 and 0.98 at basal level and 0.17 and 0.18 at peak in control and in the presence of 5 mm Ca2+, respectively. B, mean values of fluo‐5N fluorescence (upper traces) in response to a voltage pulse (lower trace), at the end of the depolarization and 5, 10, 20 and 50 s after the end of the depolarization in the presence of 2.5 and 5 mm external Ca2+ (n = 7). C, simultaneous recordings of membrane currents (upper traces) and fluo‐5N fluorescence changes (middle traces) in response to a 10 s voltage pulse (lower trace) in the presence of 10 mm Mg2+ and 10 mm Mn2+. Note the different time scales used for the current and the fluorescence traces. Fluorescence images were captured at 1 Hz and then at 0.2 Hz. Before normalization, the absolute mean values of F/F 0 were 1.00 and 0.95 at basal level and 0.28 and 0.30 at peak in control and in the presence of 10 mm Mn2+, respectively. D, mean values of fluo‐5N fluorescence (upper traces) in response to a voltage pulse (lower trace), at the end of the depolarization and 5, 10, 20 and 50 s after the end of the depolarization in the presence of 10 mm Mg2+ and 10 mm Mn2+ (n = 5) (ns, not significant).
Results
Figure 1 A presents the quenching of fura‐2 fluorescence resulting from Mn2+ influx in response to voltage pulses of increasing amplitude. A 2 min interval at −80 mV between pulses was sufficient to allow complete recovery of fluorescence, probably because Mn2+ ions redistributed from fura‐2 to EGTA. As previously described (Berbey & Allard, 2009), voltage pulses above −10 mV also induced L‐type currents carried by Mn2+. Fitting a Boltzmann equation in each cell indicated mean values of 143 ± 18 S F–1, +78 ± 3 mV, +18 ± 2 mV and 5.2 ± 0.3 mV for Gmax, V rev, V ½ and k respectively (Fig. 1 D). The relationship linking the decrease in fluorescence to voltage was similar to the I–V relationship of the L‐type Ca2+ current (Fig. 1 C) and calculating the derivative of the fluorescence changes to yield the rate of Mn2+ influx revealed that the kinetic of this rate closely matched the kinetic of the Mn2+ current (Fig. 1 A). This close matching was more evident when fluorescence changes were recorded at a high sampling rate using photomultipliers (Fig. 1 B). The relationship linking the peak values of the rate of Mn2+ influx to voltage showed that the maximal rate was obtained at a potential close to the one for which the current was maximal, but the voltage threshold of the rate of Mn2+ influx was systematically found to be more negative (Fig. 1 D). Mean V ½ of the Mn2+ influx rate (+12 ± 2 mV) was significantly more negative than that of the current (+18 ± 2 mV) (unpaired test P = 0.008). Although not significantly, the mean extrapolated V rev of the rate of Mn2+ influx (+87 ± 5 mV) was also higher than that of the current (+78 ± 3 mV) certainly because the L‐type Mn2+ current was contaminated by outward K+ currents, despite the presence of TEA and 4‐aminopyridine in the external solution, whereas Mn2+ influx monitored with fura‐2 was not (see also below).
A next series of experiments aimed to explore the effect of blocking the L‐type current on voltage‐activated Mn2+ influx. The specific blocker nifedipine could not be used because excitation light of fura‐2 induced flash photolysis of the molecule, making it poorly active. We rather used Cd2+ at a concentration of 0.5 mm reported to completely inhibit the current (Berbey & Allard, 2009). Figure 2 A and C show that Mn2+ quenching was reduced but not suppressed by the presence of Cd2+ whereas the L‐type Mn2+ current was totally inhibited. We then took advantage of the use of Cd2+ to convert fura‐2 signals into currents. For this, we subtracted the fura‐2 signal obtained in the presence of Cd2+ from the fura‐2 signal obtained in its absence and calculated the derivative of this Cd2+‐sensitive signal (Fig. 2 B). In parallel, we extracted the Cd2+‐sensitive component of the current. Plotting the peak values of the rate of Mn2+ influx in different fibres at different voltages as a function of Cd2+‐sensitive current density led to an apparent linear relationship (Fig. 2 D). The best fit to the data indicated a slope of 2.8. This coefficient was used to convert the rate of fura‐2 signals obtained in control into current densities which were plotted as a function of voltage. Fitting a Boltzmann equation in each cell indicated mean values of 84 ± 4 S F–1, +87 ± 5 mV, +12 ± 2 mV and 6.6 ± 0.2 mV for G max, V rev, V ½ and k, respectively (Fig. 3 D). The mean G max (84 ± 4 S F–1) of the calculated current was apparently much lower than the mean G max of the measured current (143 ± 18 S F–1), but this difference could be explained by the fact that the fitted G max value is highly dependent on V rev, which was higher for the calculated current probably because of the contamination of the measured current by a K+ current. Accordingly, we performed a series of measurements of Mn2+ currents in the presence of an internal solution containing Cs+ salts instead of K+ salts in order to reduce the possible contamination by K+ currents. Fitting a Boltzmann equation in the 11 cells tested under these conditions indicated mean values of 98 ± 5 S F–1, +83 ± 3 mV, +14 ± 3 mV and 4 ± 0.2 mV for G max, V rev, V ½ and k, respectively and the maximal current density at +30 mV was 4.55 ± 0.41 A F–1 (data not shown). The close matching of this value with the calculated maximal current density at +30 mV (4.6 ± 0.4 A F–1) gave evidence of the reliability of the conversion factor. Additionally, Cd2+ at 0.5 mm completely suppressed net inward currents in the presence of internal Cs+, as observed in the presence of internal K+, indicating that residual K+ currents did not mask a possible inward current in the series of experiments performed in the presence of internal K+ (data not shown).
Figure 2. Conversion of the rate of change in fura‐2 fluorescence induced by Mn2+ influx into current density .
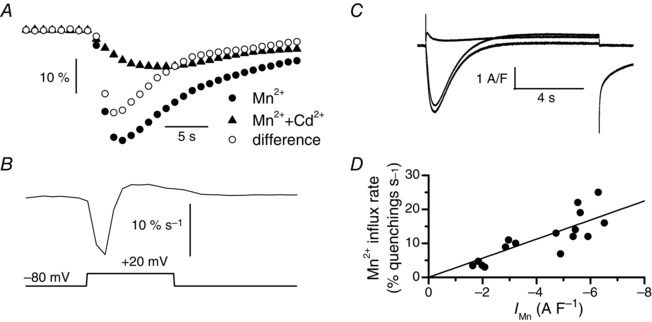
A, superimposition of the changes in fura‐2 fluorescence induced by a 10 s voltage pulse given to +20 mV (lower trace in B) in the absence of Cd2+ (closed circles) and in the presence of Cd2+ (closed triangles) and of the difference between the two signals corresponding to the Cd2+‐sensitive component of the fluorescence changes (open circles) in the same fibre. Fluorescence images were captured at 1 Hz. B, rate of the Cd2+‐sensitive fluorescence change obtained in E. C, membrane currents obtained in the absence of Cd2+ (middle trace) and in the presence of Cd2+ (upper trace) and current difference corresponding to the Cd2+‐sensitive component of the current (lower trace) associated with the changes in fluorescence in A. D, relationship between the rate of the Cd2+‐sensitive fura‐2 fluorescence changes and the Cd2+‐sensitive component of Mn2+ current. Data points were fitted using a linear regression with a slope of 2.8.
Figure 3. Voltage dependence of Mn2+ influx in the presence of Cd2+ .
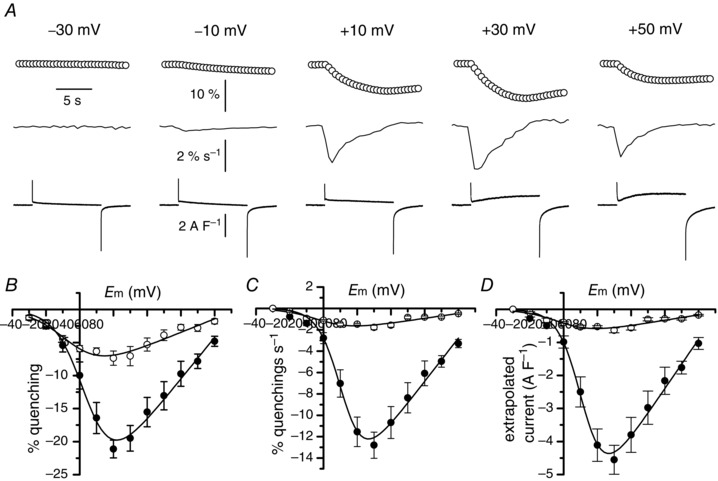
A, simultaneous recordings of changes in fura‐2 fluorescence (upper traces) and membrane currents (lower traces) in the same fibre in response to depolarizing pulses of 10 s duration to the voltages indicated above the fluorescence traces. Middle traces correspond to derivatives of the fluorescence traces. Fluorescence images were captured at 2 Hz. B, relationships between the mean change in fura‐2 fluorescence and membrane potential in the absence (closed symbols) (n = 7) and in the presence of Cd2+ (open symbols) (n = 8). C, relationships between the mean rate of changes in fura‐2 fluorescence and membrane potential in the absence (closed symbols) and in the presence of Cd2+ (open symbols). D, relationships between the mean calculated Mn2+ current density and membrane potential in the absence (closed symbols) and in the presence of Cd2+ (open symbols).
The quite large quenching signal that persisted in the presence of Cd2+ while the current was totally suppressed prompted us to explore the voltage dependence of the Mn2+ influx in order to determine whether another pathway may be involved in the presence of Cd2+ (Fig. 3 A). The relationships linking the Mn2+ quenching and the rate of Mn2+ quenching to voltage indicated that the mean peak values of the Mn2+ quenching and of its rate were reduced by 65 and 86%, respectively, in the presence of Cd2+ (Fig. 3 B, C). Conversion to current densities and fitting a Boltzmann equation in each cell indicated mean values of 11 ± 2 S F–1, 92 ± 3 mV, 1 ± 4 mV and 9.7 ± 1.1 mV for G max, V rev, V ½ and k, respectively (Fig. 3 D). When these parameters were compared in the presence and in the absence of Cd2+, significant differences were found for the calculated G max but also for V ½, which were both lower in the presence of Cd2+ (unpaired test, P < 0.0001 for G max and P = 0.03 for V ½).
At first sight, our data may suggest that a Cd2+‐insensitive influx occurs through a parallel pathway distinct from L‐type channels that does not produce a detectable current. A possible candidate could be the transient receptor potential melastatin 7 (TRPM7) channel. This channel has indeed been shown to be abundantly expressed in skeletal muscle (Krüger et al. 2008), to produce little inward current and to mediate Mn2+ influx (Montheil‐Zoller et al. 2003; Castillo et al. 2010). However, TRPM7 is not gated by voltage but open by a decrease in intracellular [ATP] (Demeuse et al. 2006). For TRPM7 to be involved, it should then be assumed that depolarization produced a decrease in ATP under the tubular membrane displaying kinetic and voltage dependence comparable with those exhibited by the voltage‐gated L‐type Mn2+ influx, which is not well constrained (see also below). Another possibility is that the Mn2+ quenching method offers such a high resolution that a strong reduction in the kinetics of Mn2+ influx induced by Cd2+ could lead to an apparent complete blockade of the current but still allow a substantial Mn2+ influx producing quenching to occur. To explore this last hypothesis, we first tested if higher concentrations of Cd2+ could further block Mn2+ influx, given that, if Mn2+ enters through a pathway distinct from L‐type channels in the presence of 0.5 mm Cd2+, higher concentrations of Cd2+ should not further inhibit this influx. Figure 4 A shows that 0.5 mm Cd2+ induced a total inhibition of the inward current while the rate of quenching signal was inhibited by 67%. An increase of the Cd2+ concentration to 2 mm led to a further inhibition of the Mn2+ influx by 79%. On average, the rate of quenching signal was reduced by 64 ± 2 and 80 ± 1% in the presence of 0.5 and 2 mm Cd2+, respectively. We also observed that the presence of 2 mm Cd2+ induced the development of a small net inward current probably resulting from Cd2+ entry in the presence of such a high external concentration of Cd2+. Although we cannot totally exclude that high concentrations of Cd2+ could affect a parallel pathway distinct from L‐type channels, the fact that 2 mm Cd2+ further blocked the Mn2+ influx and the preserved global shape of the quenching signal and of its rate in the presence of high concentrations of Cd2+ (Fig. 4 B) strongly suggested that entry of Mn2+ ions through L‐type channels is not fully blocked by 0.5 mm Cd2+ but its rate may not be high enough to give rise to a detectable net inward current. It remained difficult to explain how such a substantial rate of influx could persist in the presence of Cd2+ whereas the L‐type current was totally blocked. However, we hypothesized that the relationship between the rate of Mn2+ influx and the Mn2+ current density was linear for current densities over 1.5 A F–1, as illustrated in Fig. 2, but possibly deviated from linearity for lower currents. If this was true, the rate of Mn2+ influx monitored by quenching might be higher for small current densities than that expected when assuming a linear relationship between rates of quenching and currents. This could explain the apparent lower blocking effect of Cd2+ on the rate of quenching as compared to currents. If so, the calculated currents in the presence of Cd2+ presented in Fig. 3 could be overestimated. As Cd2+ is able to permeate the L‐type channels, as evidenced by the small inward current recorded in the presence of 2 mm Cd2+, we also checked if the unique presence of 0.5 mm Cd2+ as a divalent cation may be able to produce a voltage‐activated influx of Cd2+ high enough to make a change in fura‐2 fluorescence. In the three cells tested in the unique presence of Cd2+ as a divalent cation at a concentration of 0.5 mm, two subsequent voltage pulses of 10 s duration given to +20 mV did not elicit any detectable change in fura‐2 fluorescence, indicating that the remaining quenching signal obtained in the presence of 10 mm Mn2+ and 0.5 mm Cd2+ cannot be attributed to an influx of Cd2+ through the DHPR, conditions that are moreover less favourable to Cd2+ influx because of the probable competition existing between Mn2+ and Cd2+ for permeation.
Figure 4. Effect of increasing concentrations of Cd2+ on voltage‐activated Mn2+ influx .
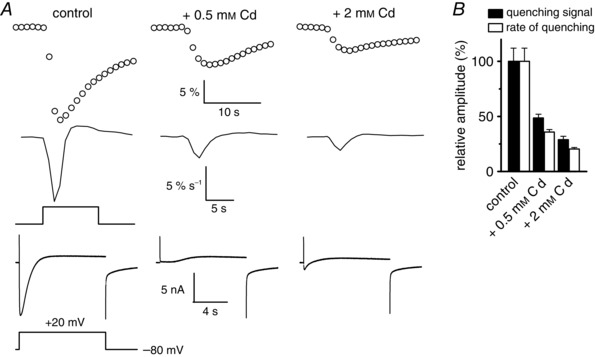
A, simultaneous recordings of Mn2+ quenching signal, quenching signal derivatives and membrane currents in the same fibre (from top to bottom) in response to a depolarizing pulse of 10 s duration to +20 mV in control (left panel), in the presence of 0.5 mm Cd2+ (middle panel) and in the presence of 2 mm Cd2+ (right panel). Fluorescence images were captured at 1 Hz. B, mean relative amplitudes of the voltage‐activated quenching signal and their rates in control, and in the presence of 0.5 and 2 mm Cd2+.
Voltage‐dependent L‐type currents are known to display a voltage‐ and time‐dependent inactivation reversed by cell repolarization (e.g. Harasztosi et al. 1999). To further explore whether the remaining Mn2+ influx in the presence of Cd2+ involves L‐type channels or a distinct pathway, we next examined if the kinetics of recovery from inactivation of the Mn2+ influx were comparable in the presence and in the absence of Cd2+. Figure 5 A shows that a prolongation from 1 to 2 s of the time interval between two consecutive voltage pulses to +20 mV led to an increased recovery both of the L‐type current and Mn2+ influx under control conditions. In the same fibre, addition of 0.5 mm Cd2+ led to a total inhibition of L‐type currents but not of the Mn2+ influx, and the remaining Mn2+ influx was restored from inactivation in a similar manner as in control by an increase in the time interval separating the two voltage pulses (Fig. 5 B). On average, restoration of normalized Mn2+ influxes was very similarly affected by an increase in the duration of the recovery interval in the absence and in the presence of Cd2+ (Fig. 5 C). These results provide additional arguments in favour of a common pathway corresponding to L‐type channels involved in the Mn2+ influx in the absence and in the presence of Cd2+. They also again exclude that TRPM7 channels could contribute to the remaining quenching signal, because, if so, it should be assumed that the kinetics of recovery of intracellular [ATP] that gates the channels perfectly mimics the kinetics of the recovery from inactivation of the L‐type channels, which is very unlikely.
Figure 5. Recovery from inactivation of voltage‐activated Mn2+ influx in the absence and in the presence of external Cd2+ .
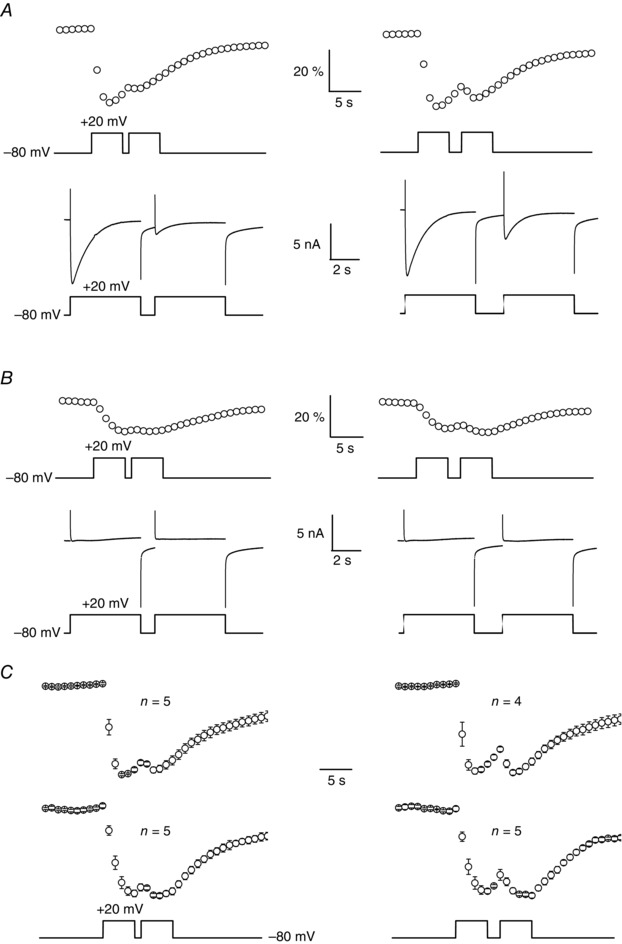
A, simultaneous recordings of changes in fura‐2 fluorescence and membrane currents in the same fibre in response to two successive depolarizing pulses of 5 s duration to +20 mV separated by a pulse interval to −80 mV of 1 s (left panel) and 2 s duration (right panel) in the presence of a control external solution. Fluorescence images were captured at 1 Hz. B, simultaneous recordings of changes in fura‐2 fluorescence and membrane currents in the same fibre as in A in response to two successive depolarizing pulses of 5 s duration to +20 mV separated by a pulse interval to −80 mV of 1 s (left panel) and 2 s duration (right panel) in the presence of an external solution containing 0.5 mm Cd2+. Fluorescence images were captured at a frequency of 1 Hz. C, mean and SEM normalized changes in fura‐2 fluorescence induced by two successive depolarizing pulses of 5 s duration to +20 mV separated by a pulse interval to −80 mV of 1 s (left panel) and 2 s duration (right panel) in the presence of a control external solution (upper traces) and in the presence of an external solution containing 0.5 mm Cd2+ (lower traces).
Finally, we performed a series of experiments on isolated muscle fibres from zebrafish larvae (Fig. 6 A). Voltage‐activated L‐type Ca2+ currents have indeed been demonstrated to be absent in these cells (Schredelseker et al. 2005). Therefore, recording or not of an Mn2+ influx detected by the quenching method in response to depolarization should show if a parallel voltage‐gated Ca2+ pathway distinct from DHPR exists in skeletal muscle. Using the whole cell configuration of the patch clamp technique, we first confirmed that L‐type currents carried by Mn2+ were absent in zebrafish muscle fibres (Fig. 6 B). Fibres were then loaded with fura‐2 through the patch pipette (Fig. 6 C). In the presence of 2.5 mm external Ca2+, a Ca2+ transient could be detected in response to a voltage pulse to +20 mV when fura‐2 was excited at 380 nm, a wavelength at which fura‐2 fluorescence decreases in response to an increase in intracellular Ca2+. Excitation wavelength was then switched to 360 nm. A depolarizing pulse to +20 mV did not elicit any change in fura‐2 fluorescence, confirming that the indicator was excited at its isosbestic point. Replacement of external Ca2+ by 10 mm Mn2+ gave rise to a progressive decrease of fluorescence at –80 mV, probably resulting from a slow Mn2+ entry through open Ca2+ leak channels that quenched fura‐2 fluorescence as observed in mammalian muscle (Berbey & Allard, 2009). In the continuous presence of external Mn2+, a 10 s voltage pulse to +20 mV did not induce any change in fura‐2 fluorescence, indicating that in the absence of L‐type current, no voltage‐gated Mn2+ influx occurred. In the 11 cells tested under the same experimental conditions, Mn2+ influx was never observed in response to voltage pulses.
Figure 6. Absence of voltage‐activated Mn2+ influx in isolated fibres from zebrafish larvae .
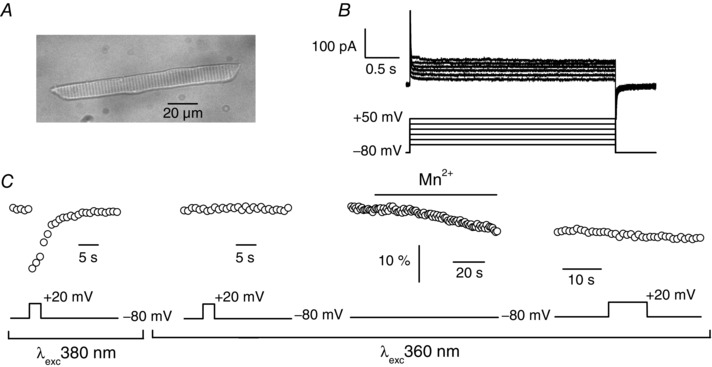
A, transmitted light image of an isolated muscle fibre from zebrafish larvae. B, membrane currents (upper traces) elicited by voltage pulses given to −50, −30, −10, +10, +30 and +50 mV (lower traces). C, changes in fura‐2 fluorescence induced by a 3 s voltage pulse given to +20 mV upon excitation of fura‐2 at 380 nm (first panel from left), and upon excitation of fura‐2 at 360 nm (second panel from left), then induced by replacement of external Ca2+ by 10 mm Mn2+ at −80 mV upon excitation of fura‐2 at 360 nm (third panel from left), and in response of a 10 s voltage pulse given to +20 mV upon excitation of fura‐2 at 360 nm in the continuous presence of 10 mm Mn2+ (fourth panel from left) in the same muscle fibre. Fluorescence images were captured at 1 Hz.
We then investigated Mn2+ influx in response to physiological excitation of muscle fibres, i.e. in response to trains of action potentials recorded under current clamp conditions. The quenching was so low under these conditions that intracellular [EGTA] had to be reduced to 5 mm and intracellular [fura‐2] to be increased to 200 μm to reveal a change in fluorescence. Despite this reduced [EGTA], fibres challenged with trains of action potentials did not contract, allowing reliable measurement of quenching. Figure 7 A shows that a train of action potentials evoked a slow Mn2+ influx, the mean calculated maximum rate of which was 1.53 ± 0.3% s–1 (n = 41). In five of the 41 fibres tested, we were able to measure the change in fluorescence induced by a train of action potentials, then change the external solution and switch to voltage clamp to measure the voltage‐activated current and the associated changes in fura‐2 fluorescence in the absence and in the presence of Cd2+ without the contracting of these five fibres despite the presence of 5 mm EGTA (Fig. 7 B). As performed in Fig. 2, we plotted the Cd2+‐sensitive component of Mn2+ influx as a function of the Cd2+‐sensitive component of the current and the best linear fit to the data indicated a slope of 4.97 (Fig. 7 C, D). Using this coefficient, the conversion of the maximum rate of Mn2+ into current density yielded a calculated mean Mn2+ current of 0.31 ± 0.06 A F–1 during a train of action potentials.
Figure 7. Mn2+ influx and calculated Mn2+ current density induced by trains of action potentials .
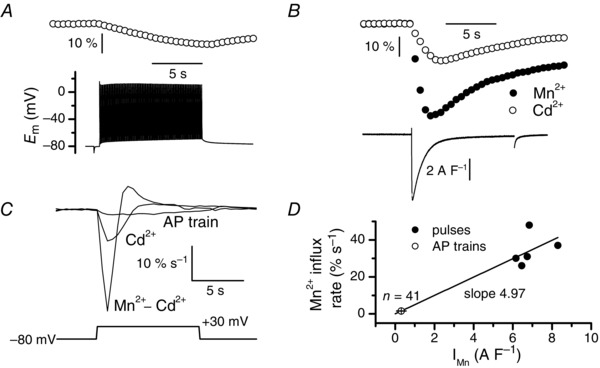
A, train of action potentials (50 Hz, 0.5 ms suprathreshold current pulses) (lower trace) and associated fura‐2 fluorescence change (upper trace). B, fura‐2 fluorescence changes in the absence (closed symbols) and in the presence of Cd2+ (open symbols) and Cd2+‐sensitive current trace (lower trace) induced by a 10 s voltage pulse to +30 mV in the same fibre as in A. Fluorescence images were captured at 2 Hz. C, corresponding rates of fura‐2 fluorescence changes obtained in A in response to the train of action potentials and in B in response to the voltage pulse in the presence of Cd2+ and corresponding rate of the Cd2+‐sensitive change of fura‐2 fluorescence. D, relationships between the rate of the Cd2+‐sensitive fura‐2 fluorescence changes obtained in response to a voltage pulse to +30 mV (closed symbols) and the Cd2+‐sensitive component of Mn2+ current and between rates of fluorescence changes induced by trains of action potentials (open symbol) and current density. Data points were fitted using a linear regression with a slope of 4.97.
To our surprise, addition of Cd2+ did not inhibit Mn2+ influx induced by trains of action potentials but instead potentiated it (Fig. 8 A, B). However, scrutinizing action potentials during the trains indicated that the duration of action potentials was significantly augmented in the presence of Cd2+, suggesting that the potentiation of the Mn2+ influx resulted from a longer spike depolarization of the cell (Fig. 8 C, D). This assumption was confirmed by showing that a significant increase of action potential duration produced by addition of 10 mm of the voltage‐dependent K+ channel blocker TEA (Fig. 9 A, B) led to a significant increase in the Mn2+influx and of the rate of the Mn2+ influx evoked by a train of action potentials (Fig. 9 C, D). Our preceding voltage clamp experiments indicate that the only pathway for Mn2+ influx is the L‐type channel but, if so, it is unclear how addition of the L‐type channel blocker Cd2+ could provoke an increase in the Mn2+ influx induced by a train of action potentials. However, our preceding voltage clamp data showed that 0.5 mm Cd2+ did not totally inhibit the Mn2+ influx and we speculate that the reduction in the Mn2+ influx produced by Cd2+ could be balanced by the strong potentiating effect provoked by the Cd2+‐induced increase in the duration of action potentials. In support of this, we noted that, on average, the rate of Mn2+ influx was augmented by 47% in the presence of Cd2+ while the duration of action potentials was increased by 37 and 47% at −60 and 0 mV, respectively, whereas the rate of influx was augmented by 71% in the presence of TEA when the duration of action potentials was only increased by 13 and 19% at −60 and 0 mV, respectively. These observations thus strongly suggest that in the presence of Cd2+ the potentiating effect of the prolongation of action potential dominates over the inhibiting effect produced by Cd2+ on Mn2+ influx through L‐type channels.
Figure 8. Effect of Cd2+ on Mn2+ influx induced by trains of action potentials .
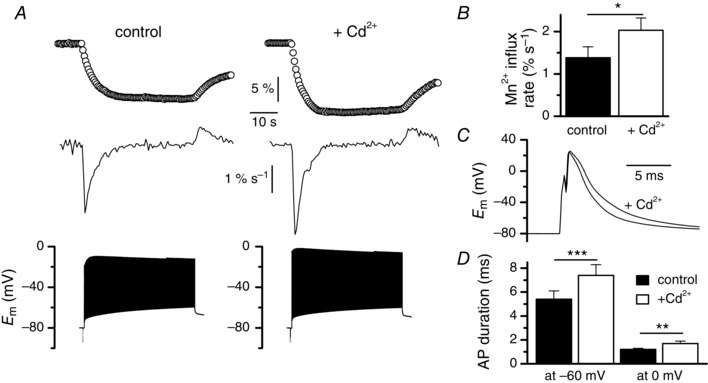
A, fura‐2 fluorescence changes (upper traces) and corresponding rates of fura‐2 fluorescence changes (middle traces) in response to trains of action potentials (lower traces) in the absence and in the presence of Cd2+, in the same fibre. Fluorescence images were captured at 2 Hz. B, mean rates of fura‐2 fluorescence changes induced by trains of action potentials in the absence and in the presence of Cd2+ (n = 6). C, superimposition of the first action potential of the train recorded in the absence and in the presence of Cd2+ in the same fibre. D, mean durations of the action potentials between the maximal depolarization value and return to −60 mV and between the maximal depolarization and return to 0 mV in the absence and in the presence of Cd2+ (n = 6). Data were compared using a paired test.
Figure 9. Effect of TEA and of the Ca2+ channel agonist BayK 8644 on Mn2+ influx induced by trains of action potentials .
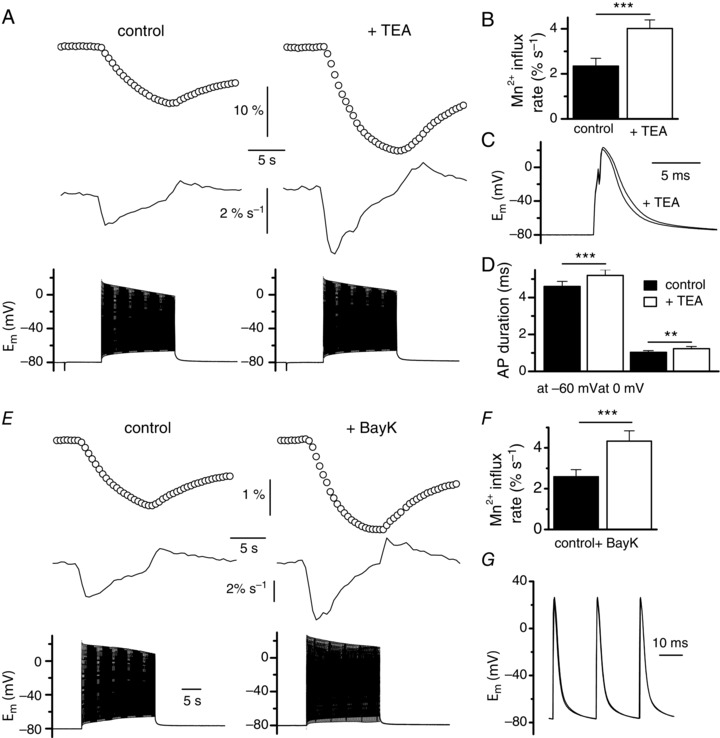
A, fura‐2 fluorescence changes (upper traces) and corresponding rates of fura‐2 fluorescence changes (middle traces) in response to trains of action potentials of 10 s duration (lower traces) in the absence and in the presence of 10 mm TEA, in the same fibre. Fluorescence images were captured at 2 Hz. B, mean rates of fura‐2 fluorescence changes induced by trains of action potentials in the absence and in the presence of TEA (n = 8). C, superimposition of the first action potential of a train recorded in the absence and in the presence of TEA in the same fibre. D, mean durations of the action potentials between the maximal depolarization value and return to −60 mV and between the maximal depolarization and return to 0 mV in the absence and in the presence of TEA (n = 8). E, fura‐2 fluorescence changes (upper traces) and corresponding rates of fura‐2 fluorescence changes (middle traces) in response to trains of action potentials of 10 s duration (lower traces) in the absence and in the presence of 5 μm Bay K in the same fibre. Fluorescence images were captured at 2 Hz. F, mean rates of fura‐2 fluorescence changes induced by trains of action potentials in the absence and in the presence of Bay K (n = 6). G, superimposition of the first action potentials of the trains recorded in the absence and in the presence of Bay K in E. Data were compared using a paired test.
In a last series of experiments, we tested the effects of BayK 8644, a molecule known to potentiate L‐type currents. Despite a possible reduction of the potency of the drug due to excitation light‐induced photolysis, Fig. 9 E and F show that addition of the dihydropyridine compound induced a large increase in the Mn2+ influx evoked by a train of action potentials without changing the shape of the action potentials (Fig. 9 G). This result again argues in favour of the L‐type channel being involved in the Mn2+ influx evoked by a train of action potentials.
As mentioned before, a postulated role of voltage‐gated Ca2+ entry is to help maintaining SR Ca2+ content during prolonged excitation. To test this hypothesis, we loaded the SR lumen with the fluorescent indicator fluo‐5N and investigated the effect of increasing the intensity of the voltage‐gated Ca2+ influx by doubling the external [Ca2+] on SR Ca2+ content changes. As illustrated in previous studies (Robin & Allard, 2013), the SR Ca2+ signal recorded with fluo‐5N consisted of a fast and marked depletion phase at the pulse onset due to SR Ca2+ release followed by a slow recovery phase during depolarization provoked by inactivation of SR Ca2+ release in the presence of 2.5 mm Ca2+ (Fig. 10 A). Upon repolarization to −80 mV, closure of Ca2+ release channels together with SR Ca2+ reuptake led to the progressive return of fluo‐5N fluorescence to resting level. As expected, a change of the external [Ca2+] from 2.5 to 5 mm induced an increase of the inward Ca2+ current (Fig. 10 A). We then normalized the SR Ca2+ signals to their maximal amplitude and compared the rates of the fluorescence recovery phase during and after the depolarization step. Figure 10 A shows that the rate of these two phases was increased in the presence of 5 mm Ca2+ and, on average, the SR Ca2+ content was significantly higher at the end of the depolarization and 5, 10, 20 and 50 s after repolarization to −80 mV (Fig. 10 B). A likely interpretation of these results is that Ca2+ ions that enter muscle cells during excitation have access to the SR lumen and contribute to its replenishment during depolarization but also upon repolarization after Ca2+ release has stopped.
To confirm our assumption, we investigated the effect of voltage‐gated Mn2+ influx on SR Ca2+ signals by hypothesizing that, if Mn2+ ions that flow during depolarization have access to the SR lumen, Mn2+ influx should provoke a quenching of the fluo‐5N fluorescence. Figure 10 C shows the effect of a replacement of 10 mm Mg2+ by 10 mm Mn2+ in the extracellular solution, in the presence of 2.5 mm Ca2+ to avoid a possible effect of a free Ca2+ solution on SR Ca2+ leak (Robin & Allard, 2012). In this regard, we observed that the recovery phase immediately after depolarization was faster in the presence of both 10 mm Mg2+ and 10 mm Mn2+, indicating that these high concentrations of divalent cations favored the closing state of the Ca2+ release channel as compared to 2.5 or 5 mm external Ca2+ conditions. Replacement of Mg2+ by Mn2+ induced a slowing of the activation and inactivation kinetics of the voltage‐activated inward current, suggesting the development of an influx of Mn2+ ions. In parallel, the rate of the recovery phase of the SR Ca2+ signal after depolarization was significantly decreased (Fig. 10 C, D). Note that the initial level of fluo‐5N fluorescence could never be reached again once the Mn2+ current has developed, suggesting that Mn2+ ions flowing into the cell in response to depolarization reached the SR lumen and irreversibly quenched a fraction of fluo‐5N fluorescence. We also checked that addition of Mn2+ in the external solution did not provoke a change in basal fluo‐5N fluorescence at −80 mV, indicating that the observed effects are not linked to a possible release of residual Ca2+ from the SR store (data not shown). Additional experiments using comparable experimental conditions showed that addition of the L‐type Ca2+ current agonist BayK 8644 also induced a faster recovery phase of the SR Ca2+ signal after depolarization, again suggesting that Ca2+ entering through L‐type channels contributes to refill the SR (data not shown).
Discussion
The simultaneous recording of Mn2+ currents and of unidirectional trans‐sarcolemmal Mn2+ influx under voltage clamp conditions allowed us to show that divalent cations exclusively enter muscle fibres through L‐type Ca2+ channels during muscle activity. The time derivative of quenching indeed matched the current kinetics and the maximal values of the rate of quenching and of the current were observed at the same voltages. It is very likely that the Mn2+ quenching technique offers a much higher resolution than the measurement of current because a voltage‐gated Mn2+ influx was observed at voltages more negative than voltages inducing a detectable inward current and, consequently, V ½ of the rate of quenching was significantly more negative than V ½ of the current. Calibration of the fura‐2 quenching response in a previous study showed that the Mn2+ quenching technique could detect an Mn2+ influx giving rise to an estimated current of a few picoamps, which is far below the resolution capacity of the voltage clamp amplifier in the whole cell configuration (Berbey & Allard, 2009). Surprisingly, the use of Cd2+ at a concentration of 0.5 mm revealed that a substantial voltage‐dependent Mn2+ influx developed despite a complete blockade of the current. The voltage dependence of this remaining influx was very similar to that obtained in control although the V ½ of the quenching and of the quenching rate were significantly more negative in the presence of Cd2+ than that obtained in its absence. This apparent shift of the voltage dependence towards negative potentials was, however, probably due to relief of L‐type Ca2+ channel block by Cd2+ at negative voltages (Byerly et al. 1984). The persistence of a sizeable Mn2+ influx in the presence of 0.5 mm Cd2+, a concentration that totally inhibited the L‐type current, prompted us to further investigate the possible existence of a voltage‐gated pathway which could develop in parallel with L‐type influx without producing a detectable current and which could be reminiscent of the ECCE initially found in myotubes (Cherednichenko et al. 2004). However, we first showed that a higher concentration of Cd2+ (2 mm) further inhibited Mn2+ influx, suggesting that, despite the absence of a detectable L‐type current in the presence of 0.5 mm Cd2+, an Mn2+ influx through these channels persists as it can be blocked by a higher concentration of Cd2+. Secondly, we demonstrated that the restoration kinetics of the Mn2+ influx after inactivation were identical in the presence and in the absence of Cd2+, again suggesting that it is the same voltage‐gated pathway that is involved in the Mn2+ influx in the presence and in the absence of Cd2+. Finally, we found that in fibres from zebrafish (the DHPR of which is known to not carry L‐type currents), depolarization did not induce any Mn2+ influx. Although we cannot exclude that the sarcolemmal transmembrane ionic pathways could be distinct in mouse and fish, this last result demonstrates that when there is no Mn2+ influx through L‐type channels there is no Mn2+ influx in response to depolarization. Taken together, these data strongly suggest that the L‐type current through DHPR is the only contributor to voltage‐gated Ca2+ influx in adult mouse skeletal muscle fibres and definitely indicate that the Mn2+ quenching technique has a much higher resolution than measurement of the current.
Under our experimental conditions, long‐lasting depolarizations activate Ca2+ release, and should thus provoke SR Ca2+ depletion, which in turn may activate SOCE. However, our previous study has shown that SR Ca2+ depletion is close to maximum at voltages as low as −40 mV during maintained depolarizations (Robin & Allard, 2012), so that Mn2+ entry should be largest at these voltages for which the electrochemical Ca2+ gradient is highest, while we observed the largest Mn2+ influx around +30 mV. Although we cannot totally exclude that a tiny part of Mn2+ entry corresponds to SOCE, the observed voltage dependence and the kinetics of Mn2+ influx are hardly compatible with SOCE.
Trains of action potentials induced an Mn2+ influx of much lower magnitude. The conversion of the quenching signals into currents proved to be very reliable under voltage clamp conditions and we used this calibration procedure to convert the quenching signals produced by trains of action potentials into currents as well. In this way, we estimated for the first time a mean amplitude of 0.31 A F–1 of the Mn2+ current which flowed during a train of action potentials. This current represented only 7% of the mean maximal current produced by a voltage pulse to +30 mV. Very surprisingly, we found that addition of Cd2+ did not block Mn2+ entry but in contrast potentiated it. However, analysis of the action potentials revealed that Cd2+ significantly increased action potential duration, a result early reported in rat muscle (Mould & Dulhunty, 1999). The observed increase in Mn2+ influx in the presence of Cd2+ probably resulted from prolongation of the action potentials, which dominated over the blocking effect of Cd2+ on L‐type channels because TEA was also found to exert a potentiating effect on Mn2+ influx but to a much higher extent while action potentials were prolonged by TEA to a lesser extent. Finally, the fact that the L‐type Ca2+ channel agonist BayK 8644 induced a potentiating effect on the Mn2+ influx induced by a train of action potentials further suggested that this influx occurred through L‐type channels. Our present data are in apparent contradiction with those obtained in a previous study (Berbey & Allard, 2009). Because Cd2+ was observed to totally suppress the L‐type current but not the quenching signal and to not affect the quenching signal induced by a train of action potentials, we concluded that a voltage‐activated Mn2+ influx through a pathway distinct from L‐type channels operated in an electrically silent manner. However, note that in this study the quenching signal was not measured during the depolarization phase of the muscle fibre but instead estimated as the change in fura‐2 fluorescence intensity after the depolarization phase, so that we were unable to compare the kinetics and the voltage dependence of the rate of Mn2+ influx with those of the L‐type current. We also did not notice that action potentials were prolonged in the presence of Cd2+. All this explains why our previous data, although in accordance with those obtained in the present study, were misinterpreted.
A postulated but undemonstrated role of Ca2+ entry in active skeletal muscle is to contribute to replenishment of the SR with Ca2+. We found that doubling the external [Ca2+] induced an acceleration of the recovery phase of the SR fluorescence signal both during and after the depolarizing pulse. This observed acceleration of the recovery phase could be interpreted in terms of an elevated inactivation of Ca2+ release. However, according to previous studies, an increase of external [Ca2+] from 2.5 to 5 mm should have reduced and not promoted inactivation (Brum et al. 1988). A more likely interpretation is that the elevated voltage‐gated Ca2+ influx resulting from an increase in the trans‐sarcolemmal electrochemical Ca2+ gradient contributed to refill the SR with Ca2+ during the 10 s of depolarization. The fact that BayK 8644 also produced an acceleration of the SR Ca2+ signal recovery phase after depolarization further supports this interpretation. In contrast, replacement of 10 mm Mg2+ by 10 mm Mn2+ in the external solution led to a slowing of the recovery phase after depolarization, suggesting that Mn2+ ions first transited in the cytosol and then were pumped into the SR by Ca2+‐ATPases and quenched the fluo‐5N fluorescence. Chiesi & Inesi (1980) indeed showed in SR vesicles that Mn2+ ions could be actively transported in place of Ca2+, even though at slower rates. They also found that Mn2+ was an activator of the Ca2+ pump. This latter effect, if not associated with a quenching effect, should have induced an acceleration of the recovery phase of fluo‐5N signal during and after the depolarization. The fact that we observed the opposite suggests strongly that Mn2+ ions are pumped into the SR and quench fluo‐5N fluorescence. However, under our experimental conditions, the uptake of Mn2+ ions and their resulting quenching effect in the SR should be markedly attenuated because of the high cytosolic [EGTA]. Together with the slow Mn2+ pumping rate, this could also explain why the recovery phase was significantly modified only after repolarization.
Our data have physiological relevance. First, we are confident that, in terms of magnitude, the Mn2+ influx that we measured in this study closely matches the Ca2+ influx that should occur in the presence of a physiological external [Ca2+]. Our measurements of voltage‐gated currents indeed indicate that the density of L‐type current carried by Mn2+ ions in the presence of an external concentration of 10 mm is comparable to the density of L‐type current carried by Ca2+ ions in the presence of a physiological external concentration of 2.5 mm (Collet et al. 2003). Second, we demonstrate that the voltage‐activated Ca2+ influx gains access to the SR lumen during long‐lasting muscle activation. However, the calculated transmembrane current provoked by a train of action potentials indicated that the influx was very low, which raises the question of whether this Ca2+ entry has any significant influence on the SR Ca2+ filling level. On the basis of the measured capacitance in each cell and assuming a mean capacitance per unit area of 5 μF cm–2 (Jacquemond, 1997), we calculated that the measured maximal L‐type Mn2+ current density brought the intracellular [Ca2+] to a mean value of 168 ± 14 μm in 13 cells. Given that the Ca2+ influx induced by a train of action potentials represents about 7% of this influx and assuming that the totality of Ca2+ that enters the cell reaches the SR lumen estimated to occupy approximately 5% of the intracellular volume (Eisenberg, 1983), voltage‐gated Ca2+ entry may increase the luminal [Ca2+] by 240 μm during a 10 s bout of tetanic stimulation. Resting SR [Ca2+] has been estimated to be around 400 μm (Ziman et al. 2010; Sztretye et al. 2011). Moreover, we have previously shown that Ca2+ depletion is the only process that leads to Ca2+ release decline during continuous stimulation (Robin & Allard, 2013). It is thus very likely that voltage‐gated Ca2+ entry, in reloading SR with Ca2+, significantly helps to preserve muscle performance during prolonged activity. The contribution of voltage‐gated Ca2+ influx may be even more of a determinant during fatigue because the increase in action potential duration that has been reported (Lännergren & Westerblad, 1986) should potentiate Ca2+ entry, as suggested by our results obtained in the presence of Cd2+ and TEA.
Additional information
Competing interests
The authors declare that they have no conflict of interest.
Author Contributions
G.R.: conception and design of the experiments, collection, assembly, analysis and interpretation of data. B.A.: conception and design of the experiments, collection, assembly, analysis and interpretation of data, and writing of the manuscript.
Funding
This work was supported by grants from the Université Lyon 1, the Centre National de la Recherche Scientifique and the Association Française contre les Myopathies.
Acknowledgement
We thank Vincent Jacquemond for critical comments on the manuscript.
References
- Armstrong CM, Bezanilla FM & Horowicz P (1972). Twitches in the presence of ethylene glycol bis(‐aminoethyl ether)‐N,N′‐tetracetic acid. Biochim Biophys Acta 267, 605–608. [DOI] [PubMed] [Google Scholar]
- Bannister RA, Pessah IN & Beam KG (2009). The skeletal L‐type Ca2+ current is a major contributor to excitation‐coupled Ca2+ entry. J Gen Physiol 133, 79–91. [DOI] [PMC free article] [PubMed] [Google Scholar]
- Berbey C & Allard B (2009). Electrically silent divalent cation entries in resting and active voltage‐controlled muscle fibers. Biophys J 96, 2648–2657. [DOI] [PMC free article] [PubMed] [Google Scholar]
- Brum G, Rios E & Stefani E (1988). Effects of extracellular calcium on calcium movements of excitation–contraction coupling in frog skeletal muscle fibres. J Physiol 398, 441–473. [DOI] [PMC free article] [PubMed] [Google Scholar]
- Byerly L, Chase PB & Stimers JR (1984). Calcium current activation kinetics in neurones of the snail Lymnaea stagnalis. J Physiol 348, 187–207. [DOI] [PMC free article] [PubMed] [Google Scholar]
- Castillo B, Pörzgen P, Penner R, Horgen FD & Fleig A (2010). Development and optimization of a high‐throughput bioassay for TRPM7 ion channel inhibitors. J Biomol Screen 15, 498–507. [DOI] [PMC free article] [PubMed] [Google Scholar]
- Cherednichenko G, Hurne AM, Fessenden JD, Lee EH, Allen PD, Beam KG & Pessah IN (2004). Conformational activation of Ca2+ entry by depolarization of skeletal myotubes. Proc Natl Acad Sci USA 101, 15793–15798. [DOI] [PMC free article] [PubMed] [Google Scholar]
- Chiesi M & Inesi G (1980). Adenosine 5′‐triphosphate dependent fluxes of manganese and hydrogen ions in sarcoplasmic reticulum vesicles. Biochemistry 19, 2912–2918. [DOI] [PubMed] [Google Scholar]
- Collet C, Csernoch L & Jacquemond V (2003). Intramembrane charge movement and L‐type calcium current in skeletal muscle fibers isolated from control and mdx mice. Biophys J 84, 251–265. [DOI] [PMC free article] [PubMed] [Google Scholar]
- Cully TR & Launikonis BS (2013). Store‐operated Ca2+ entry is not required for store refilling in skeletal muscle. Clin Exp Pharmacol Physiol 40, 338–344. [DOI] [PubMed] [Google Scholar]
- Demeuse P, Penner R & Fleig A (2006). TRPM7 channel is regulated by magnesium nucleotides via its kinase domain. J Gen Physiol 127, 421–434. [DOI] [PMC free article] [PubMed] [Google Scholar]
- Dirksen RT (2009). Checking your SOCCs and feet: the molecular mechanisms of Ca2+ entry in skeletal muscle. J Physiol 587, 3139–3147. [DOI] [PMC free article] [PubMed] [Google Scholar]
- Dulhunty AF & Gage PW (1988). Effects of extracellular calcium concentration and dihydropyridines on contraction in mammalian skeletal muscle. J Physiol 399, 63–80. [DOI] [PMC free article] [PubMed] [Google Scholar]
- Eisenberg BA (1983). Quantitative ultrastructure of mammalian skeletal muscle In Skeletal Muscle, ed. Peachey L, pp. 73–112. American Physiological Society, Bethesda, MD. [Google Scholar]
- Harasztosi C, Sipos I, Kovacs L & Melzer W (1999). Kinetics of inactivation and restoration from inactivation of the L‐type calcium current in human myotubes. J Physiol 516, 129–138. [DOI] [PMC free article] [PubMed] [Google Scholar]
- Jacquemond V (1997). Indo‐1 fluorescence signals elicited by membrane depolarization in enzymatically isolated mouse skeletal muscle fibers. Biophys J 73, 920–928. [DOI] [PMC free article] [PubMed] [Google Scholar]
- Krüger J, Kunert‐Keil C, Bisping F & Brinkmeier H (2008). Transient receptor potential cation channels in normal and dystrophic mdx muscle. Neuromuscul Disord 18, 501–513. [DOI] [PubMed] [Google Scholar]
- Kurebayashi N & Ogawa Y (2001). Depletion of Ca2+ in the sarcoplasmic reticulum stimulates Ca2+ entry into mouse skeletal muscle fibres. J Physiol 533, 185–199. [DOI] [PMC free article] [PubMed] [Google Scholar]
- Lännergren J & Westerblad H (1986). Force and membrane potential during and after fatiguing, continuous high‐frequency stimulation of single Xenopus muscle fibres. Acta Physiol Scand 128, 359–368. [DOI] [PubMed] [Google Scholar]
- Lüttgau HC & Spiecker W (1979). The effects of calcium deprivation upon mechanical and electrophysiological parameters in skeletal muscle fibres of the frog. J Physiol 296, 411–429. [DOI] [PMC free article] [PubMed] [Google Scholar]
- Melzer W, Herrmann‐Frank A & Lüttgau HC (1994). The role of Ca2+ ions in excitation–contraction coupling of skeletal muscle fibres. Biochim Biophys Acta 1241, 59–116. [DOI] [PubMed] [Google Scholar]
- Monteilh‐Zoller MK, Hermosura MC, Nadler MJS, Scharenberg AM, Penner R & Fleig A (2003). TRPM7 provides an ion channel mechanism for cellular entry of trace metal ions. J Gen Physiol 121, 49–60. [DOI] [PMC free article] [PubMed] [Google Scholar]
- Mosca B, Delbono O, Laura Messi M, Bergamelli L, Wang ZM, Vukcevic M, Lopez R, Treves S, Nishi M, Takeshima H, Paolini C, Martini M, Rispoli G, Protasi F & Zorzato F (2013). Enhanced dihydropyridine receptor calcium channel activity restores muscle strength in JP45/CASQ1 double knockout mice. Nat Commun 4, 1541. [DOI] [PMC free article] [PubMed] [Google Scholar]
- Mould J & Dulhunty AF (1999). Effects of external cadmium ions on excitation–contraction coupling in rat soleus fibres. Pflügers Arch 437, 197–203. [DOI] [PubMed] [Google Scholar]
- Pizarro G, Fitts R, Uribe I & Rios E (1989). The voltage sensor of excitation–contraction coupling in skeletal muscle. Ion dependence and selectivity. J Gen Physiol 94, 405–428. [DOI] [PMC free article] [PubMed] [Google Scholar]
- Posterino GS & Lamb GD (1998). Effect of nifedipine on depolarization‐induced force responses in skinned skeletal muscle fibres of rat and toad. J Muscle Res Cell Motil 19, 53–65. [DOI] [PubMed] [Google Scholar]
- Rios E & Pizarro G (1991). Voltage sensor of excitation–contraction coupling in skeletal muscle. Physiol Rev 71, 849–908. [DOI] [PubMed] [Google Scholar]
- Robin G & Allard B (2012). Dihydropyridine receptors actively control ryanodine receptors gating in resting mouse skeletal muscle fibers. J Physiol 590, 6027–6036. [DOI] [PMC free article] [PubMed] [Google Scholar]
- Robin G & Allard B (2013). Major contribution of sarcoplasmic reticulum Ca2+ depletion during long‐lasting activation of skeletal muscle. J Gen Physiol 141, 557–565. [DOI] [PMC free article] [PubMed] [Google Scholar]
- Robin G, Berthier C & Allard B (2012). Sarcoplasmic reticulum Ca2+ permeation explored from the lumen side in mdx muscle fibers under voltage control. J Gen Physiol 139, 209–218. [DOI] [PMC free article] [PubMed] [Google Scholar]
- Schneider MF (1994). Control of calcium release in functioning skeletal muscle fibers. Annu Rev Physiol 56, 463–484. [DOI] [PubMed] [Google Scholar]
- Schredelseker J, Di Biase V, Obermair GJ, Felder ET, Flucher BE, Franzini‐Armstrong C & Grabner M (2005). The β1a subunit is essential for the assembly of dihydropyridine ‐receptor arrays in skeletal muscle. Proc Natl Acad Sci USA 102, 17219–17224. [DOI] [PMC free article] [PubMed] [Google Scholar]
- Sztretye M, Yi J, Figueroa L, Zhou J, Royer L & Rios E (2011). D4cpv‐calsequestrin: a sensitive ratiometric biosensor accurately targeted to the calcium store of skeletal muscle. J Gen Physiol 138, 211–229. [DOI] [PMC free article] [PubMed] [Google Scholar]
- Ziman AP, Ward CW, Rodney GG, Lederer WJ & Bloch RJ (2010). Quantitative measurement of Ca2+ in the sarcoplasmic reticulum lumen of mammalian skeletal muscle. Biophys J 99, 2705–2714. [DOI] [PMC free article] [PubMed] [Google Scholar]