Abstract
Mycobacterium tuberculosis disrupted in a 13-gene operon (mce1) accumulates free mycolic acids (FM) in its cell wall and causes accelerated death in mice. Here, to more comprehensively analyze differences in their cell wall lipid composition, we used an untargeted metabolomics approach to compare the lipid profiles of wild-type and mce1 operon mutant strains. By liquid chromatography-mass spectrometry, we identified >400 distinct lipids significantly altered in the mce1 mutant compared to wild type. These lipids included decreased levels of saccharolipids and glycerophospholipids, and increased levels of alpha-, methoxy- and keto mycolic acids (MA), and hydroxyphthioceranic acid. The mutant showed reduced expression of mmpL8, mmpL10, stf0, pks2 and papA2 genes involved in transport and metabolism of lipids recognized to induce proinflammatory response; these lipids were found to be decreased in the mutant. In contrast, the transcripts of mmpL3, fasI, kasA, kasB, acpM and RV3451 involved in MA transport and metabolism increased; MA inhibits inflammatory response in macrophages. Since the mce1 operon is known to be regulated in intracellular M. tuberculosis, we speculate that the differences we observed in cell wall lipid metabolism and composition may affect host response to M. tuberculosis infection and determine the clinical outcome of such an infection.
Keywords: M. tuberculosis, mce1 operon, lipidomics
We compared cell wall lipids of bacteria that cause TB and found that changes in these lipids are regulated by genes previously shown be associated with infection outcomes in mice.
Graphical Abstract Figure.
We compared cell wall lipids of bacteria that cause TB and found that changes in these lipids are regulated by genes previously shown be associated with infection outcomes in mice.
INTRODUCTION
In 2013, more than 8 million new cases of tuberculosis (TB) and 1 million deaths were estimated to occur globally (WHO 2013). Exposure to Mycobacterium tuberculosis, the etiologic agent of TB, results in immediate clearance, establishment of latent TB infection (LTBI), rapidly progressive disease or reactivation disease after a period of LTBI. Some of these outcomes may result from host's responses to cell wall reorganization M. tuberculosis during a course of an infection. Here, we examined a mutant of M. tuberculosis shown previously to undergo profound structural changes in its cell wall during growth. Mycobacterium tuberculosis contains four homologous copies of an operon called mce1-4, which resemble ATP-binding cassette transporters possibly involved in lipid importation (Cole et al. 1998; Casali and Riley 2007; Pandey and Sassetti 2008). Disruption of one of these operons (mce1) renders this mutant hypervirulent in mice (Shimono et al. 2003; Lima et al. 2007). The mce1 operon mutant is unable to induce a strong Th1 type T-cell immune response and organized granuloma formation in lungs (Shimono et al. 2003). Dunphy et al. (2010) showed that the mutant is diminished in growth in minimal medium supplied with mycolic acid (MA) as the sole carbon source but not with other fatty acids. Cantrell et al. (2013) and Forrellad et al. (2014) reported that M. tuberculosis disrupted in the mce1 operon accumulates several-fold greater amount of free MA in its cell wall compared to wild-type M. tuberculosis. Both groups suggested that the operon may encode an importer system to recycle MA released from M. tuberculosis as they die in vivo (Cantrell et al. 2013; Forrellad et al. 2014). Furthermore, Sequeira, Senaratne and Riley (2013) showed that MA can inhibit TLR-2-mediated proinflammatory response in RAW 264.7 cells as well as in human lung epithelial cells (A549). Taken together, these observations suggest that the mce1 operon is somehow involved in remodeling M. tuberculosis cell wall that has a dampening effect on proinflammatory response in mice that is associated with rapid progression to death (Shimono et al. 2003; Lima et al. 2007).
Here, we used an untargeted metabolomics approach to more comprehensively compare the cell wall lipid species of wild-type vs mce1 mutant strains of M. tuberculosis. We performed global profiling of M. tuberculosis lipids to determine if we could identify cell wall composition differences that could potentially explain the host immunopathologic response differences we previously observed in mice infected with these strains.
METHODS
Growth and maintenance of Mycobacterial strains
The following bacterial strains were used: wild-type M. tuberculosis, mce1 operon mutant and complemented strain. The construction of the mce1 operon mutant as well as its complemented strain was previously described (Shimono et al. 2003). The M. tuberculosis strains were grown in Middlebrook 7H9 broth (Difco, MD) containing 10% ADC (Beckton-Dickinson, MD) and 0.2% glycerol (Fisher Scientific, NJ). These liquid cultures were grown at 37°C until saturation.
Lipid extraction for LC-MS
Mycobacterial cultures were grown for 14 days to stationary phase (OD600 > 1.8) in five tissue culture flasks each containing 30 ml of 7H9 (without Tween) and 10% ADC. To extract lipids, we pelleted the culture and resuspended 100 mg of the pellet of each strain in 3 ml of chloroform:methanol (2:1) plus 1 ml of phosphate-buffered saline (pH 7.4). Dodecylglycerol (10 nmol) and pentadecanoic acid (PDA) (10 nmol) internal standards were then added to the solution. Organic and aqueous layers were separated by centrifugation at 1000 × g for 5 min and the organic layer was collected, dried down under N2 and dissolved in 120 μl chloroform.
Metabolomic profiling
Metabolites were chromatographically separated by liquid chromatography as previously described (Benjamin et al. 2013). MS detection in positive and negative ionization modes was performed on 10 μl of resuspended lipids injected onto the HPLC-MS with an electrospray ionization (Schlesinger, Hull and Kaufman 1994) source on an Agilent 6430 QQQ LC-MS/MS. The capillary voltage was set to 3.0 kV. The drying gas temperature was 350°C, the drying gas flow rate was 10 L min−1 and the nebulizer pressure was 35 psi.
We performed an untargeted LC-MS analysis by scanning a mass range of m/z 50–1200 and data were exported as mzdata files and uploaded to XCMS Online (xcmsserver.nutr.berkeley.edu) (Tautenhahn et al. 2012b) to identify molecular features (defined as retention time [RT], mass-to-charge ratio [m/z], and peak intensity detected in quintuplicate for wild type and triplicate for mce1 operon mutant) that differed significantly between the lipid samples extracted from wild type vs the mce1 operon mutant and complemented M. tuberculosis strains.Chemical names of lipid species based on the features from untargeted analysis were putatively identified via the METLIN online (Tautenhahn et al. 2012a) and MycoMass databases. Then lipid species identities were confirmed by analysis of molecular features performed with an ESI source on an Agilent 6520 Accurate-Mass QTOF LC-MS on technical replicates of samples previously analyzed by untargeted LC-MS (Layre et al. 2011b).
The ppm tolerance for the accurate mass measurements was within 5 ppm. Standards for MAs (Sigma-Aldrich) and phosphatidylethanolamines (Avanti Polar Lipids) were used to confirm accurate mass and coelution of the standard with the metabolite of interest. Standards were mixed in chloroform and analysis was performed with an ESI source on an Agilent 6520 Accurate-Mass QTOF LC-MS. Quantitation was performed based on extracted ion chromatograms from the MS data of samples analyzed in untargeted mode on metabolites with identity confirmed by QTOF analysis. Metabolite ions were quantified by integrating the area under the peak, which was then normalized to the PDA internal standard to control for extraction efficiency. Metabolites were then expressed as fold-change of ion abundance in mce1 operon mutant relative to wild type. Samples run for untargeted analysis were analyzed once each for biological quintuplets (wild-type and complemented strain) or triplicate (mce1 operon mutant).
RNA preparation and real-time quantitative PCR (RT-qPCR)
DNA-free RNA was extracted from 30 ml of 7-day-old cultures of M. tuberculosis (wild type, Δmce1), according to a standard Trizol RNA extraction protocol supplied by Invitrogen (Invitrogen, Life Technologies). Briefly, 30 ml of cultures were harvested by centrifugation at 4300 rpm for 20 min. The cell pellet was resuspended in 2 ml of Trizol reagent and transferred to a 2-ml screw-cap microcentrifuge tube containing 0.1-mm-diameter zirconium beads. Cells were disrupted with a FastPrep-24 bead-beater for 45 s at a speed of 6 m s−1. The beating was done three times with 2 min ice incubations between beating runs. Total RNA was then extracted from the cells following the manufacturer's instructions. Extracted RNA was treated with DNase (Qiagen) to ensure that no DNA was present in the samples.
DNA-free RNA (500 ng) was mixed with 50 ng of random hexamers (Invitrogen) in 20 μl of final volume and reverse-transcribed to total cDNA with Superscript III reverse transcriptase (Invitrogen) following the manufacturer's recommendations. Identical reactions containing the same amount of RNA and lacking reverse transcriptase were also performed to confirm the absence of genomic DNA in all samples.
As targets of RT-qPCR, we selected 14 genes encoding products reported in the literature and Tuberculist to be involved in the metabolism and transport of the lipids found in this study to be significantly fold altered between the two M. tuberculosis strains (Belisle et al. 1997; Jackson et al. 1999; Behr et al. 2000; Converse et al. 2003; Matsunaga et al. 2004; Mougous et al. 2004; Ojha et al. 2005; Takayama, Wang and Besra 2005; Kumar et al. 2007, Hatzios et al. 2009, Biswas et al. 2013). The primers were designed to produce a 100–195 bp amplicon for each gene. The sigA gene was used as an internal control. Q-PCR reactions were performed with 25 ng of total cDNA previously generated and the Maxima SYBR Green/ROX qPCR Master Mix (2X) (Fermentas) according to manufacturer's instructions. Relative changes in the gene expression between the mce1 operon mutant and wild type were calculated according to the method of analysis previously described (Livak and Schmittgen 2001).
RESULTS
Comparative lipidomic analysis of M. tuberculosis wild-type, mce1 operon mutant and complemented strains
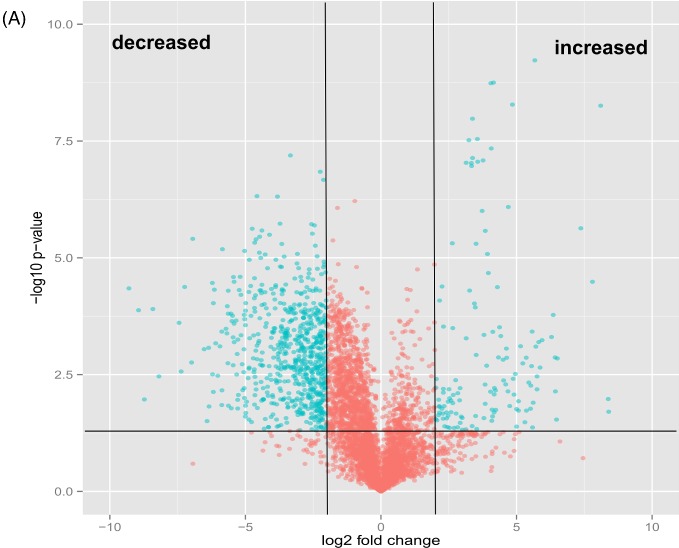
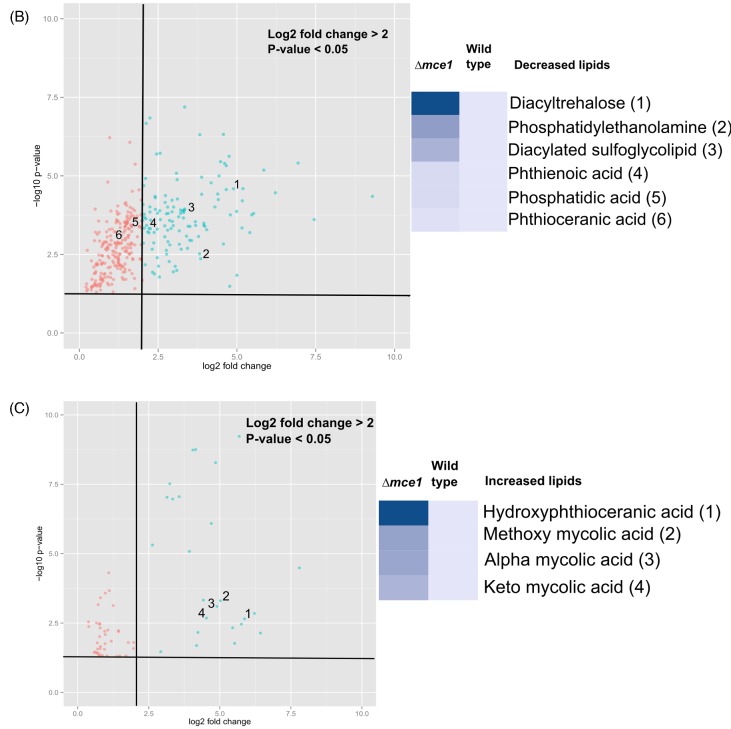
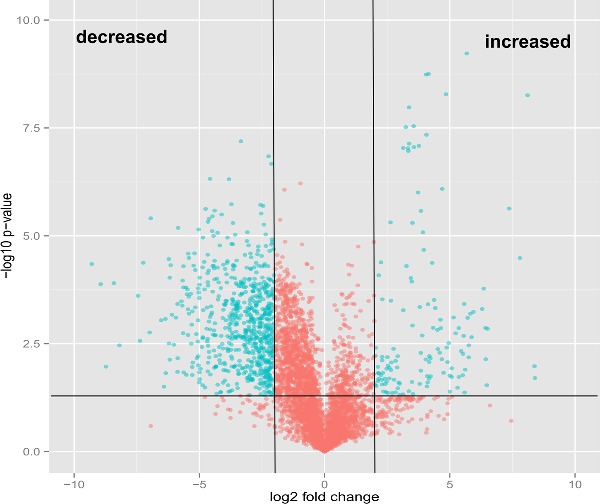
We used an unbiased, untargeted LC-MS platform to broadly compare difference in metabolite abundance in lipids extracted from mce1 mutant, its complement and wild-type M. tuberculosis cultures grown in vitro. We then used the bioinformatics platform XCMS (Tautenhahn et al. 2012b) to identify, align, integrate and compare the molecular features of each group acquired in the negative and positive ionization mass-spectrometry mode (Supplementary data S1A-D). We found 5559 raw features to be altered in the mce1 operon mutant compared to the wild-type M. tuberculosis (Fig. 1a). We further manually processed the XCMS-generated dataset for noise filtering, peak quality and isotopomers, which yielded a final list of 410 distinct metabolite mass-to-charge ratios (m/z) that were significantly altered in levels in the mce1 mutant compared to wild type. Of these, 346 were decreased (Fig. 1b) and 64 were increased (Fig. 1c) in the mutant strain, compared to wild type.
Figure 1.
Comparative lipidomics analysis of M. tuberculosis mce1 operon mutant vs wild-type Erdman strains. The green dots represent metabolites with fold-change > 2 and P-value < 0.05. (A) Volcano plot comparative analysis of 5559 molecular features shown to be increased or decreased in level; (B) lipid profile of 346 features and heatmap of the highest fold-changed acyl forms of the identified lipids that are decreased; (C) lipid profile of 64 features and heatmap of the highest fold-changed acyl forms of the identified lipids are increased. Each dot represents results of analysis of five replicates samples. Only the lipid species depicted in the heatmap were normalized to the PDA internal standard. The numbers in parenthesis refer to the dot in the volcano plot.
Figure 1.
– continued
Identification of altered M. tuberculosis lipid species
To gain more detailed information on identity of the lipid metabolites detected by our untargeted platform, we employed high-resolution quantitative time-of-flight (QTOF) LC-MS to analyze the samples initially run on our untargeted LC-MS platform. We then used these high-resolution MS data to confirm the molecular features, including m/z, of our final list and used the MycoMass database (Layre et al. 2011b) to identify specific lipid species based on these features.
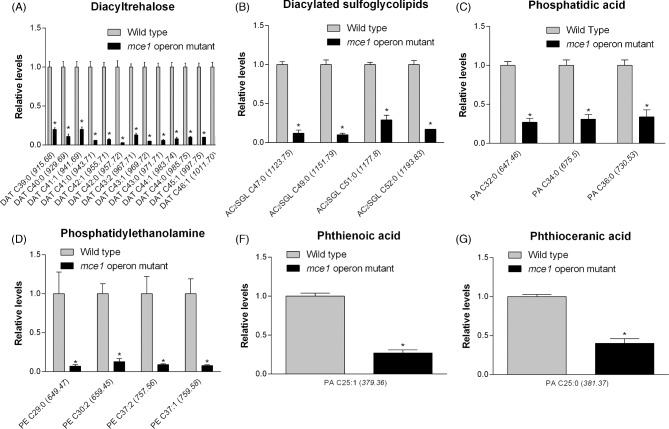
Cell wall lipids that were characteristically decreased in level in the mutant strain were ascribed to lipid categories that included saccharolipids, glycerophospholipids, and the fatty acyl phthienoic and phthioceranic acids (Fig. 2). In the diacyltrehalose (DAT) subclass belonging to the saccharolipid category, the ion chromatogram intensities were lower in levels by 5- to 29.7-fold in the mutant strain in 13 of 107 possible acyl forms (Fig. 2a). In the saccharolipid family we identified 4 acyl forms of 23 possible diacylated sulfoglycolipids (Ac2SGL), well described in reference (Layre et al. 2011a), that were lowered in levels by 3.4- to 9.9-fold in the mce1 operon mutant (Fig. 2b). Among glycerophospholipids, phosphatidic acid levels were reduced by 3- to 3.7-fold (Fig. 2c) and 4 of 128 phosphatidylethanolamine species were lowered in levels by 7.6 to 15-fold (Fig. 2d) in the mce1 operon mutant. The levels of two fatty acids, phthienoic acid and phthioceranic acid, in the mutant were reduced by 3.8- and 2.5-fold, respectively (Figs 2e and f). Except for phosphatidylethanolamine, all other species were detected in negative mode.
Figure 2.
Lipid species that were decreased in the mce1 mutant compared to wild-type M. tuberculosis. Bar graphs of relative levels of acyl forms of identified lipids that are significantly decreased in M. tuberculosis mutant strain relative to wild type are shown. Data in bar graphs are presented as mean ± SEM; n = 3–5/group. Each lipid species is labeled as acyl length:number of unsaturation (m/z). Significance is presented as * P < 0.05 compared to wild type.
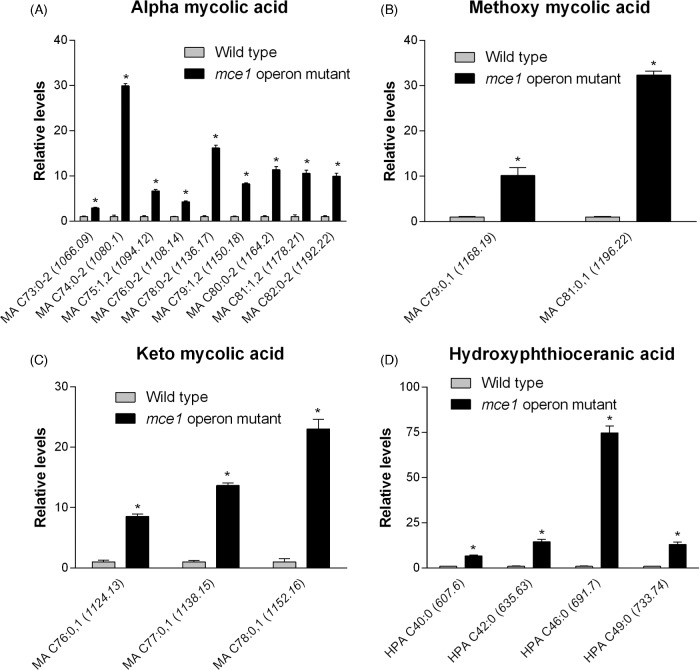
The molecular features of metabolites that increased in level in the mutant that we were able to identify are shown in Fig. 3. They included 14 of 32 possible MA species (Fig. 3a–c), which were confirmed based on standards by QTOF LC-MS and by validating molecular features against initial untargeted analysis and the MycoMass database. QTOF LC-MS analysis also allowed the confirmation of 4 of 18 possible alkyl forms of hydroxyphthioceranic acid (HPA), all elevated in the mce1 operon mutant strain (Fig. 3d). Two other metabolites that increased by 8.2- and 20.7-fold in the mce1 operon mutant strain were putatively identified in XCMS as triacylglycerol but they could not be validated by QTOF LC-MS analysis (data not shown). Of the species identified, only triacylglycerol was detected in positive mode.
Figure 3.
Lipid species that were increased in the mce1 mutant compared to wild-type M. tuberculosis. Bar graphs of relative levels of acyl forms of identified lipids that are significantly increased in M. tuberculosis mutant strain relative to wild type are shown. Data in bar graphs are presented as mean ± SEM; n = 3–5/group. Each lipid species is labeled as acyl length:number of unsaturation (m/z). Significance is presented as * P < 0.05 compared to wild type.
The chemical names of other lipid species that increased or decreased in level in the mutant could not be determined.
Except for phthienoic, phthioceranic and phosphatidic acids, all other lipids that were lowered or increased in level in the mce1 operon mutant showed only residual or no alteration in the complemented strain (Tables S1 and S2, Supporting Information).
Changes in expression of selected M. tuberculosis gene transcripts involved in lipid metabolism and transport
Based on our observations from these lipidomic analyses, we compared the transcriptional profiles of selected M. tuberculosis genes involved in lipid metabolism and transport in the mce1 operon mutant vs the wild-type strain (Fig. 4). Genes involved in MA anabolism (Takayama, Wang and Besra 2005) that included fas I, kasA, kasB and acpM were, respectively, 3.8-, 2.8-, 2- and 2.4-fold upregulated in the mutant relative to the wild-type strain. Also, the mmpL3 that encodes an inner membrane protein transporter of trehalose monomycolate (TMM) (Grzegorzewicz et al. 2012) was increased 2-fold. A hydrolase encoded by RV3451 that releases MA from trehalose dimycolate (TDM) (Yang et al. 2014) was increased 1.8-fold. On the other hand, the expression of RV0494, a member of the GntR/FadR family of regulators, was decreased 6.7-fold in the mutant. This gene has been described as a transcriptional regulator which binds to its operator domain upstream of the kas operon (Biswas et al. 2013). The gene tgs1 involved in synthesis of triacylglycerol (Sirakova et al. 2006), increased 1.9-fold in the mutant compared to the wild type (Fig. 4).
Figure 4.
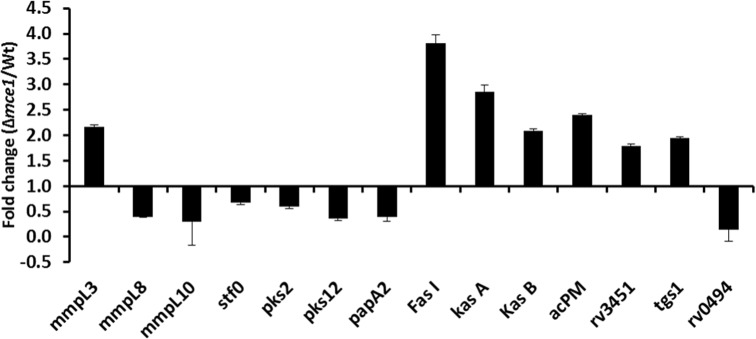
RT-PCR analysis of selected M. tuberculosis genes recognized to be involved in lipid metabolism and transport. Fold-difference in gene expression levels in the mce1 operon mutant relative to wild-type M. tuberculosis from 7-day old cultures is shown. Data in bar graphs are presented as mean ± SD; n = 3/group. Gene expression was normalized to the sigA gene.
We also examined the relative expression of the genes reported to be involved in the synthesis and transport of sulfolipid-1 (SL-1) based on our LC-MS observation that diacylated sulfoglycolipids (Ac2SGL) decreased in the mutant (Fig. 4). Expression of genes pks2, stf0 and papA2 that are reported to be involved in the biosynthesis of SL-1 (Sirakova et al. 2001; Mougous et al. 2004; Kumar et al. 2007) was decreased (1.7-, 1.5- and 2.6-fold, respectively) in the mutant. Finally, the expression of SL-1 transporter gene mmpL8 and the DAT transporter gene mmpL10 also decreased in the mutant (2.6- and 3.4-fold, respectively).
DISCUSSION
We compared cell wall lipid profiles of two isogenic strains of M. tuberculosis, in which one was mutated in an operon that is putatively involved in long-chain fatty acid transport (Dunphy et al. 2010). This analysis followed the guideline for comparative M. tuberculosis lipidomics described by Layre et al. that suggested this approach as a way to provide unbiased, statistically valid comparisons of lipid changes that may occur among strains of mycobacteria during different phases of their infection in a host (Layre et al. 2011b). The mutant causes accelerated death in mice and is unable to stimulate a Th1-type immune response (Shimono et al. 2003; Lima et al. 2007). The lung pathology observed in mice infected with this mutant is characterized by poorly formed granulomas with aberrant migration of pro-inflammatory cells. Subsequent studies have shown that the operon is regulated by a GntR-family transcription factor Mce1R, involved in lipid metabolism (Haydon and Guest 1991; Dirusso and Black 2004; Casali and Riley 2007). Casali, White and Riley (2006) discovered that the mce1 operon is repressed by Mce1R when the wild-type M. tuberculosis is intracellular. In fact, in mouse lungs, the wild-type M. tuberculosis does not express any of the mce1 operon gene products before 8 weeks of infection, suggesting that during the early phase of infection, the wild-type strain may undergo a metabolic state exhibited by the mce1 operon mutant we observed in vitro (Uchida et al. 2007). Although we have no evidence, we speculate that the cell wall lipid changes we found in the mutant may occur in the wild-type strain during its natural course of infection that may exert a modulatory host response as described below.
Dunphy et al. (2010) disrupted fadD5, one of the genes in the mce1 operon that encodes a fatty acyl-coenzyme A synthetase, and showed that this mutant is diminished in growth in minimal medium supplied with MA as the sole carbon source, but not with other long-chain fatty acids. Cantrell et al. (2013) and Forrellad et al. (2014) independently found that the mce1 operon mutant contained several-fold greater amount of MA unattached to any carbohydrate substrates in the cell wall compared to the wild type. This observation led both groups to suggest that the mce1 operon may serve as an importer of MA to recycle these fatty acids released from M. tuberculosis as they die (Dunphy et al. 2010). Sequeira, Senaratne and Riley (2013) reported that free MA as well as the mutant can inhibit proinflammatory response in RAW 264.7 macrophage cells and human alveolar epithelial cells A549 in a TLR-2-dependent manner. These observations together demonstrate that the cell wall lipid changes in M. tuberculosis exert a profound effect on host immunopathologic response.
Here, we confirmed the increased abundance of MA, reported by Cantrell et al. (2013) and Forrellad et al. (2014), but also revealed more than 400 other lipids to be significantly altered in the mutant that were not detected previously. Of the lipid species we identified using the MycoMass lipidomics database, we were able to confirm the increased levels of fatty acyl category of lipids that included all three forms of MA. The upward expression of free MA in the mutant is consistent with the observation that the genes involved in MA biosynthesis (fas I, kas A, kas B and acPM), transport (mmpL3) and TDM hydrolysis (Rv3451) that releases MA from TDM were all upregulated (Yang et al. 2014) (Fig. 4).
The increased abundance of HPA in the mce1 mutant is a new observation. HPA comprises one of polydeoxypropionate arms coupled to the trehalose sugar core of Ac2SGL and SL-1 (Converse et al. 2003; Layre et al. 2011a). The other arm is phthioceranic acid, which we found to decrease in the mutant strain (although the decrease was not significant and a similar alteration was observed in complemented strain (Fig. 1b and Table S1, Supporting Information). The synthesis of SL-1 precursor Ac2SGL requires sulfotransferase Stf0, acyltransferases PapA1 and PapA2, and polyketide synthase Pks2 (Sirakova et al. 2001; Mougous et al. 2004; Kumar et al. 2007). The inner membrane transporter MmpL8 is believed to flip Ac2SGL across the plane of the cell membrane, allowing it to be further modified into mature SL-1 before it is delivered to the outer leaflet of the cell wall (Converse et al. 2003). Biosynthesis of SL-1 is completed by acylation of Ac2SGL by phthioceranic acid and HPA groups (Mougous et al. 2004). Here, we found that four acyl forms of Ac2SGL were altered downward in the mutant (Figs 1b and 2b), which is supported by our observation of the downregulation of the genes that encode the SL-1 precursor biosynthesis (pks2, stf0, papA2) and transport (mmpL8) (Fig. 4). With the decrease in the substrate Ac2SGL, HPA may accumulate in the mycobacterial cell wall. Ac2SGLs as well as SL-1 are potent antigens capable of eliciting interferon-γ production in CD1b-restricted T-cell subsets in TB patients (Gilleron et al. 2004). The diminished proinflammatory response in mice or RAW macrophages associated with the mutant infection (Shimono et al. 2003; Sequeira, Senaratne and Riley 2013) is consistent with the downward alteration of this category of saccharolipids.
Several acyl forms of DAT were lowered in the mutant strain (Fig. 2a) which is consistent with the downregulation of mmpL10 that encodes a transporter of DAT (Domenech, Reed, and Barry 2005; Hatzios et al. 2009) (Fig. 4). Poly, tri and some forms of DAT are potent inhibitors of leukocyte migration in vitro (Saavedra et al. 2001) and also inhibit the proliferation of murine T cells in vitro (Saavedra et al. 2001). The lower amounts of these lipids in the mce1 operon mutant are again consistent with the lung pathology results we observed in mice infected with the mutant, which were characterized by diffusedly organized granulomas with aberrant migration of inflammatory cells (Shimono et al. 2003; Lima et al. 2007).
Phthiocerol dimycocerosate (PDIM) and triacylglycerol (Galagan et al.) expression can also change when M. tuberculosis is exposed to stressful conditions (Sirakova et al. 2006; Galagan et al. 2013). Mycobacterium tuberculosis deficient in PDIM is attenuated in mice and becomes more susceptible to host effector molecules (Cox et al. 1999; Rousseau et al. 2004; Day et al. 2014). TAGs were not validated by QTOF LC-MS analysis and the m/z of PDIM ranges from 1213 to 1563, which precluded us from accurately confirming their changes in mce1 operon mutant. Nevertheless, we found that the genes involved in PDIM (pks12) and TAG synthesis (tgs1) were decreased 2.8-fold and increased 2-fold, respectively, in the mutant strain.
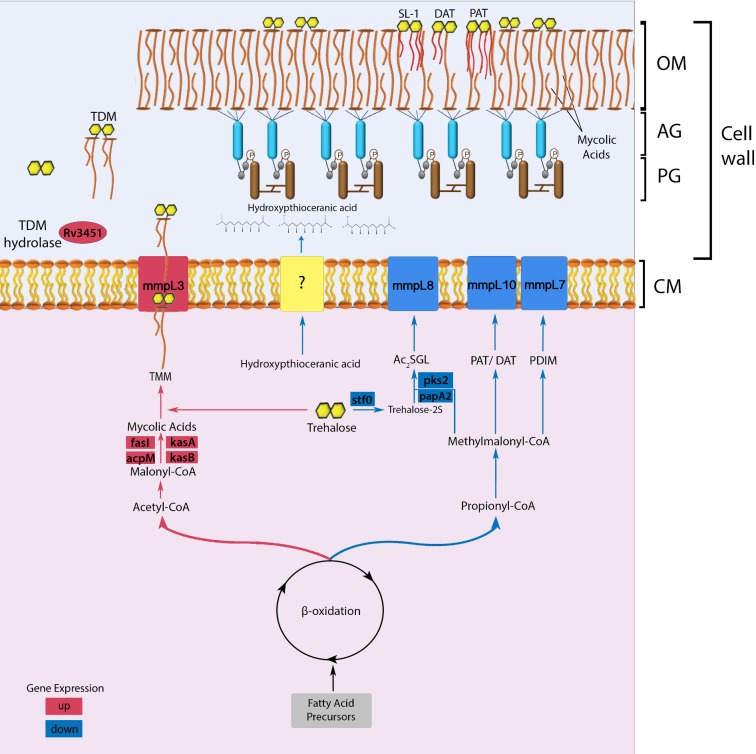
The intriguing question that arises from these results is the relationship of the M. tuberculosis mce1 operon to the changes of more than 400 lipids in the mutant compared to the wild type. Since the operon is not expressed in the wild type during the first 4–8 weeks of infection in mice (Uchida et al. 2007), it is possible that the mutant lipid profiles we found in vitro may be exhibited in vivo. Mycobacterium tuberculosis primarily uses fatty acid substrates during the chronic phase of infection (Munoz-Elias and McKinney 2005). The beta-oxidation cycle degrades fatty acids into acetyl-CoA and propionyl-CoA (Munoz-Elias and McKinney 2005). If indeed, the mce1 operon is involved in MA import as suggested by Dunphy et al. (2010), the prolonged absence of any external carbon source when the mce1 operon is under repression in the wild type (by Mce1R) may serve as a signal to increase the synthesis of MA via the acetyl-CoA/malonyl-CoA pathway (Takayama, Wang and Besra 2005). During this nutrient-limited state, M. tuberculosis may dampen the host's proinflammatory response by downregulating the propionyl-CoA/methylmalonyl-CoA pathway involved in the synthesis of proinflammatory lipids such as SL-1, while increasing the synthesis of MA, which has an anti-inflammatory effect (Munoz-Elias and McKinney 2005; Sequeira, Senaratne and Riley 2013). In the mutant, the beta-oxidation cycle appears to favor the acetyl-CoA pathway, as evidenced by decreased levels of precursors of SL-1, DAT and PDIM, with a concomitant increase in the levels of MA (proposed model depicted in Fig. 5).
Figure 5.
Proposed model of cell wall lipid reorganization in M. tuberculosis. The beta-oxidation cycle of M. tuberculosis has two pathways that lead to the synthesis of either acetyl-CoA/malonyl CoA or propionyl-CoA/methylmalonyl-CoA (Munoz-Elias and McKinney 2005). The synthesis of these metabolites is determined according to cytoplasmic availability of fatty acid precursors. In wild-type M. tuberculosis, the mce1 operon (a putative MA importer) is repressed during the first 4–8 weeks of infection in mice (Uchida et al. 2007), or when the organism is intracellular (Casali, White and Riley 2006). During this period, the acetyl-CoA pathway may be favored, which causes gradual free mycolate (FM) accumulation on the bacterial surface (Cantrell et al. 2013) with a block in MA import (indicated in red) (Dunphy et al. 2010), while diacylated sulfoglycolipid (Ac2SGL), poly and diacyltrehalose (PAT/DAT) and phthiocerol dimycocerosates (PDIM) export decreases (indicated in blue). The cell wall thickened with excess FM allows M. tuberculosis to resist host effector cells and molecules. However, the thickened cell wall also limits nutrient uptake, which eventually triggers a starvation response, which will induce the mce1 operon to be turned on and M. tuberculosis to synthesize the MA transporter in the inner membrane to import MA from its surface back into the cytoplasm (Dunphy et al. 2010). The imported MA degraded in the cytoplasm enters the propionyl CoA/methylmalonyl CoA synthetic pathway that will favor transport of proinflammatory lipids to the bacterial surface and bacterial replication. Although we have no evidence that these lipid changes actually occur in vivo, we hypothesize that these lipid changes in the cell wall may induce different host responses that determine clinical outcome of an infection. The rapid progression to death in mice infected with the mce1 operon mutant (Shimono et al. 2003), which is constitutively diminished in its ability to import FM (Dunphy et al. 2010), is an example of a clinical outcome that may be due to the cell wall lipid changes in this mutant. (AG: arabinogalactan layer; PG: peptidoglycan layer; CM: cytoplasmic membrane; SL-1: sulfoglycolipid-1; TMM: trehalose monomycolate; TDM: trehalose dimycolate).
We found many other altered lipids in the mce1 operon mutant that could not be identified further in the MycoMass database. They most likely play a role in M. tuberculosis’s adaptive lifestyle in its host that serves both as its natural habitat and disease target.
Supplementary Material
Acknowledgments
We thank Elizabeth Min-jung Cho for the graphics artwork performed for this paper.
FUNDING
This work was supported in part by a grant from the National Institute of Allergy and Infectious Disease (R01AI073204) and Fogarty International Center (TW006885) of the National Institute of Health. AQ was the recipient of a Brazilian Ministry of Health Science-without-Borders fellowship.
SUPPLEMENTARY DATA
Conflict of interest. None declared.
REFERENCES
- Behr MA, Schroeder BG, Brinkman JN, et al. A point mutation in the mma3 gene is responsible for impaired methoxymycolic acid production in Mycobacterium bovis BCG strains obtained after 1927. J Bacteriol. 2000;182:3394–9. doi: 10.1128/jb.182.12.3394-3399.2000. [DOI] [PMC free article] [PubMed] [Google Scholar]
- Belisle JT, Vissa VD, Sievert T, et al. Role of the major antigen of Mycobacterium tuberculosis in cell wall biogenesis. Science. 1997;276:1420–2. doi: 10.1126/science.276.5317.1420. [DOI] [PubMed] [Google Scholar]
- Benjamin DI, Cozzo A, Ji X, et al. Ether lipid generating enzyme AGPS alters the balance of structural and signaling lipids to fuel cancer pathogenicity. P Natl Acad Sci USA. 2013;110:14912–7. doi: 10.1073/pnas.1310894110. [DOI] [PMC free article] [PubMed] [Google Scholar]
- Biswas RK, Dutta D, Tripathi A, et al. Identification and characterization of Rv0494: a fatty acid-responsive protein of the GntR/FadR family from Mycobacterium tuberculosis. Microbiology. 2013;159:913–23. doi: 10.1099/mic.0.066654-0. [DOI] [PubMed] [Google Scholar]
- Cantrell SA, Leavell MD, Marjanovic O, et al. Free mycolic acid accumulation in the cell wall of the mce1 operon mutant strain of Mycobacterium tuberculosis. J Microbiol. 2013;51:619–26. doi: 10.1007/s12275-013-3092-y. [DOI] [PubMed] [Google Scholar]
- Casali N, Riley LW. A phylogenomic analysis of the Actinomycetales mce operons. BMC Genomics. 2007;8:60. doi: 10.1186/1471-2164-8-60. [DOI] [PMC free article] [PubMed] [Google Scholar]
- Casali N, White AM, Riley LW. Regulation of the Mycobacterium tuberculosis mce1 operon. J Bacteriol. 2006;188:441–9. doi: 10.1128/JB.188.2.441-449.2006. [DOI] [PMC free article] [PubMed] [Google Scholar]
- Cole ST, Brosch R, Parkhill J, et al. Deciphering the biology of Mycobacterium tuberculosis from the complete genome sequence. Nature. 393:537–44. doi: 10.1038/31159. [DOI] [PubMed] [Google Scholar]
- Converse SE, Mougous JD, Leavell MD, et al. MmpL8 is required for sulfolipid-1 biosynthesis and Mycobacterium tuberculosis virulence. P Natl Acad Sci USA. 2003;100:6121–6. doi: 10.1073/pnas.1030024100. [DOI] [PMC free article] [PubMed] [Google Scholar]
- Cox JS, Chen B, McNeil M, et al. Complex lipid determines tissue-specific replication of Mycobacterium tuberculosis in mice. Nature. 1999;402:79–83. doi: 10.1038/47042. [DOI] [PubMed] [Google Scholar]
- Day TA, Mittler JE, Nixon MR, et al. Mycobacterium tuberculosis strains lacking surface lipid phthiocerol dimycocerosate are susceptible to killing by an early innate host response. Infect Immun. 2014;82:5214–22. doi: 10.1128/IAI.01340-13. [DOI] [PMC free article] [PubMed] [Google Scholar]
- Dirusso CC, Black PN. Bacterial long chain fatty acid transport: gateway to a fatty acid-responsive signaling system. J Biol Chem. 2004;279:49563–6. doi: 10.1074/jbc.R400026200. [DOI] [PubMed] [Google Scholar]
- Domenech P, Reed MB, Barry CE., 3rd Contribution of the Mycobacterium tuberculosis MmpL protein family to virulence and drug resistance. Infect Immun. 2005;73:3492–501. doi: 10.1128/IAI.73.6.3492-3501.2005. [DOI] [PMC free article] [PubMed] [Google Scholar]
- Dunphy KY, Senaratne RH, Masuzawa M, et al. Attenuation of Mycobacterium tuberculosis functionally disrupted in a fatty acyl-coenzyme A synthetase gene fadD5. J Infect Dis. 2010;201:1232–9. doi: 10.1086/651452. [DOI] [PMC free article] [PubMed] [Google Scholar]
- Forrellad MA, McNeil M, Santangelo Mde L, et al. Role of the Mce1 transporter in the lipid homeostasis of Mycobacterium tuberculosis. Tuberculosis. 2014;94:170–7. doi: 10.1016/j.tube.2013.12.005. [DOI] [PMC free article] [PubMed] [Google Scholar]
- Galagan JE, Minch K, Peterson M, et al. The Mycobacterium tuberculosis regulatory network and hypoxia. Nature. 2013;499:178–83. doi: 10.1038/nature12337. [DOI] [PMC free article] [PubMed] [Google Scholar]
- Gilleron M, Stenger S, Mazorra Z, et al. Diacylated sulfoglycolipids are novel mycobacterial antigens stimulating CD1-restricted T cells during infection with Mycobacterium tuberculosis. J Exp Med. 2004;199:649–59. doi: 10.1084/jem.20031097. [DOI] [PMC free article] [PubMed] [Google Scholar]
- Grzegorzewicz AE, Pham H, Gundi VA, et al. Inhibition of mycolic acid transport across the Mycobacterium tuberculosis plasma membrane. Nat Chem Biol. 2012;8:334–41. doi: 10.1038/nchembio.794. [DOI] [PMC free article] [PubMed] [Google Scholar]
- Hatzios SK, Schelle MW, Holsclaw CM, et al. PapA3 is an acyltransferase required for polyacyltrehalose biosynthesis in Mycobacterium tuberculosis. J Biol Chem. 2009;284:12745–51. doi: 10.1074/jbc.M809088200. [DOI] [PMC free article] [PubMed] [Google Scholar]
- Haydon DJ, Guest JR. A new family of bacterial regulatory proteins. FEMS Microbiol Lett. 1991;63:291–5. doi: 10.1016/0378-1097(91)90101-f. [DOI] [PubMed] [Google Scholar]
- Jackson M, Raynaud C, Laneelle MA, et al. Inactivation of the antigen 85C gene profoundly affects the mycolate content and alters the permeability of the Mycobacterium tuberculosis cell envelope. Mol Microbiol. 1999;31:1573–87. doi: 10.1046/j.1365-2958.1999.01310.x. [DOI] [PubMed] [Google Scholar]
- Kumar P, Schelle MW, Jain M, et al. PapA1 and PapA2 are acyltransferases essential for the biosynthesis of the Mycobacterium tuberculosis virulence factor sulfolipid-1. P Natl Acad Sci USA. 2007;104:11221–6. doi: 10.1073/pnas.0611649104. [DOI] [PMC free article] [PubMed] [Google Scholar]
- Layre E, Paepe DC, Larrouy-Maumus G, et al. Deciphering sulfoglycolipids of Mycobacterium tuberculosis. J Lipid Res. 2011a;52:1098-110. doi: 10.1194/jlr.M013482. [DOI] [PMC free article] [PubMed] [Google Scholar]
- Layre E, Sweet L, Hong S, et al. A comparative lipidomics platform for chemotaxonomic analysis of Mycobacterium tuberculosis. Chem Biol. 2011b;18:1537–49. doi: 10.1016/j.chembiol.2011.10.013. [DOI] [PMC free article] [PubMed] [Google Scholar]
- Lima P, Sidders B, Morici L, et al. Enhanced mortality despite control of lung infection in mice aerogenically infected with a Mycobacterium tuberculosis mce1 operon mutant. Microbes Infect. 2007;9:1285–90. doi: 10.1016/j.micinf.2007.05.020. [DOI] [PMC free article] [PubMed] [Google Scholar]
- Livak KJ, Schmittgen TD. Analysis of relative gene expression data using real-time quantitative PCR and the 2(-Delta Delta C(T)) Method. Methods. 2001;25:402–8. doi: 10.1006/meth.2001.1262. [DOI] [PubMed] [Google Scholar]
- Matsunaga I, Bhatt A, Young DC, et al. Mycobacterium tuberculosis pks12 produces a novel polyketide presented by CD1c to T cells. J Exp Med. 2004;200:1559–69. doi: 10.1084/jem.20041429. [DOI] [PMC free article] [PubMed] [Google Scholar]
- Mougous JD, Petzold CJ, Senaratne RH, et al. Identification, function and structure of the mycobacterial sulfotransferase that initiates sulfolipid-1 biosynthesis. Nat Struct Mol Biol. 2004;11:721–9. doi: 10.1038/nsmb802. [DOI] [PubMed] [Google Scholar]
- Munoz-Elias EJ, McKinney JD. Mycobacterium tuberculosis isocitrate lyases 1 and 2 are jointly required for in vivo growth and virulence. Nat Med. 2005;11:638–44. doi: 10.1038/nm1252. [DOI] [PMC free article] [PubMed] [Google Scholar]
- Ojha A, Anand M, Bhatt A, et al. GroEL1: a dedicated chaperone involved in mycolic acid biosynthesis during biofilm formation in mycobacteria. Cell. 2005;123:861–73. doi: 10.1016/j.cell.2005.09.012. [DOI] [PubMed] [Google Scholar]
- Pandey AK, Sassetti CM. Mycobacterial persistence requires the utilization of host cholesterol. P Natl Acad Sci USA. 2008;105:4376–80. doi: 10.1073/pnas.0711159105. [DOI] [PMC free article] [PubMed] [Google Scholar]
- Rousseau C, Winter N, Pivert E, et al. Production of phthiocerol dimycocerosates protects Mycobacterium tuberculosis from the cidal activity of reactive nitrogen intermediates produced by macrophages and modulates the early immune response to infection. Cell Microbiol. 2004;6:277–87. doi: 10.1046/j.1462-5822.2004.00368.x. [DOI] [PubMed] [Google Scholar]
- Saavedra R, Segura E, Leyva R, et al. Mycobacterial di-O-acyl-trehalose inhibits mitogen- and antigen-induced proliferation of murine T cells in vitro. Clin Diagn Lab Immun. 2001;8:1081–8. doi: 10.1128/CDLI.8.6.1081-1088.2001. [DOI] [PMC free article] [PubMed] [Google Scholar]
- Schlesinger LS, Hull SR, Kaufman TM. Binding of the terminal mannosyl units of lipoarabinomannan from a virulent strain of Mycobacterium tuberculosis to human macrophages. J Immunol. 1994;152:4070–9. [PubMed] [Google Scholar]
- Sequeira PC, Senaratne RH, Riley LW. Inhibition of toll-like receptor 2 (TLR-2)-mediated response in human alveolar epithelial cells by mycolic acids and Mycobacterium tuberculosis mce1 operon mutant. Pathog Dis. 2013;70:132–40. doi: 10.1111/2049-632X.12110. [DOI] [PMC free article] [PubMed] [Google Scholar]
- Shimono N, Morici L, Casali N, et al. Hypervirulent mutant of Mycobacterium tuberculosis resulting from disruption of the mce1 operon. P Natl Acad Sci USA. 2003;100:15918–23. doi: 10.1073/pnas.2433882100. [DOI] [PMC free article] [PubMed] [Google Scholar]
- Sirakova TD, Dubey VS, Deb C, et al. Identification of a diacylglycerol acyltransferase gene involved in accumulation of triacylglycerol in Mycobacterium tuberculosis under stress. Microbiology. 2006;152:2717–25. doi: 10.1099/mic.0.28993-0. [DOI] [PMC free article] [PubMed] [Google Scholar]
- Sirakova TD, Thirumala AK, Dubey VS, et al. The Mycobacterium tuberculosis pks2 gene encodes the synthase for the hepta- and octamethyl-branched fatty acids required for sulfolipid synthesis. J Biol Chem. 2001;276:16833–9. doi: 10.1074/jbc.M011468200. [DOI] [PubMed] [Google Scholar]
- Takayama K, Wang C, Besra GS. Pathway to synthesis and processing of mycolic acids in Mycobacterium tuberculosis. Clin Microbiol Rev. 2005;18:81–101. doi: 10.1128/CMR.18.1.81-101.2005. [DOI] [PMC free article] [PubMed] [Google Scholar]
- Tautenhahn R, Cho K, Uritboonthai W, et al. An accelerated workflow for untargeted metabolomics using the METLIN database. Nat Biotechnol. 2012a;30:826–8. doi: 10.1038/nbt.2348. [DOI] [PMC free article] [PubMed] [Google Scholar]
- Tautenhahn R, Patti GJ, Rinehart D, et al. XCMS Online: a web-based platform to process untargeted metabolomic data. Anal Chem. 2012b;84:5035–9. doi: 10.1021/ac300698c. [DOI] [PMC free article] [PubMed] [Google Scholar]
- Uchida Y, Casali N, White A, et al. Accelerated immunopathological response of mice infected with Mycobacterium tuberculosis disrupted in the mce1 operon negative transcriptional regulator. Cell Microbiol. 2007;9:1275–83. doi: 10.1111/j.1462-5822.2006.00870.x. [DOI] [PubMed] [Google Scholar]
- WHO. Global Tuberculosis Report 2013. Geneva: WHO; 2013. [Google Scholar]
- Yang Y, Kulka K, Montelaro RC, et al. A hydrolase of trehalose dimycolate induces nutrient influx and stress sensitivity to balance intracellular growth of Mycobacterium tuberculosis. Cell Host Microbe. 2014;15:153–63. doi: 10.1016/j.chom.2014.01.008. [DOI] [PMC free article] [PubMed] [Google Scholar]
Associated Data
This section collects any data citations, data availability statements, or supplementary materials included in this article.


