

Spatial and genotypic clustering of Mycobacterium tuberculosis isolates were evaluated in a high-tuberculosis-incidence setting to unmask locations where new transmissions of tuberculosis were occurring; such an approach could be used to implement more targeted tuberculosis control and prevention programs.
Keywords: tuberculosis, molecular epidemiology, transmission, spatial analysis
Abstract
Background. Genotyping Mycobacterium tuberculosis isolates allows study of dynamics of tuberculosis transmission, while geoprocessing allows spatial analysis of clinical and epidemiological data. Here, genotyping data and spatial analysis were combined to characterize tuberculosis transmission in Vitória, Brazil, to identify distinct neighborhoods and risk factors associated with recent tuberculosis transmission.
Methods. From 2003 to 2007, 503 isolates were genotyped by IS6110 restriction fragment length polymorphism (RFLP) and spoligotyping. The analysis included kernel density estimation, K-function analysis, and a t test distance analysis. Mycobacterium tuberculosis isolates belonging to identical RFLP patterns (clusters) were considered to represent recent tuberculosis infection (cases).
Results. Of 503 genotyped isolates, 242 (48%) were categorized into 70 distinct clusters belonging to 12 RFLP families. The proportion of recent transmission was 34.2%. Kernel density maps indicated 3 areas of intense concentration of cases. K-function analysis of the largest RFLP clusters and families showed they co-localized in space. The distance analysis confirmed these results and demonstrated that unique strain patterns (controls) randomly distributed in space. A logit model identified young age, positive smear test, and lower Index of Quality of Urban Municipality as risk factors for recent transmission. The predicted probabilities for each neighborhood were mapped and identified neighborhoods with high risk for recent transmission.
Conclusions. Spatial and genotypic clustering of M. tuberculosis isolates revealed ongoing active transmission of tuberculosis caused by a small subset of strains in specific neighborhoods of the city. Such information provides an opportunity to target tuberculosis transmission control, such as through rigorous and more focused contact investigation programs.
Despite progress in reducing tuberculosis incidence, 8.6 million cases and 1.3 million deaths occurred globally in 2012 [1]. To achieve the World Health Organization's proposed goal of 75% detection of cases and 85% cure by 2015, detailed studies of local epidemiological characteristics of tuberculosis patients and associated risk factors are needed in different regions of the world [2, 3].
Genotyping serves to investigate dynamics of tuberculosis transmission. Patients whose Mycobacterium tuberculosis isolates share identical DNA fingerprints are considered to belong to clusters representing recent transmission, whereas cases caused by unique genotype strains are more likely to represent endogenous reactivation [4, 5].
Several population-based molecular epidemiologic studies of ongoing tuberculosis transmission have been conducted, but 80% of new tuberculosis cases globally occur in 22 high-burden countries [1], where these types of studies are underrepresented [5–7].
Although the Brazilian Ministry of Health implemented a new policy incorporating a tuberculosis control program (TCP) in family health units in 2004 [8, 9], Brazil still reports an average incidence of new cases of tuberculosis of 46 per 100 000 per year [1]. In Vitória, a large urban setting and capital of Espírito Santo state, the average incidence in the last decade was higher, at 51 per 100 000 [10]. This may be related to a variety of factors including delay in diagnosis and poor contact investigation strategies. In Vitória, most patients with newly diagnosed tuberculosis are referred to 1 of 2 tuberculosis clinics, where they are followed for treatment. Approximately 50% of the tuberculosis patients in the city are under a directly observed therapy–short course program. Household contact investigation is done in approximately 80% of cases. Despite these programs, a delay of an average of 110 days in the diagnosis of tuberculosis after symptom onset was reported in Vitória [11].
New cases of tuberculosis in a neighborhood could represent reactivation from a past infection or rapidly progressive disease from a recent transmission. For tuberculosis control, it is important to know not just when, but also where patients were infected. Research to evaluate the spatial distribution of tuberculosis and identify high-risk areas has been conducted [12–16], but such studies are still limited in high-burden countries [17]. Most of the reported spatial distribution studies did not combine genotyping and geocoding data to assess if the cases of tuberculosis in a neighborhood represented recent infection or reactivation tuberculosis.
Here, we combined genotyping data with spatial analysis to characterize tuberculosis transmission in Vitória from 2003 to 2007, by identifying distinct geographic areas and associated risk factors of recent transmission. This information is essential to design more focused tuberculosis control strategies in high-risk populations and interpret chain of transmission in areas of high endemicity.
METHODS
Ethics Statement
This study was part of a larger project that was approved by the Institutional Review Board of Universidade Federal do Espírito Santo, Brazil, under number 121/06.
Study Design and Site
The study included all newly diagnosed patients confirmed to have tuberculosis by culture, reported from January 2003 to December 2007, among residents of Vitória, Espírito Santo State, Brazil. Vitória has a population of 330 000 and an area of 93 381 km2, divided between an island and mainland sections. The city is comprised of 78 municipalities (neighborhoods), with a population density that varies from 6.18 per km2 to 236.01 per km2 (Supplementary Material).
Demographic and clinical data were obtained from the Sistema de Informação de Agravos de Notificação national database and the Instituto Brasileiro de Geografia e Estatística 2000 census. Individual-level variables included sex, age, ethnic group, chest radiograph, form of disease, human immunodeficiency virus infection, and sputum smear result. Socioeconomic variables were summarized by neighborhood according to census and included number of households earning more than or less than US$1500 (10 minimum salaries) per month; heads of household earnings per month; number of heads of household earning up to US$75 (half a minimum salary); number of households owned by their residents; number of households connected to sewage; number of households with electricity; urbanized area; Index of Quality of Urban Municipality (IQU) as defined by Maciel et al [15]; and population density.
Genotyping Methods
Sputum cultures for tuberculosis diagnosis are done routinely by the Mycobacteriology Laboratory at Núcleo de Doenças Infecciosas, Universidade Federal do Espírito Santo, and M. tuberculosis isolates are stored for further investigation and epidemiologic surveillance. Mycobacterium tuberculosis isolates stored at −70°C were recultured in Ogawa media, and all viable isolates were typed by the insertion sequence (IS) 6110 restriction fragment length polymorphism (RFLP) method according to a standard protocol [18]. Banding pattern results were entered into a database with Bionumerics software (version 4.5 [2005], Applied Maths, Belgium), and cluster analysis was performed by unweighted pair group method with arithmetic mean. A cluster was defined as an indistinguishable IS6110 RFLP electrophoretic band pattern. RFLP profiles with similarity of >80% (generally differing by 1 or 2 bands) were considered members of the same “family” [19]. Fingerprint patterns that were distinctly different from any other pattern identified among the isolates studied were considered unique or nonclustered patterns.
Isolates with <5 IS6110 copies were considered to belong to cluster or noncluster strains based on spoligotyping results. For spoligotyping, primers designated DRa and DRb were used to amplify the whole direct repeat region as described previously [20].
The recent transmission rate was estimated by the “n-1 method” [5], according to the formula (T(c) – n(c))/T(a), where T(c) is the total number of clustered isolates, n(c) is the number of clusters, and T(a) is the total number of isolates.
Statistical Analysis
Patients were divided into 2 groups: Patients infected with cluster strains were defined as cases; patients infected with noncluster strains were defined as controls. The former group was considered to have recent transmission tuberculosis, whereas the latter was considered to have reactivation tuberculosis. Univariate analyses were conducted to identify risk factors for recent transmission tuberculosis by χ2, Fisher exact, and Student t tests, based on the variables considered. All variables that were significantly associated with cases (P ≤ .05) were included in a multivariate analysis. The statistical analysis was carried out using SAS software version 12.1 and R software version 3.0.2 (The R Foundation for Statistical Computing).
Spatial Analysis
We conducted spatial analysis with the genotype data to identify geographic clusters of transmission among cases and controls. Residential addresses at the time of diagnosis were geocoded by ArcGIS (Esri, Redlands, California), and surveillance records were reviewed to avoid misclassification. As this is one of the first attempts to conduct spatial analysis on M. tuberculosis genotypes, 3 approaches were used: kernel density estimation (KDE) for the locations of cases and controls; a K-function on predicted estimates from a random-effects logit model, and a t test distance analysis.
KDEs are used to provide a nonparametric approach that compares the observed number of events occurring within a given distance of an event to the expected number. A Gaussian kernel function was used for this study.
The second approach began by fitting a multivariate logit model with a random neighborhood effect to predict presence of a cluster. The neighborhood random effect was output, which represents the effect of unmeasured covariates at the neighborhood level. In theory, these effects should exhibit zero spatial autocorrelation, whereas correlation would imply clustering at the neighborhood level. Spatial correlation of the neighborhood effects were tested using nonhomogeneous K-function [21]. Because of the higher impact in the transmission chain of the disease, the 5 largest genotype clusters were chosen for this spatial analysis.
Two additional tests were conducted to evaluate spatial clustering of RFLP families: an additional K-function and a distance analysis. To conduct these tests, we first output the centroid of each cluster and then computed distances (in meters) from each RFLP family member to the cluster center. Then, the mean distances among all patients in each of the RFLP families were compared to the mean distance among the patients in the control group by t test. A significant difference in distances would indicate that RFLP families tend to cluster spatially.
A logit model with random neighborhood effects was used to evaluate univariate and multivariate associations. Only significant variables were considered for the multivariate model. Model selection involved inclusion of all covariates and sequentially removing covariates that did not contribute to model fit. The random effect for each neighborhood was output for each neighborhood, which is the estimated log-odds (logit) of being in a cluster, with positive values indicating higher odds. The log odds were converted into a predicted probability with the formula prob = 1/(1 + exp(-RE)), and this value was mapped.
RESULTS
From 1 January 2003 to 31 December 2007, 836 cases of tuberculosis were reported in Vitória, with M. tuberculosis isolated from 534 (64%). Of these 534 cases, 31 (6%) patients were excluded—17 had nonviable isolates for strain type analysis and 14 had 2 isolates with an identical IS6110 RFLP pattern in different years—resulting in a total of 503 patients. The average age of the patients was 38.2 years (range, 1–88 years), and 356 (70.7%) were males; 242 patients (48.1%) met the criteria for recent-transmission tuberculosis based on their M. tuberculosis genotype. These patients were infected with strains that were categorized into 70 distinct clusters ranging in size from 2 to 17 per cluster: 37 small clusters (52.9%) with 2 cases each, 29 medium clusters (41.4%) with 3–8 cases each, and 4 large clusters (5.7%) with ≥9 cases each. All clusters were grouped into 12 RFLP families; 4 of these comprised 54.9% of the clustered isolates (Supplementary Material). Two hundred sixty-one patients (51.9%) had unique pattern isolates. However, 147 (56.3%) of them had fingerprint patterns that were >80% similar to one of the identified clusters, suggesting that they might belong to related lineages (RFLP family).
The proportion of cases attributable to recent transmission was estimated to be 34% (172/503). The proportion of household transmission, based on cluster pattern strains isolated in the same household, was 5.7% (29/503).
The kernel density map of clustered strains shows 3 areas with the highest predicted concentration of cases in the west, center, and southwest areas of the city (Figure 1A). These neighborhoods all share common tuberculosis risk factors: low income, slums, and overcrowding. When the kernel map is compared to a map showing the ratio of empirical Bayesian estimates of cases and controls, there is strong agreement in the identification of where tuberculosis transmission risk is highest (Figure 1B).
Figure 1.
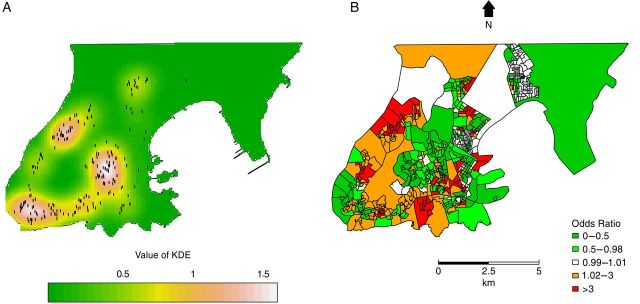
Kernel density estimation (KDE) map of clustered strains (A) and empirical Bayesian odds ratio estimates (cases:controls) (B). A, The white color represents areas with the most intense concentration of clustered strains (dots). Bayesian analysis was made on a census tract scale whereas the kernel densities used points.
K-function analyses of the largest clusters (ES14, ES14o, ES1b, ES19h, and ES8) are seen in Figure 2. The x-axis represents interpoint distances; the y-axis shows the K-value. Results indicate evidence for positive spatial correlation (clustering) for each of the clusters as the K-function falls outside the estimated confidence bands for nonspatial correlation.
Figure 2.

K-function analysis of the largest clusters: ES19h (A), ES14 (B), ES14o (C) ES1b (D), and ES8 (E). The x-axis represents interpoint distances, and the y-axis represents the K-value. The dotted lines are the 95% confidence envelope of complete spatial randomness, whereas the solid line shows the actual values obtained. Values above the confidence envelope indicate positive spatial correlation (clustering) among cases; values below it indicate nonspatial correlation.
To evaluate whether the related RFLP families (ES14, ES1, ES19, and ES8) also exhibited spatial clustering, we identified isolates with RFLP patterns that were >80% similar to the patterns of the largest clusters and performed an additional K-function analysis. The K-function results suggested that the cases in RFLP families were also spatially clustered (Figure 3). The distance analysis also showed there was no statistically significant difference between the distances of identical cases and families to the centroid, except for cluster ES19h. However, distances between cases in each family to the centroid statistically differed from distances between patients in the control group. These results imply that although both identical and family strains tend to cluster in space, nonfamily strains representing possible reactivation tuberculosis cases do not occur in the same geographic locations (Table 1).
Figure 3.

K-function analysis of the largest restriction fragment length polymorphism families: ES19 (A), ES14 (B), ES1 (C), and ES8 (D). The x-axis represents interpoint distances; the y-axis represents the K-value. The dotted lines are the 95% confidence envelope of complete spatial randomness, whereas the solid line shows the actual values obtained. Values above the confidence envelope indicate positive spatial correlation (clustering) among cases; values below it indicate nonspatial correlation.
Table 1.
Average Distances Between Residential Geocoded Addresses for Controls, Restriction Fragment Length Polymorphism Families, and Clusters
| Groups Compared | P Value* | Average Distance (Meters) |
|
|---|---|---|---|
| RFLP Family | Control | ||
| Distance between points in each RFLP family and the points of controls | |||
| RFLP family ES14 and controls | .00 | 3242 | 3566 |
| RFLP family ES1 and controls | .00 | 3225 | 3566 |
| RFLP family ES19 and controls | .00 | 4326 | 3566 |
| RFLP family ES8 and controls | .00 | 2249 | 3566 |
| P Value | Cluster Original | RFLP Family | |
| Distance of points from each group in relation to the original cluster centroid | |||
| RFLP family ES14 and cluster ES14 | .74 | 2325 | 2410 |
| RFLP family ES1 and cluster ES1b | .75 | 2485 | 2425 |
| RFLP family ES19 and cluster ES19h | .00 | 1878 | 3214 |
| RFLP family ES8 and cluster ES8 | .66 | 1243 | 1478 |
| RFLP family ES14 and cluster ES14o | .23 | 2165 | 2726 |
Abbreviation: RFLP, restriction fragment length polymorphism.
* For P values <.05, the hypothesis of equal mean distances was rejected.
A logit model with random neighborhood effects was used to evaluate univariate and multivariate associations with having an M. tuberculosis isolate that was member of an RFLP cluster. Univariate analyses identified young age, black race, chest radiograph suspicious for tuberculosis, positive sputum microscopy test, low IQU, population density, households connected to sewage, and number of people aged 20–34 years who are literate to be associated with having an M. tuberculosis isolate that was a member of an RFLP cluster. The final multivariate model identified 4 variables to be more associated with being in a cluster: young age (10–19 and 20–34 years); positive sputum microscopy test; lower IQU; and lower population density (however, population density appears to have a curvilinear relationship) (Supplementary Material). The estimated log-odds (logit) of being in a cluster were converted to predicted probabilities for each neighborhood and mapped to demonstrate the variability in risk (Figure 4).
Figure 4.

Estimated predicted probabilities of tuberculosis recent transmission per neighborhood. In most of the neighborhoods where the predicted probability of clustering is >0.55, the largest restriction fragment length polymorphism families (ES19, ES14, ES1, and ES8) represent the majority of cases.
DISCUSSION
The proportion of new cases of tuberculosis due to recent transmission in a community is a reflection of the effectiveness of a current TCP in that community. High recent transmission tuberculosis incidence is indicative of an inadequate TCP [1, 22].
In this study, a high proportion of RFLP genotype clustering was found (48.1%). A meta-analysis study [7] described a large variation in clustering proportions, from 6% to 86%, among 46 studies, while Fok et al [6] described proportions of recent transmission that ranged from 4% to 60% with a median of 28% among 35 studies. However, these studies did not examine the spatial distribution of the genotypes to identify neighborhoods representing high rates of ongoing tuberculosis transmission.
Here, we found that a large proportion (55%) of clustered M. tuberculosis isolates belonged to only 4 major cluster pattern families. Also, 56% of the unique pattern strains had patterns that were >80% similar to those of other cluster pattern strains. Recently transmitted bacteria may also be reported as unique strains if M. tuberculosis genotype changed over time [23]. The half-life of RFLP genotypes has been estimated to vary between 3 and 10 years in certain situations [24, 25]. Although specific epidemiologic links could not be detected within our study groups, these findings suggest that the incidence of tuberculosis in this region may be strongly influenced by a relatively small subset of actively circulating strains. It is known that in areas with a higher incidence of tuberculosis, RFLP patterns are often less variable than in low-incidence areas [26]. The same observation was made in São Paulo by Ferrazoli et al [27]. For this reason, our spatial analysis included isolates from RFLP families.
Kernel analysis clearly shows 3 high-density areas with the highest proportion of persons infected with genotypically clustered strains; these areas also have the highest ratio of empirical Bayesian estimates of cases and controls, confirming that these are the areas with a higher risk of recent tuberculosis transmission. Also, K-function analysis shows that RFLP clusters and families tend to cluster geographically whereas control strains do not, being more randomly distributed.
By distance analysis, it was possible to determine mean distances of approximately 2000 m among cases, suggesting that, although most of the time transmission does not occur in the household, it occurs in a larger but delimited area. A previous study in a high-incidence Western Cape area has confirmed that tuberculosis is not transmitted primarily within households [28], which was also observed in our study. Our genotyping data indicated that household transmission was responsible for only 5.7% of the cases.
Collectively, our data demonstrate that tuberculosis transmission in Vitoria is spatially determined and that recent transmission most frequently occurs among younger adults, in those with positive sputum microscopy test and low IQU. Furthermore, our study shows that new tuberculosis cases do not just cluster in space as previously shown by Maciel et al [15], but that certain M. tuberculosis lineages tend to cluster even after controlling for known individual and socioeconomic factors that can influence transmission. This could mean that tuberculosis is most likely transmitted within spatially defined areas of poverty with poor housing and sanitation conditions. Another explanation could be that spatial clustering is a proxy for social networks. People are likely to be in a social network within their neighborhood, which is typically fluid across an urban area. The network likely breaks down by economic or racial barriers as one moves across an urban landscape (ie, people within poor neighborhoods are likely interacting and participating in similar activities, but as one moves from one block to a neighboring, more wealthy block, the ties between rich and poor households tend to collapse). Therefore, once an M. tuberculosis lineage enters a social network, that particular strain and its related family strains are more likely to propagate and remain in that network than other strains. Due to spatial clustering and limits to the social network, the transmission of the strain is self-limiting—that is, it has lower probability to spread to different parts of the city depending on specific characteristics of who is infected (travel patterns, employment, use of public transportation, etc). Some studies build on the argument that infectious disease transmission is a function of biological and social factors [29–31]. To understand how they are transmitted requires understanding both processes. Our study reveals transmission patterns that are highly spatial and indicates paths that follow distinct social classes.
Apart from genotyping and epidemiologic studies of tuberculosis that revealed social groups frequenting bars, we were not able to identify other studies that examined tuberculosis transmission among social networks based on population-based M. tuberculosis genotyping and geocoding data [28, 32, 33].
Recommendations have been made that the reduction of tuberculosis transmission should be based on locations rather than on personal contacts [34, 35]. Our data can provide a useful instrument for structuring a territory-based surveillance system. Detection of recent-transmission tuberculosis high-density areas can also aid the TCP to direct specific interventions toward those areas at greatest risk.
The restriction of the spatial analysis to residential addresses at diagnosis was a limitation of our study. Transmission can occur in workplaces, social venues, and other settings, which we could not identify. Also, although persons with culture-negative tuberculosis seldom transmit infection, the absence of genotyping data from those individuals means that transmission to them cannot be assessed, which can lead to an underestimation of recent transmission [36]. However, as we genotyped 96.8% of our culture-positive cases, we believe our findings to reflect the actual patterns of tuberculosis transmission in the city.
Some of the strengths of this study were its 5-year duration and the high percentage of genotyped isolates from patients living in a clearly defined study area. It is known that the size of clustering depends on study duration, which increases with longer duration until a plateau is reached after about 4 years [37–39], and that a small sample size and a poorly defined area can underestimate clustering proportions [7].
CONCLUSIONS
Case-finding strategies of TCPs are generally based on identifying people with tuberculosis-related symptoms when they seek care at primary health clinics and screening household contacts of confirmed cases. Our results suggest a possibility for implementing a new case-finding strategy based on screening populations in neighborhoods with high-density recent-transmission tuberculosis and social network analyses. In this context, the linkage of geocoding and genotyping data is a powerful tool to improve targeted tuberculosis control and prevention programs, especially in developing countries with high tuberculosis incidence.
Supplementary Data
Supplementary materials are available at Clinical Infectious Diseases online (http://cid.oxfordjournals.org). Supplementary materials consist of data provided by the author that are published to benefit the reader. The posted materials are not copyedited. The contents of all supplementary data are the sole responsibility of the authors. Questions or messages regarding errors should be addressed to the author.
Notes
Acknowledgments. We acknowledge Hebert Silva Marques and Paola Poloni Lobo de Aguiar for technical laboratory support and Philip Noel Suffys for helping with the spoligotyping data analysis.
Financial support. This work was supported by Conselho Nacional de Desenvolvimento Científico e Tecnológico (CNPq) by Edital Ministério da Ciência, Tecnologia e Inovação/CNPq/MS-SCTIE-DECIT No. 25/2006 and the National institute of Health on the International Clinical, Operational and Health Services Research Training Award (grant number 5 U2R TW006883-02 and ENSP-011-LIV-10-2-3). Travel support for W. P. was provided by the Duke Brazil Initiative.
Potential conflicts of interest. All authors: No potential conflicts of interest.
All authors have submitted the ICMJE Form for Disclosure of Potential Conflicts of Interest. Conflicts that the editors consider relevant to the content of the manuscript have been disclosed.
References
- 1.World Health Organization. Global tuberculosis report 2013. Geneva, Switzerland: WHO, 2014. Available at: http://apps.who.int/iris/bitstream/10665/91355/1/9789241564656_eng.pdf Accessed 10 November 2014. [Google Scholar]
- 2.Stop TB. Partnership: the Global Plan to Stop TB, 2006–2015. Actions for life: towards a world free of tuberculosis. Int J Tuberc Lung Dis 2006; 10:240–1. [PubMed] [Google Scholar]
- 3.Lönnroth K, Castro KG, Chakaya JM, et al. Tuberculosis control and elimination 2010–50: cure, care, and social development. Lancet 2010; 375:1814–29. [DOI] [PubMed] [Google Scholar]
- 4.Van Soolingen D. Molecular epidemiology of tuberculosis and other mycobacterial infections: main methodologies and achievements. J Intern Med 2001; 249:1–26. [DOI] [PubMed] [Google Scholar]
- 5.Nava-Aguilera E, Andersson N, Harris E, et al. Risk factors associated with recent transmission of tuberculosis: systematic review and meta-analysis. Int J Tuberc Lung Dis 2009; 13:17–26. [PubMed] [Google Scholar]
- 6.Fok A, Numata Y, Schulzer M, FitzGerald MJ. Risk factors for clustering of tuberculosis cases: a systematic review of population-based molecular epidemiology studies. Int J Tuberc Lung Dis 2008; 12:480–92. [PubMed] [Google Scholar]
- 7.Houben RM, Glynn JR. A systematic review and meta-analysis of molecular epidemiological studies of tuberculosis: development of a new tool to aid interpretation. Trop Med Int Health 2009; 14:892–909. [DOI] [PubMed] [Google Scholar]
- 8.Ministério da Saúde. Guia para tratamento da tuberculose para o Programa de Saúde da Família. Brasília, Brazil: Ministério da Saúde, 2002. [Google Scholar]
- 9.Conde MB, de Melo FA, Marques AM, et al. III Brazilian Thoracic Association guidelines on tuberculosis. J Bras Pneumol 2009; 35:1018–48. [DOI] [PubMed] [Google Scholar]
- 10.Ministério da Saúde. Sala de Apoio à Gestão Estratégica. Available at: http://189.28.128.178/sage/ Accessed 10 November 2014.
- 11.Maciel EL, Golub JE, Peres RL, et al. Delay in diagnosis of pulmonary tuberculosis at a primary health clinic in Vitoria, Brazil. Int J Tuberc Lung Dis 2010; 14:1403–10. [PMC free article] [PubMed] [Google Scholar]
- 12.Bishai WR, Graham NM, Harrington S, et al. Molecular and geographic patterns of tuberculosis transmission after 15 years of directly observed therapy. JAMA 1998; 280:1679–84. [DOI] [PubMed] [Google Scholar]
- 13.Haase I, Olson S, Behr MA, et al. Use of geographic and genotyping tools to characterise tuberculosis transmission in Montreal. Int J Tuberc Lung Dis 2007; 11:632–8. [PubMed] [Google Scholar]
- 14.Chan-yeung M, Yeh AG, Tam CM, et al. Socio-demographic and geographic indicators and distribution of tuberculosis in Hong Kong: a spatial analysis. Int J Tuberc Lung Dis 2005; 9:1320–6. [PubMed] [Google Scholar]
- 15.Maciel EL, Pan W, Dietze R, et al. Spatial patterns of pulmonary tuberculosis incidence and their relationship to socio-economic status in Vitoria, Brazil. Int J Tuberc Lung Dis 2010; 14:1395–402. [PMC free article] [PubMed] [Google Scholar]
- 16.Munch Z, Van Lill SW, Booysen CN, Zietsman HL, Enarson DA, Beyers N. Tuberculosis transmission patterns in a high-incidence area: a spatial analysis. Int J Tuberc Lung Dis 2003; 7:271–7. [PubMed] [Google Scholar]
- 17.Verver S, Warren RM, Munch Z, et al. Transmission of tuberculosis in a high incidence urban community in South Africa. Int J Epidemiol 2004; 33:351–7. [DOI] [PubMed] [Google Scholar]
- 18.van Embden JD, Cave MD, Crawford JT, et al. Strain identification of Mycobacterium tuberculosis by DNA fingerprinting: recommendations for a standardized methodology. J Clin Microbiol 1993; 31:406–9. [DOI] [PMC free article] [PubMed] [Google Scholar]
- 19.Tenover FC, Arbeit RD, Goering RV. How to select and interpret molecular strain typing methods for epidemiological studies of bacterial infections: a review for healthcare epidemiologists. Molecular Typing Working Group of the Society for Healthcare Epidemiology of America. Infect Control Hosp Epidemiol 1997; 18:426–39. [DOI] [PubMed] [Google Scholar]
- 20.Kamerbeek J, Schouls L, Kolk A, et al. Simultaneous detection and strain differentiation of Mycobacterium tuberculosis for diagnosis and epidemiology. J Clin Microbiol 1997; 35:907–14. [DOI] [PMC free article] [PubMed] [Google Scholar]
- 21.Baddeley A, Møller J, Waagepetersen R. Non-and semi-parametric estimation of interaction in inhomogeneous point patterns. Stat Neerl 2000; 54:329–50. [Google Scholar]
- 22.Tessema B, Beer J, Merker M, et al. Molecular epidemiology and transmission dynamics of Mycobacterium tuberculosis in northwest Ethiopia: new phylogenetic lineages found in northwest Ethiopia. BMC Infect Dis 2013; 13:131. [DOI] [PMC free article] [PubMed] [Google Scholar]
- 23.McNabb SJ, Kammerer JS, Hickey AC, et al. Added epidemiologic value to tuberculosis prevention and control of the investigation of clustered genotypes of Mycobacterium tuberculosis isolates. Am J Epidemiol 2004; 160:589–97. [DOI] [PubMed] [Google Scholar]
- 24.de Boer AS, Borgdorff MW, de Haas PE, Nagelkerke NJ, van Embden JD, van Soolingen D. Analysis of rate of change of IS6110 RFLP patterns of Mycobacterium tuberculosis based on serial patient isolates. J Infect Dis 1999; 180:1238–44. [DOI] [PubMed] [Google Scholar]
- 25.Warren RM, van der Spuy GD, Richardson M, et al. Calculation of the stability of the IS6110 banding pattern in patients with persistent Mycobacterium tuberculosis disease. J Clin Microbiol 2002; 40:1705–8. [DOI] [PMC free article] [PubMed] [Google Scholar]
- 26.van Soolingen D, Hermans PW. Epidemiology of tuberculosis by DNA fingerprinting. Eur Respir J Suppl 1995; 20:649s–56. [PubMed] [Google Scholar]
- 27.Ferrazoli L, Palaci M, Marques LR, et al. Transmission of tuberculosis in an endemic urban setting in Brazil. Int J Tuberc Lung Dis 2000; 4:18–25. [PubMed] [Google Scholar]
- 28.Classen CN, Warren R, Richardson M, et al. Impact of social interactions in the community on the transmission of tuberculosis in a high incidence area. Thorax 1999; 54:136–40. [DOI] [PMC free article] [PubMed] [Google Scholar]
- 29.Giebultowicz S, Ali M, Yunus M, et al. A comparison of spatial and social clustering of cholera in Matlab, Bangladesh. Health Place 2011; 17:490–7. [DOI] [PMC free article] [PubMed] [Google Scholar]
- 30.Emch M, Root ED, Giebultowicz S, et al. Integration and spatial and social network analysis in disease transmission studies. Ann Am Assoc Geogr 2012; 105:1004–15. [DOI] [PMC free article] [PubMed] [Google Scholar]
- 31.Lopez L, Burguerner G, Giovanini L. Addressing population heterogeneity and distribution in epidemics models using cellular automata approach. BMC Res Notes 2014; 7:234. [DOI] [PMC free article] [PubMed] [Google Scholar]
- 32.Kline SE, Hedemark LL, Davies SF. Outbreak of tuberculosis among regular patrons of a neighborhood bar. N Engl J Med 1995; 333:222–7. [DOI] [PubMed] [Google Scholar]
- 33.Klovdahl AS, Graviss EA, Yaganehdoost A, et al. Networks and tuberculosis: an undetected community outbreak involving public places. Soc Sci Med 2001; 52:681–94. [DOI] [PubMed] [Google Scholar]
- 34.Small PM, Hopewell PC, Singh SP, et al. The epidemiology of tuberculosis in San Francisco. A population-based study using conventional and molecular methods. N Engl J Med 1994; 13:1703–9. [DOI] [PubMed] [Google Scholar]
- 35.Barnes PF, Yang Z, Preston-Martin S, et al. Patterns of tuberculosis transmission in central Los Angeles. JAMA 1997; 278:1159–63. [PubMed] [Google Scholar]
- 36.de Vries G, Baars HW, Sebek MM, van Hest NA, Richardus JH. Transmission classification model to determine place and time of infection of tuberculosis cases in an urban area. J Clin Microbiol 2008; 46:3924–30. [DOI] [PMC free article] [PubMed] [Google Scholar]
- 37.Jasmer RM, Hahn JA, Small PM, et al. A molecular epidemiologic analysis of tuberculosis trends in San Francisco, 1991–1997. Ann Intern Med 1999; 130:971–8. [DOI] [PubMed] [Google Scholar]
- 38.Van Soolingen D, Borgdorff MW, de Haas PE, et al. Molecular epidemiology of tuberculosis in the Netherlands: a nationwide study from 1993 through 1997. J Infect Dis 1999; 180:726–34. [DOI] [PubMed] [Google Scholar]
- 39.Glynn JR, Crampin AC, Yates MD, et al. The importance of recent infection with Mycobacterium tuberculosis in an area with high HIV prevalence: a long-term molecular epidemiological study in northern Malawi. J Infect Dis 2005; 192:480–7. [DOI] [PubMed] [Google Scholar]
Associated Data
This section collects any data citations, data availability statements, or supplementary materials included in this article.