


Abstract
To address many challenges in RNA structure/function prediction, the characterization of RNA's modular architectural units is required. Using the RNA-As-Graphs (RAG) database, we have previously explored the existence of secondary structure (2D) submotifs within larger RNA structures. Here we present RAG-3D—a dataset of RNA tertiary (3D) structures and substructures plus a web-based search tool—designed to exploit graph representations of RNAs for the goal of searching for similar 3D structural fragments. The objects in RAG-3D consist of 3D structures translated into 3D graphs, cataloged based on the connectivity between their secondary structure elements. Each graph is additionally described in terms of its subgraph building blocks. The RAG-3D search tool then compares a query RNA 3D structure to those in the database to obtain structurally similar structures and substructures. This comparison reveals conserved 3D RNA features and thus may suggest functional connections. Though RNA search programs based on similarity in sequence, 2D, and/or 3D structural elements are available, our graph-based search tool may be advantageous for illuminating similarities that are not obvious; using motifs rather than sequence space also reduces search times considerably. Ultimately, such substructuring could be useful for RNA 3D structure prediction, structure/function inference and inverse folding.
INTRODUCTION
Besides RNA's traditional biological roles in transcription and translation, recent discoveries have revealed other fundamental roles of RNAs, including catalysis and regulation of gene expression. In particular, non-coding RNAs (ncRNAs) are believed to play essential roles in many cellular functions such as processing of messenger RNAs (1–3), control of protein stability (4) and RNA interference (5). They are implicated in many human diseases including cancer (6,7), infectious and neurodegenerative diseases (8–10), and thus pose targets for disease detection as well as new therapeutic agents.
With the increasing number of RNA structures deposited in the PDB and NDB databases (11,12), development of computational tools to help annotate RNA structures and functions has become crucial. As for proteins, sequence and structural similarities among RNAs can help suggest shared functions. Some programs use multiple sequence alignment to assess sequence similarity and predict function via comparison to sequences of known function (13–15). However, compared with the 20-letter amino-acid code of proteins, the 4-letter nucleotide code of RNAs is less effective in sequence comparison and alignment. A more reliable way to predict the RNA function is based on analysis of structural similarities between RNA substructures and motifs in the structural databases.
Unlike DNA, which forms stable and regular double-stranded helices, RNA is a single-stranded molecule that folds upon itself to form an enormous variety of complex structures possessing a hierarchical organization (16,17). The folded forms are described by double-stranded segments (stems) connected by a variety of loops. The stems are regularly shaped double-stranded helices forming Watson–Crick (WC) type base pairing (AU, CG and GU wobble pairs). The loops are irregular non-WC interactions between nucleotides, such as hairpins, kink-turns (18), sarcin-ricin motifs (19), π-turns (20) and t-loops (21), and many more. These motifs play essential roles in RNA's three-dimensional (3D) shapes, by introducing kinks and turns in the RNA backbone, allowing specific positioning of helices with respect to one another. An understanding of RNA structure-function relationships therefore requires the determination and classification of the tertiary folds of RNAs.
Currently, several databases classify and search for RNA structural motifs. These include RNA FRABASE (22,23), FASTR3D (24) and RNA 3D Motif Atlas (25). RNA FRABASE stores RNA secondary (2D) structure motifs (stems and loops) and their coordinates. FASTR3D utilizes an efficient search of the PDB databank for fragments of 2D structures. The RNA 3D Motif Atlas stores representatives of recurrent RNA 3D motifs (hairpin and internal loops). These tools employ heuristic approaches to search the PDB for fragments of known RNA 3D structures that possess the same 2D structure as the query RNA. However, these programs usually search for RNAs whose 2D structures are identical to the query RNA without allowing insertions or deletions. Thus, RNAs that have the same overall 3D structures but different 2D structures, primary sequences, and/or lengths could be missed; substructural similarities would also not be found.
Other search tools comparing RNA 3D folds, include ARTS (26), R3D-BLAST (27), WebFR3D (28), SARA (29), NASSAM (30) and RNA-Bricks (31). Among them, ARTS and R3D-BLAST are somewhat similar to RAG-3D presented here. ARTS describes RNA molecules with a set of ‘quadrats’ composed by four phosphate atoms of two consecutive base-pairs and uses a bipartite graph to find the maximum number of aligned ‘quadrats’ between two RNA structures, using sequence, 2D and 3D similarity criteria. R3D-BLAST searches the PDB for similar 3D structures. Our comparison of RAG-3D to these two tools (see ‘Results’ section) underscores complementary features of RAG-3D, for example to identify recurring substructural motifs across many RNA structures and understand modular features of these repetitive motifs.
Here we exploit the modular architecture of RNA and the coarse-grained representation of 2D RNAs as graphs to compute 3D building blocks of RNA based on our RNA-As-Graphs (RAG) database (32–35), as recently reviewed (36–38). Specifically, we present a graph-substructuring approach for RNA structural search and classification based on a hierarchical classification of RNA folds. These folds are represented as coarse-grained, tree-graph models, where RNA double-helices are represented as edges (−) and loop domains (hairpins, internal loops, junctions and helices ends) are denoted as vertices (•) (see Figure 1). Thus each RNA 2D structure has a 2D tree graph representation based on the connectivity of its secondary motifs and is associated with a Laplacian matrix L = D − A (see Figures 1 and 2) which describes its connectivity. Here we expand RAG(2D) into 3D graphs, as developed recently (39,40). In contrast to existing databases, RAG not only accounts for traditional secondary structural elements, such as loops and stems, but also provides a catalog of all mathematically possible RNA 2D structures based on graphical enumeration (41). Having such a catalog provides an ‘atlas’ of possible motifs (within the 2D representations). Thus it is possible to recognize, among all possible motifs, those that have been experimentally solved. Furthermore, clustering approaches can be used to propose which motifs, among the hypothetical (i.e. non-existing) candidates, are RNA-like (33). Such suggested motifs have been ‘designed’ in silico (42), and half of them were verified later by experimental methods (35).
Figure 1.
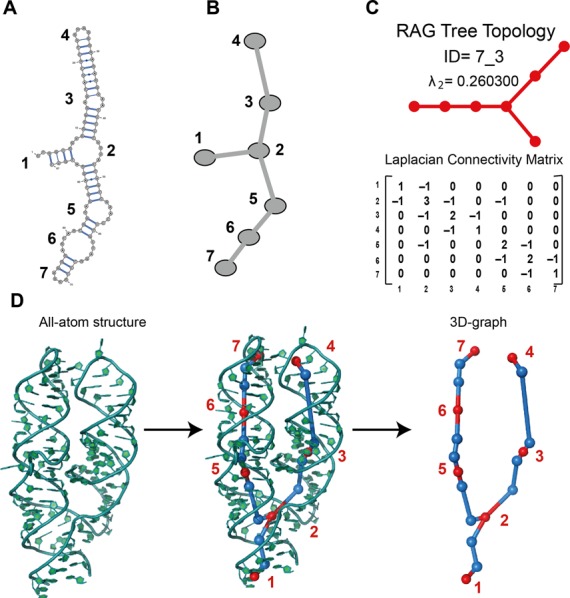
Structure of a 7S.S signal recognition particle (SRP) RNA (PDB ID: 1LNG) with Graph Representation. (A) Secondary structure representation obtained with VARNA (43). (B) Reduced graph representation with edges (–) for RNA double-helices and vertices (•) for loop domains (hairpins, internal loops, junctions and helices ends). (C) Tree topology identification, 7_3 (35), along with second eigenvalue λ2 extracted from the Laplacian matrix. (D) All-atom structure of 1LNG and corresponding 3D-graph. The additional vertices in 3D-graph representation are shown as blue dots.
Figure 2.
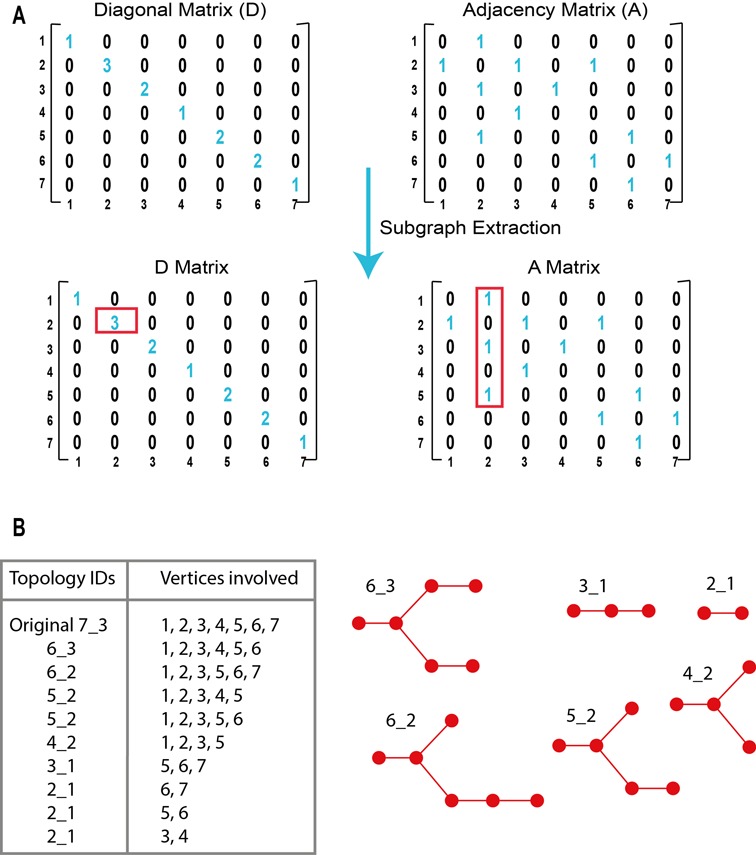
Graph substructuring procedure from linear algebra point of view. (A) Extraction of the subgraphs from the Laplacian matrix of vertices connectivity. (B) List of all subgraphs along with topology IDs and 2D-graph representations.
The advantage of the simplified graph representation approach is a measure of similarity based on the RNA fold derived from the connectivity of the graph. Many problems can be simplified from sequence to motif space because of the smaller size of the latter. Figure 1 illustrates this point for the 7S.S signal recognition particle (SRP) RNA. The secondary structure in Figure 1A shows seven secondary motifs: dangling end (vertex 1), junction (vertex 2), three internal loops (vertices 3, 5 and 6) and two hairpins (vertices 4 and 7). Figure 1B shows the 2D graph representation, where the loop motifs become graph vertices, and the stem regions are edges. The numbering order depends on the sequence order.
In this work we introduce RAG-3D, an extension of the original RAG Database plus a search tool using two additional utilities: a graph partitioning algorithm for a query RNA, so that a user obtains a list of all the subgraphs associated with the query RNA structure; and a tool to extract the coordinates of a 3D graph corresponding to the query RNA fold provided (see Figure 1D). The RAG-3D substructuring permit users to identify which existing RNAs or RNA substructures exhibit similar topology and 3D fold with respect to the query RNA structure. RAG-3D stores PDB IDs, atom coordinates, and 2D and 3D graph information for each RNA structure cataloged. Specifically, there are 36 groups of RNA motifs corresponding to experimentally solved structures cataloged based on their graph topology (see Table 1). Each group contains all RNA structures or substructures having the same 2D graph.
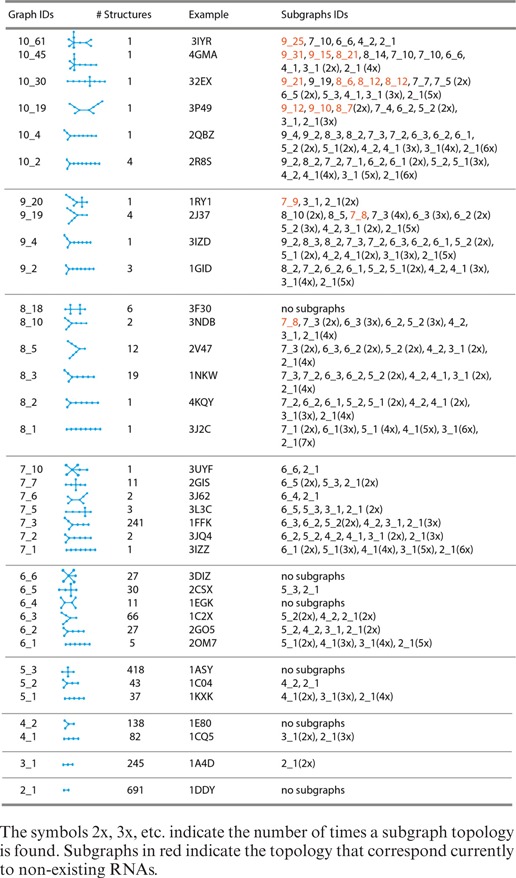
Table 1. List of all graphs and subgraphs reported in RAG-3D.
The 3D graph coordinates may be useful in other applications (e.g. conformational sampling and structure prediction (40)) and can be used to generate atomic models, as we have reported (39). The advantage of our graph theory framework in RAG-3D is a drastic reduction in computational search time by using RNA topology space to search for similarities (computational time ranges from few seconds for small RNAs to few minutes for large systems). Through RAG-3D's substructuring, relationships among RNAs that are otherwise obscure might also emerge. Applications to folding and inverse folding can also be envisioned. The URL link of RAG-3D can be found at http://www.biomath.nyu.edu/RAG3D/.
MATERIALS AND METHODS
In the following subsections we describe the terminology and methods we use for the extraction, analysis and comparison of RNA substructures. Our analysis relies on examination of both secondary and tertiary structures.
Background—RNA topology
To search and analyze tertiary structures of RNA, we extend the discrete 2D topological representation of tree graphs from the 2D level used in RAG database (32–35) to the 3D level. Since tree graphs cannot handle pseudoknots at present, pseudoknots are removed both from the query structure and from the structures in RAG-3D following the Elimination Gain (EG) method (44). Pseudoknots may be treated in the future using dual graphs (35,36,42).
2D graph representation
The RNA tree graphs depict the connectivity of the secondary motifs as illustrated in Figure 1 (32,33). The original (2D) RAG (33,35) defines trees by representing helices (with two or more canonical base pairs) as edges, and loop domains (hairpins, internal loops and junctions) as vertices (32) (Figure 1). This intuitive representation provides the mathematical tools to estimate the RNA structural space as well as to predict unknown motifs (42).
The RAG tree graphs are cataloged by vertex number. Each group of vertices (from 2 to 11, with the largest representing RNAs of ∼240 nt) contains subgroups differing by topology (32). A mathematical representation of the connectivity between vertices is given by a Laplacian Matrix, which is the difference between the Diagonal Matrix D and the Adjacency Matrix A (see Figure 2). The Diagonal Matrix shows along its diagonal the number of connections each vertex makes with the others. The Adjacency Matrix specifies the connections of each vertex. Then, the Laplacian eigenvalue spectra can be used to compare and find structurally similar graphs. Two graphs are said to be isomorphic when they have the same eigenvalue spectrum irrespective of the vertex labels. The eigenvalue λ2 of the Laplacian matrix reflects the overall pattern of connectivity and compactness of a graph and is used to rank RNAs within the group (same number of vertices) by topology Identifiers (IDs) (34). Topology IDs are defined as ‘V_s’, where V is the total number of vertices of the graph, and s is the subgroup number in which all graphs have the same connectivity, i.e. same λ2. In our original RAG database, when a user submits the secondary structure of a query RNA, the Laplacian matrix is calculated and the topology ID is provided (Figure 1C).
The RAG database currently classifies all possible graphs up through 10 vertices (35). The graphs are categorized as existing for experimentally resolved RNAs and hypothetical RNAs for those not yet found. There are 187 enumerated topology motifs in RAG, and 36 of them correspond to existing RNAs up through 10 vertices. The rest of the not-yet-experimentally-found are classified as RNA-like and non-RNA like based on a clustering approach called ‘Partitioning Around Medoids (PAM)’ algorithm (Baba N., Kim N., Elmetwaly S. and Schlick T., in preparation).
3D graph representation
RAG-3D tree graphs have been developed in the context of our method for RNA tertiary topology prediction, RAGTOP (37,39). In RAG-3D tree graphs, the vertices are points in 3D space and the edges are line segments between vertices. Vertices are placed in the loop regions; these are shown in red in Figure 3. In this work, we further incorporate junction feature details to define ‘3D’ graphs as detailed previously (37,40). Thus, vertices are added at the terminal base pairs of a helix to represent helices of different lengths. A central vertex is also added at the center of the junction domain to capture the junction's spatial properties.
Figure 3.
Graph substructuring procedure from fragment library point of view. (A) Calculation of the new Laplacian matrix and its corresponding topology ID of subgraphs made of vertices {1, 2, 3, 5}. (B) Extraction of the 3D-subgraphs and 3D-subfragments of the subgraph {1, 2, 3, 5}. Blue dots represent the additional vertices in 3D-graphs.
We also define additional edges to connect the vertices at the end of helices, and to connect the center of the junction. This 3D graph representation captures properties of the helical organization for any degree of RNA junctions in 3D space (39). A helical element in an RNA junction is defined if at least two consecutive WC base pairs (GC and AU, and GU) are present.
Edges and vertices are obtained from the 3D coordinates of the all-atom structures. We represent each helix by 2 vertices and 1 edge. The 3D coordinates of each vertex are determined in three steps: (i) find the midpoint M of C1′ atoms between the purine (Adenine and Guanine) and pyrimidine (Cytosine and Uracil) of the terminal base pairs of a helix; (ii) consider the orthogonal projection from M on to the line connecting the C8 and C6 atoms of the purine and pyrimidine, respectively; (iii) scale the vector projection by 4 Å (45) (see Figure 1D). This definition for positioning a vertex is applied to both terminal base pairs of a helix. An edge, which is aligned with the axis of the double-helix, is added to connect the two adjacent vertices.
As described in (40), we extend this definition to describe RNA junctions and loops. That is, an n-way junction is translated into 2n edges and 2n + 1 vertices, 2n vertices for n helices and one vertex for a junction centroid; the junction centroid is an average of adjacent vertices Vi (i = 1,...,n). Thus, our 3D graphs contain more vertices than 2D graphs because each helix is represented by one edge and 2 vertices—one at each end (see Figures 1, 3, 7 and S1 of the Supplementary Data).
Figure 7.
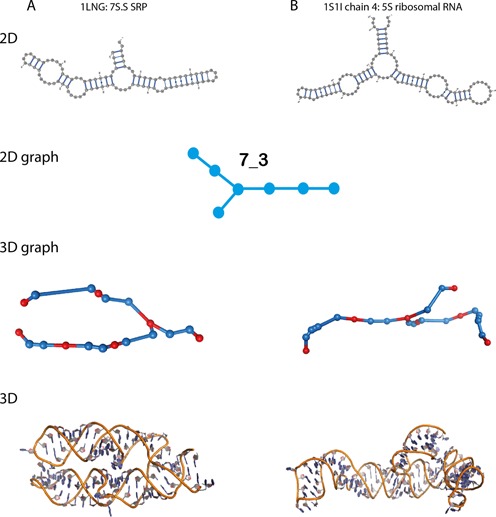
Comparison of different 3D-folds (3D structures and 3D-graphs) of two RNAs with similar 2D structures. (A) Secondary and tertiary folds of 1LNG, a 7S.S SRP. (B) Secondary and tertiary folds of 1S1I chain 4, a 5S ribosomal RNA.
In this work we analyze the subgraphs of all existing RNAs up through 10 vertices (36 motifs) (see Table 1). Note that the same graph topology corresponds to several RNAs. Moreover, some subgraphs of existing RNAs have no known RNAs with the same topology.
Graph partitioning/subgraphs extraction
The initial graph partitioning is performed at the 2D level. Recall that each graph has the topology recorded in its Laplacian matrix L = D − A (Figures 1 and 2) (32–35). The main condition guiding our 2D graph partitioning/subgraph identification protocol is Junction Intactness: a subgraph containing a junction must retain all its connected vertices, so as to avoid formation of subgraphs with broken junctions. Thus, a subgraph containing vertex 2 in Figure 1 will always also include vertices 1, 3 and 5.
Note also the following properties. (i) Subgraphs with the same number of vertices may have different topologies. This is evident, for example, from subgraph 6_3 containing vertices {1, 2, 3, 4, 5, 6} and subgraph 6_2 containing vertices {1, 2, 3, 5, 6, 7} (see Figures 2B and 6B). (ii) A graph may contain different subgraphs with the same label. For example two 5_2 subgraphs of the parent 7_3 graph involve different vertices: {1, 2, 3, 4, 5} and {1, 2, 3, 5, 6} (see Figures 2B and 6C). (iii) A small subgraph can be part of a larger subgraph. For example, subgraph 4_2 {1, 2, 3, 5} is part of subgraph 6_3 {1, 2, 3, 4, 5, 6} (see Figures 2B, 6B and 6D).
Figure 6.
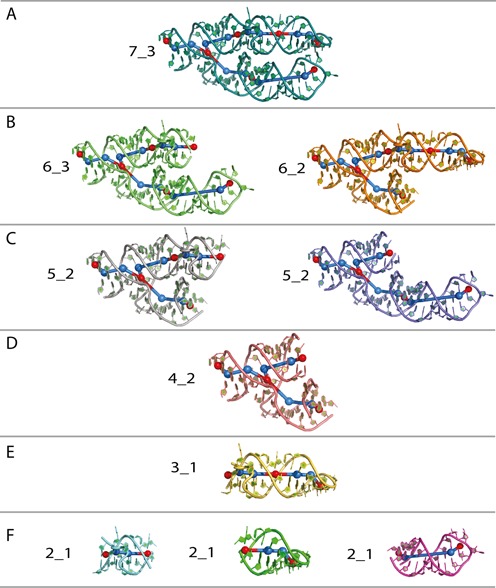
Substructures extracted from a 7S.S SRP RNA (PDB ID: 1LNG) are shown in (A-F). All-atom structures shown in color, the 3D subgraphs are in blue and red. The vertices that are at the center of the loops or junctions or hairpins are indicated in red whereas the additional vertices are indicated in blue.
Our algorithm for subgraph extraction starts by determining from the diagonal matrix, D, whether the query structure contains junctions, i.e. vertices with more than two connections (see Figure 2). If so, the vertices connected to each junction are saved. The second step identifies all non-zero elements of each line of the adjacency matrix, A, to constitute an initial set of subgraphs. For example, if the graph has seven vertices, it has seven lines in the matrix, or a set of seven connected vertices saved as subgraphs. If the structure contains no junctions, then those seven sets constitute seven initial possible subgraphs; if the RNA has junctions, junction connectors are added to the set of vertices to fulfill the Junction Intactness condition. Once completed, the seven (or less combinations depending on whether duplicates are found) constitute an initial set of subgraphs. The third step is to identify all possible subgraphs, by merging the sets that share at least one vertex. After removing duplicates, we add the newly merged sets to the subgraph list. This is repeated until the original graph is formed.
As an example, Figure 2A illustrates our subgraph extraction method applied to the structure of a 7S.S SRP RNA (PDB ID: 1LNG). The extraction of subgraphs is performed by examining the Diagonal and Adjacency matrices. We start by recording the non-zero elements in the Adjacency matrix for each line. We know from Figure 1A that vertex 2 is a junction-vertex, so we record its connectors and obtain the following combination {1, 2, 3, 5}. In the structure of this 7S.S SRP, there are 7 vertices, so seven combinations are extracted in this first step. For example, one combination is {2, 5, 6} because vertex 5 is connected to vertices number 2 and 6. The second step is the identification of the presence of the junction-vertex (vertex 2) in each combination. If it is found, connectors will be added to the combination. In our example, the combination of vertices {2, 5, 6} contains vertex 2, so we need to merge it with {1, 2, 3, 5}, creating the following subgraph {1, 2, 3, 5, 6}. The subgraph {2, 5, 6} cannot be considered valid because this junction-vertex is not associated with all its connectors. We then identify and delete duplicates. The third step is to merge all combinations that share at least one common vertex, resulting in the final 9 unique combinations for 7S.S SRP. Figure 2B shows the list of all 2D subgraphs extracted from the original graph 7_3.
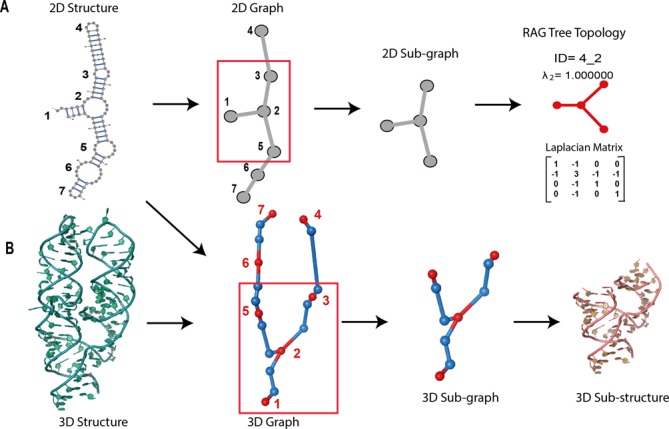
Once we extract all subgraphs, we calculate a new Laplacian matrix for each subgraph and identify the topology IDs as illustrated in Figure 3A, for subgraph number 1, {1, 2, 3, 5}, where topology ID is 4_2. Then, the 3D subgraph extraction is performed based on both 2D and 3D structure information as presented in Figure 3B.
Construction of the RAG-3D database
Our database of 3D structural RNA 3D graphs is classified into groups based on the topology IDs identified in RAG. Currently, RAG-3D contains 36 groups differing by the number of vertices and the connectivity of the graphs they contain. Those groups contain whole RNA structures and/or substructures extracted from their structures, classified based on their topology ID as detailed above. Currently, RAG-3D is limited to groups that contain up through 10 vertices.
Figure 4 presents our procedure flowchart for RAG-3D. Two major components are the database construction and the database search. The build-up phase processes PDB files extracted from the PDB data bank to derive the secondary and tertiary structure information of all RNAs found in the PDB data bank as of March 2014. The secondary structure information is determined using RNAView (46) and the pseudoknots are removed before processing the data using the EG approach (44). The chains of the PDB files are analyzed to identify the presence of single and/or double stranded RNA structures, and to determine what constitutes individual molecules. For each identified molecule, we calculate the Laplacian matrix, generate the 2D graph and define the topology ID. From the Laplacian matrix, we also identify all subgraphs, generate their 2D graphs and define their topology IDs. The 3D-graphs are also generated for each molecule, and 3D-subgraphs are generated based on the vertex numbers involved in the formulated subgraphs as detailed above. The 2D and 3D graphs, sub-graphs and sub-structural all-atom fragments are cataloged in RAG-3D by topology IDs.
Figure 4.
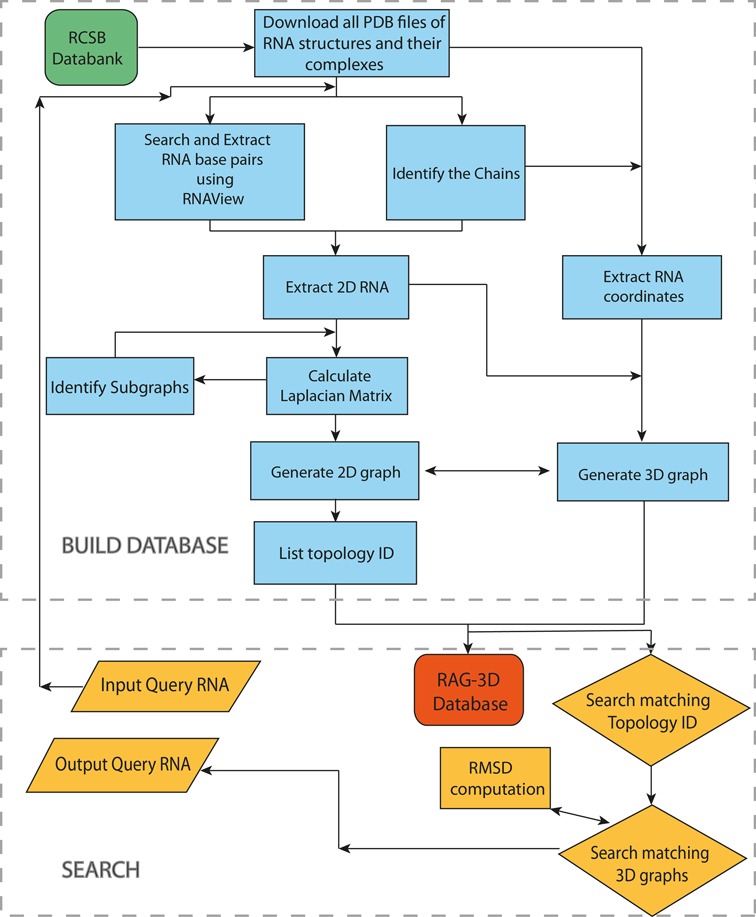
The RAG-3D flowchart.
Search for structure and substructure similarities in RAG-3D
RAG-3D's search engine for graph similarity (see Figure 4) considers two 2D graphs similar if they share the same pattern of connectivity among the vertices (same number of vertices and same λ2). On the 3D level, the structural comparison is performed by a structural alignment of each possible 3D subgraph of a query structure to each of the 3D-graphs of the same topology ID. Structural differences between the optimally aligned graphs are measured by the Root Mean Square Deviation (RMSD) between the aligned vertices positions of the graphs. We have shown that assessing RNAs via RMSD of 3D tree graphs produces similar trends as all-atom structural RMSDs, making it a valuable approach for 3D graph comparison (40). Here, we rank the 3D-graphs based on their RMSDs to the query structure.
On an Intel Xeon quad-core 2.26 GHz processor, the estimated runtime of our search program ranges between few seconds for short RNAs with <10 nt to about 4 min for RNAs with 300–400 nt.
Combined RAG-3D, web tool: interface and output
We implemented a user friendly web server to search our RAG-3D database for structure and substructure similarities. To search the database, a user can enter a PDB and the chain IDs of a known RNA structure, or provide the coordinates of a query RNA in PDB format. We process the query RNA by obtaining the corresponding secondary structure information (using RNAView) and the pseudoknots are removed before processing the data using the EG approach (44). We proceed with the generation of 2D and 3D graphs of the query RNA, and finally with the extraction of all subgraphs and substructures by graph partitioning as detailed above (see Figure 5). Then, each subgraph of the query structure is compared to all the 3D graphs of the same topology ID in the RAG-3D database. The 10 best matching motifs are returned as a list for each topology, ranked by smallest graph RMSD value.
Figure 5.
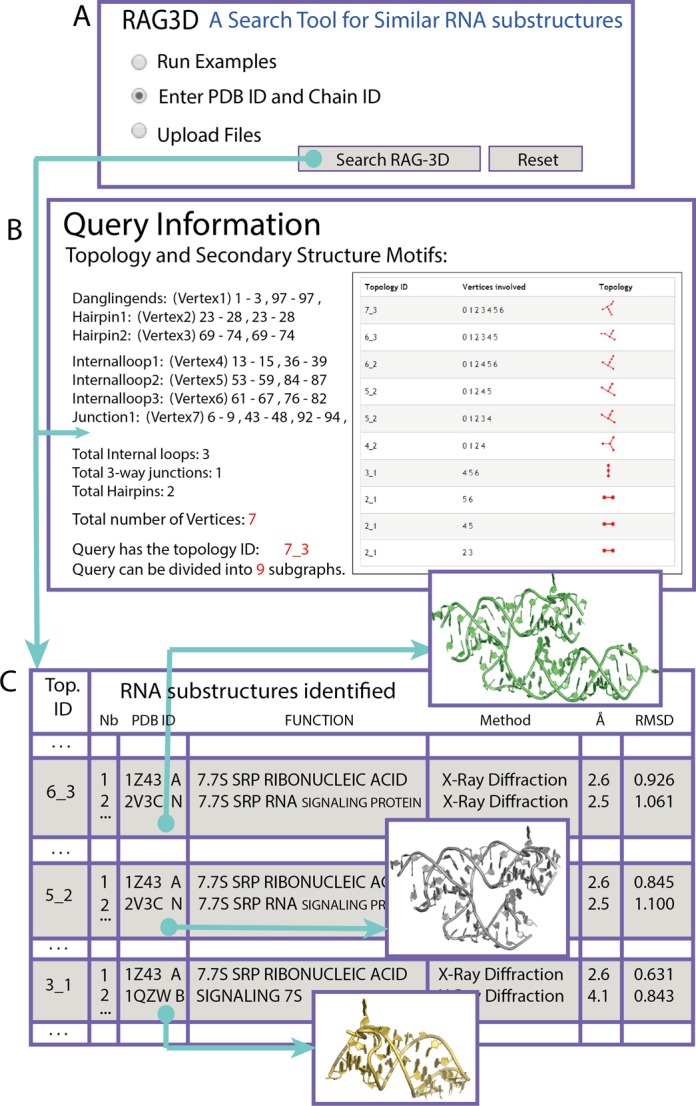
RAG-3D web-interface. (A) A user can enter a PDB name and Chain ID, or provide all-atom coordinates in a PDB format. (B) Snapshot of a first result page for the query 1LNG, or 7S.S SRP. (C) Snapshot of the results for matching fragment in the form of a table. Each topology ID of the query is listed (only three are shown for clarity), and for each topology, a list of the 10 best matching fragments is provided along with corresponding functions.
For our example 7S.S SRP (PDB ID: 1LNG), Figure 5A shows the graphical interface in which the user enters a PDB name and chain ID or provides PDB file. The output consists of two parts, for the query RNA (B), and for the subgraphs (C). Figure 5B shows information regarding the number of secondary motifs (3 internal loops, 2 hairpins, 1 dangling end and 1 junction), topology ID, a schematic view of the graph connectivity and a list of all the subgraphs extracted. The user has the option to download all 3D-graphs. The subgraph list information is summarized as a table listing the matches for each subgraph, ranked by smallest RMSD value. Figure 5C shows the results for three of the nine subgraphs of 1LNG (6_3, 5_2 and 3_1). We provide only the first two smallest RMSD matches for each subgraph search. The resulting findings are ranked, along with topology IDs, PDB and chain IDs, corresponding function, experimental method and RMSD value. Currently, users can also download all-atom fragments of the matching substructures.
RESULTS and DISCUSSION
Subgraphs and Subfragments
An example of RAG-3D's substructuring for the 7S.S SRP of PDB ID: 1LNG is shown Figure 6A. This 7S.S SRP RNA has seven secondary submotifs, including three internal loops, two hairpins, one dangling end and one junction, for a total of 7 vertices. The calculation of the eigenvalues of the Laplacian matrix indicates that its topology ID is 7_3. Figures 6B–F present the nine subgraphs with corresponding all-atom substructures. All subgraphs contain intact junctions. Thus, the smallest subgraph with a vertex-junction is 4_2 and all larger subgraphs include this subgraph. As we see, a larger subgraph may contain smaller subgraphs; for example, subgraph 3_1 is made of two 2_1 motifs. Finally, subgraphs with the same topology ID (e.g. 5_2) may be composed of different vertices and different 3D structures (e.g. two 5_2 subgraphs in Figure 6C).
The subgraphs define potential functional building blocks that may help annotate RNA structures, as well as suggest functionally similar regions. They also provide information beyond the 2D level. For example, our analysis in Figure 7 shows that two RNA structures that have the same 2D graph can exhibit very different 3D folds.
Table 1 lists all RNAs topologies up through 10 vertices found in nature with their graph IDs along with their substructures. Figure 8 provides an example of an all-atom structure for each graph, among several stored. Our database contains 2300 RNA chains extracted from about 1500 PDB structures. Most of the PDB structures contain different independent chains, with possible difference in size and function. These 2300 structures all map onto the 36 topology IDs listed in Table 1. Those missing from the list may be non physical topologies or structures that will be resolved experimentally in the future. Indeed, between the first edition of RAG in 2004 (33) and the second edition in 2011, some missing topologies classified as RNA-like have been solved experimentally (35).
Figure 8.
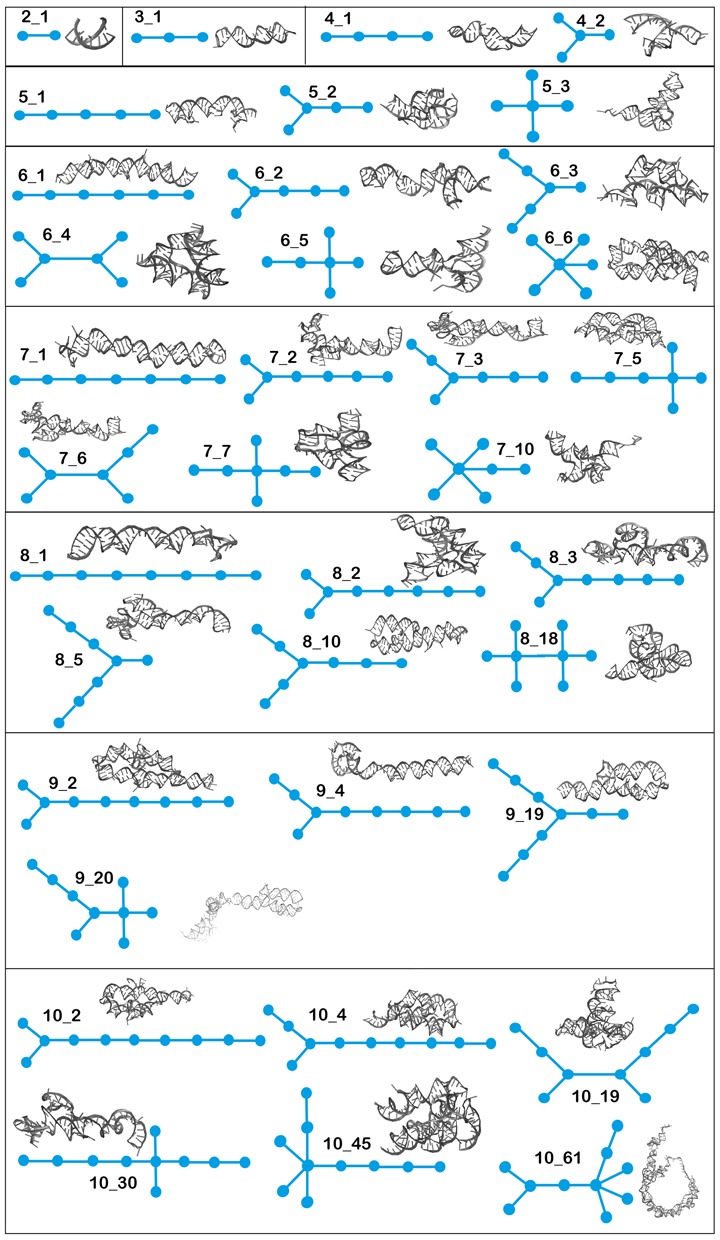
List of all existing graphs with corresponding all-atom structures cataloged in RAG-3D. The 3D structure shown is one representative selected among several possible RNAs stored (see Table 1).
Figure 9 shows the 2D graph representations of four examples to illustrate the subgraphs partitioning listed in Table 1. Figure 9A shows the graph of a ribosomal RNA with topology ID: 10_61 and PDB ID: 3IYR. This RNA contains a three-way junction and a five-way junction. It can be divided into five subgraphs (9_25, 7_10, 6_6, 4_2, 2_1) with intact junctions. Figure 9B shows the graph of a riboswitch RNA with topology ID: 8_15 and PDB ID: 3F30. This structure has two consecutive four-way junctions that are not separated by a vertex. The junctions must remain intact. Therefore, this graph cannot be partitioned. Figure 9C shows the graph of a ribozyme RNA with topology ID: 7_5 and PDB ID: 3L3C. This RNA contains one four-way junction. It can be divided into five subgraphs (6_5, 5_3, 3_1, 2_1, 2_1). Figure 9D shows the graph of a 23S rRNA fragment with topology ID: 5_2 and PDB ID: 1C04. It contains one three-way junction. This graph can be divided into two subgraphs (4_2 and 2_1).
Figure 9.
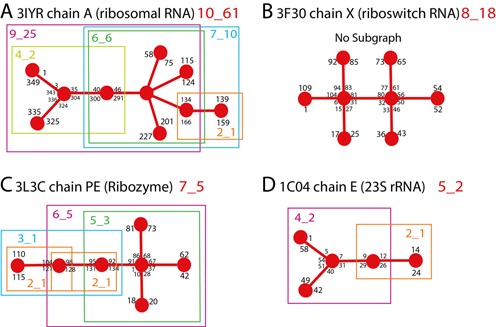
Example of graph substructuring. Some nucleotide numbers from the structure are also indicated. (A) Graph representation of RNA with topology 10_61 containing both three-way and five-way junctions and five subgraphs (9_25, 7_10, 6_6, 4_2, 2_1). (B) RNA of topology 8_18 contains two consecutive four-way junctions that remain intact; no subgraphs exist. (C) RNA with topology ID: 7_5 contains one four-way junction and five subgraphs (6_5, 5_3, 3_1, 2_1, 2_1). (D) RNA with topology ID: 5_2 contains one three-way junction and two subgraphs (4_2 and 2_1).
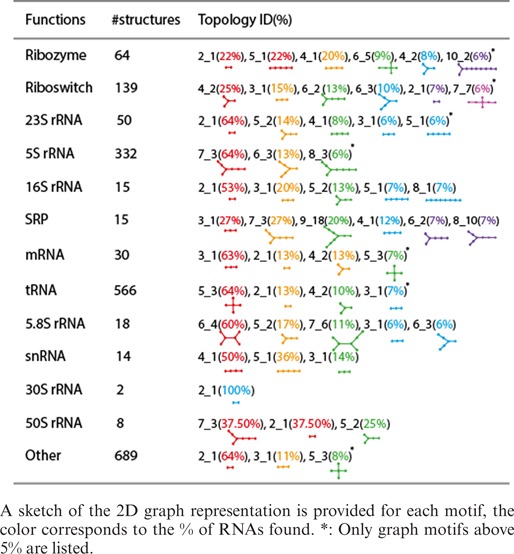
Table 2 summarizes the statistics of the topology partitioning in RAG-3D. We observe that 5S ribosomal RNAs and riboswitches contain the highest percentage of large graphs with more than 6 vertices. Thus for example, 64% of 5S rRNA are classified as 7_3 topology ID.
Table 2. Classification of the function of the existing RNAs in RAG-3D along with most common graph motifs.
Distribution of subgraphs in 23S ribosomal RNAs
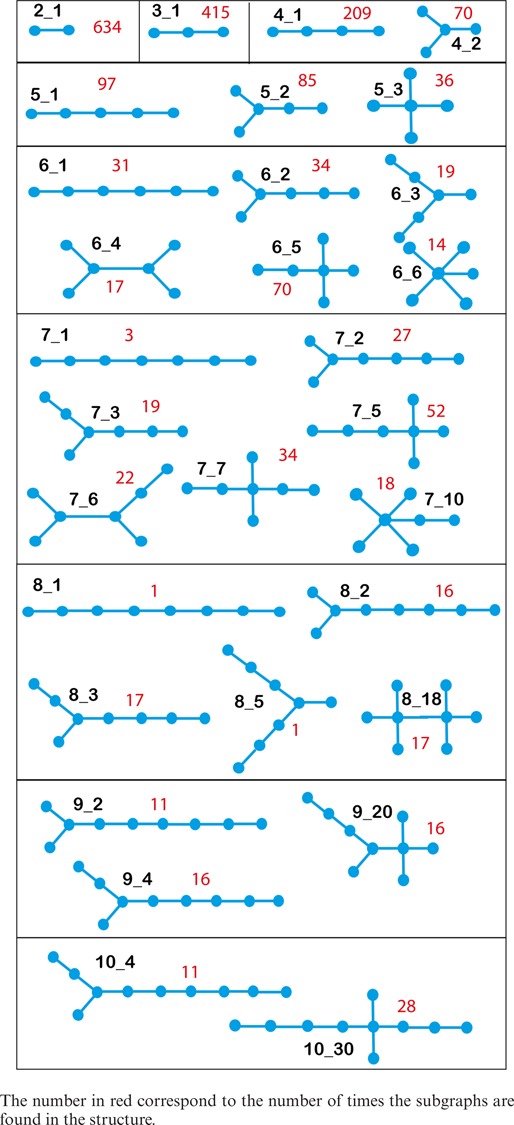
We use RAG-3D to characterize the subgraphs within a dataset of 18 23S rRNA molecules in Table 3 to help uncover the modular construction of RNA structures. This dataset is not included in RAG-3D database since the 23S rRNA structures contain more than 10 vertices (around 150 vertices). We calculate the occurrence of small subgraphs (up to 10 vertices). The rRNA structures we analyzed can be divided into 29 different existing subgraph topologies. Table 3 shows all possible tree subgraphs found in 23S rRNAs with their respective occurrence. Clearly, smaller subgraphs occur frequently. In particular, subgraphs containing four-way junctions (6_5, 7_5, 7_7, 9_20, 10_30) and two consecutive four-way junctions (8_18) are abundant. Thus, such graph partitioning may help reveal the subgraph repertoire of RNAs.
Table 3. Occurrence of the subgraph topologies observed in the 23S rRNA molecules of 1C2W, 1S72, 2AW4, 2WWQ, 3E1D, 3FIK, 3IZU, 3J14, 3J19, 3J37, 3J44, 3J5K, 3J5O, 3ORB, 3UOS, 3UZH, 4G5W and 4KDK.
Comparison with ARTS and R3D-BLAST
To evaluate RAG-3D's features compared to other tools, we provide motif search results and run time estimates for RAG-3D, R3D-BLAST and ARTS in the Supplementary Data. R3D-BLAST is a BLAST-like search tool that searches the PDB database for structurally similar RNA substructures for a query RNA 3D structure given in a PDB format (27). R3D-BLAST returns a list of all similar structures with corresponding E-values which measure statistical significance. ARTS compares two 3D nucleic acid structures and searches for a-priori unknown common substructures (26,47) based on the DARTS RNA database of solved RNA structures (48). The input structures are 3D atom coordinates. A transformation that superimposes the largest number of phosphate atoms of one structure onto the phosphate atoms of the other structure is then applied, and ARTS returns the global alignments that have the highest scores: a score for a pair of RNA structures is calculated as a weighted sum of the number of proximal nucleotides and the number of proximal pairs.
In Tables S1–S12, we compare RAG-3D results to those for ARTS and R3D-BLAST for 12 query RNA structures. Our sample set is selected from the representative 43 RNA structures used in our review to assess 3D folding algorithms (49). The set spans diverse types of motifs and sizes (from 16 to 128 nt). Tables S1–S12 show the five top hits of ARTS and R3D-BLAST sorted by best scores and E-values, respectively. Since RAG-3D returns all matches for each topology ID, we provide only a few top matches for each subgraph sorted by RMSD values. In the table, we highlight in yellow motifs that are common to the programs. Our table contains information for each RNA hit, including PDB ID, chain ID, molecular classification, RMSD, topology ID as determined by RAG and a display of the structural alignment. Results of RAG-3D are provided in a hierarchical order of subgraph IDs of the query RNA (from large to small subunits). As appropriate, we calculate RMSD values for tree graphs rather than all-atom RMSD, but because there is a positive correlation between the two methods (39,40), such an evaluation is appropriate.
Overall, for the 12 queries, we distinguish among these four types of results. (i) Reasonable agreement—R3D-BLAST and RAG-3D find more than one common result and ARTS finds one common result to these; (ii) Partial agreement—all three tools find one common result; (iii) Some differences—R3D-BLAST and RAG-3D return similar findings whereas ARTS returns a different set; and (iv) Differences—all three tools produce different results.
Reasonable agreement was obtained for three queries; fragment of 16S rRNA 1DK1,B, tRNA 2DU3,D and 7S.S SRP 1LNG,B. As an example, for the 7S.S SRP RNA of SRP19 RNA complex, 1LNG,B (See Table S12), all three tools return the 7S.S SRP RNA 1Z43,A as a match. The 7S RNA motifs 2V3C,M and 2V3C,N of the large SRP54-SRP19-7S.S SRP RNA complex are successfully returned by both R3D-BLAST and RAG-3D. The other SRP RNA hits returned by R3D-BLAST are also found by RAG-3D but ranked lower (i.e. poorer matches) due to larger RMSD values. Similarly, the second and fifth results of ARTS are listed by RAG-3D but lower in the list. It is interesting that RAG-3D also finds matching 7_3 motifs from a SRP19/S-domain SRP RNA complex, 3KTV,A and 3KTW,C, found by neither ARTS nor R3D-BLAST.
Partial agreement as we classified above was obtained for two queries; 5S rRNA 1MJI,C, and ribozyme 2OIU,P. For the 5S rRNA fragment of ribosomal protein L5/5S rRNA complex, 1MJI,C (See Supplementary Table S1), for example, all three tools find 1MJI,D which is the other 5S rRNA fragment in the asymmetric unit of the structure as a matching structure. ARTS and RAG-3D return it ranked first and R3D-BLAST ranks it fourth. R3D-BLAST returns five 5S rRNAs from different large structures as top five hits. Interestingly, RAG-3D finds similar HDV ribozymes with 3_1 subgraph IDs as similar structures which might indicate a functional similarity. RAG-3D also finds many similar substructures of 2_1 subgraph IDs from large structures. There are other common structures found by the three programs but they are in different ranking positions.
Some differences can be noticed for five queries; fragment of 23S rRNA 1MZP,B, ribozyme 2QUS,A, fragment of 23S rRNA 1MMS,C, riboswitch 2GIS,A, and 7S SRP 1MFQ,A. For example, for the fragment of 23S rRNA bound to ribosomal protein L11, 1MMS,C (See Supplementary Table S5), R3D-BLAST and RAG-3D return similar results and ARTS returns different structures. Both R3D-BLAST and RAG-3D find the other symmetric chain of the L11–RNA complex, 1MMS,D, same 23S rRNA fragment 1OLN,C from the complex structure of antibiotic binding to the same L11–RNA complex and 23S rRNA fragments from different ribosomal protein–RNA complexes (1C04, E and the C and D chains of 1QA6). The third and fourth hits of RAG-3D (the 23S rRNAs 1Y39,C and 1HC8,D) are also found by R3D-BLAST but they are listed lower (poorer match) when the results are ordered by E-values. Some of the structures returned by ARTS are not included in our database since they have more than 10 vertices; others are not listed here since they have large RMSD values.
Finally, different search results are obtained for two queries; stem-loop II 1XJR,A, and viral RNA pseudoknot 1L2X,A. For example, for the stem-loop II motif (s2m) RNA element of the SARS virus genome, 1XJR,A (See Supplementary Table S2), R3D-BLAST fails to produce a matching structure. RAG-3D finds similar 5_1 motifs but their RMSD values are >8. This suggests that the s2m RNA has a unique overall structure. On the other hand, RAG-3D finds many similar 2_1 submotifs from large structures. The first two hits of ARTS are not included in RAG database since they include >10 vertices.
Thus, overall, we see that the three tools perform quite differently. RAG-3D returns a hierarchical list of motifs ordered by RMSD values whereas the other tools return overall best matches for a given RNA structure. RAG-3D produces some similar findings to R3D-BLAST, but ARTS produces somewhat different results. This may be a consequence of the limited DARTS database. R3D-BLAST and RAG-3D use a larger number of solved structures from the PDB. This also explains why the same structures in the results of ARTS repeat for different query structures.
In Table S13, we compare run time estimates of the three tools. As the number of subgraphs increases, the run time of RAG-3D increases as expected. Note, however, that these computational times cannot be directly compared since the output from these programs is quite different in terms of the number of structures and their relation to the query structure, as we have analyzed above.
Thus, RAG-3D may be advantageous when modularity is of interest, as well as design of RNAs; it takes a more global approach to the similarity search. That is, RAG-3D does not rely on matching individual nucleotides, as does ARTS for example, but rather compares larger units of structure, thereby offering more flexibility. Of course, all three tools are important resources that can be considered complementary and be tailored to specific problems.
Possible RAG-3D's applications
The prediction of the function of newly discovered molecules is a challenge in modern computational biology. When the molecular 3D conformation is known, function may be inferred by structural similarity between molecules. Our 3D graphs, used here to search the RAG-3D database for molecules with the same topological characteristics, contain the tertiary information crucial for the search of functional similarity, and the search may be more efficient in graph space. Our graph comparison procedure based on 2D and 3D searches may thus aid the search for functional similarity. Such a procedure has advantages over sequence comparison because RNAs with the same function have similar or conserved secondary and tertiary structures, whereas the conservation of RNA sequences is less clear. Tertiary information is also better than 2D structure comparisons alone because it considers proximal regions in space in the 3D fold which may be crucial to function. Compared to all-atom 3D comparison, our method allows a faster search for similar 3D shapes.
RAG-3D is also used in our hierarchical graph sampling tool for RNA tertiary structure prediction (40). Specifically, we use RAG-3D to develop atomic models of the predicted 3D graphs by build-up. Our general idea employs a threading-like procedure to determine the atomic coordinates of the predicted 3D-graphs. A search for graph similarity in RAG-3D identifies matching structures or sub-structures with the same 3D-fold. Because RAG-3D contains the 3D atomic coordinates of the sub-fragments extracted from the RNA structures, we can use the corresponding fragment segments to build a structural atomic model (see example in Figure 10). This procedure was performed manually for small RNAs (39), but automated versions of the procedure for large structures require structure refinement and optimization.
Figure 10.
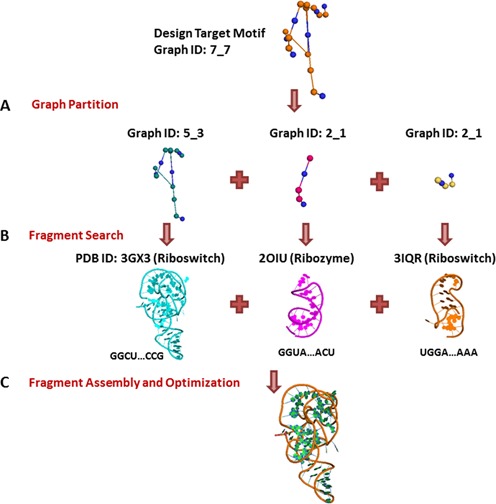
Design application for a target structure of 7_7 graph ID. (A) Calculation of subgraphs of the target structure. (B) Searching for graph similarity in RAG-3D. (C) Assembly procedure.
The RNA inverse folding problem involves predicting RNA sequences that fold onto a target 3D fold or structure. Available tools, INFORNA (50,51), RNAiFold (52) and Frnakenstein (53), often use 2D structure optimization procedures to search for a specific RNA sequence that would fold into the proper 2D structure. As an alternative approach, we could exploit RAG-3D's database of RNA fragments to search for matching 3D fold. A search of graph similarity from a set of backbone coordinates could identify a 2D structure and generate corresponding 2D and 3D graphs. Thus, by searching for matching subgraphs in our database, extracting the primary sequence of the best matching 3D graph, and piecing 1D sequence fragments together along with refinement as described above, sequence candidates could be suggested for the target fold.
Because our database is currently limited to groups that contain up to 10 vertices (∼300 nt), larger RNAs are not yet included. Thus far, the pseudoknots are removed before processing the data. However, since we work with 3D-graphs, regions that are close to one another in space due to the presence of pseudoknots remain close even if we do not explicitly maintain the pseudoknot information on the 3D graph. Further improvements to handle pseudoknots directly can be envisioned using dual graphs (35).
CONCLUSION
The accelerating pace of RNA structures deposition is making the search for structural similarity a necessary tool for translating the wealth RNA of structural data into knowledge. We have presented RAG-3D, a web-accessible database which searches for 3D fragments within a large set of RNA structures using RNA representations as tree graphs. Because the search tool is in motif (coarse-grained graph representation) and not sequence space, the search is very quick.
RAG-3D and other similar tools could ultimately help reveal functional relationships among RNAs, even without detectable sequence similarity, based on the 3D RNA fold extracted from the graph representation. RAG-3D's substructuring could also be useful for a build-up procedure since the architectural subcomponents of the query RNA structures reveal modular structural building blocks. Thus, atomic models could be constructed from the graph substructures. Ultimately, such information could help address the inverse folding problem for RNA, by using partitioning and build-up to discover in silico sequences that fold onto a given 3D motif. Together with many other search and discovery tools now available for RNA, RAG-3D could help advance our appreciation for the modularity and ingenuity of RNA molecules.
SUPPLEMENTARY DATA
Supplementary Data are available at NAR Online.
Acknowledgments
We thank Namhee Kim for valuable suggestions and comments. We also thank other members of the Biomath group at NYU. New York Center for Computational Sciences at Stony Brook University/Brookhaven National Laboratory are gratefully acknowledged.
FUNDING
Computing resources of the Computational Center for Nanotechnology Innovations; Empire State Development's Division of Science, Technology and Innovation [through National Science Foundation (NSF) Group Award TG-MCB080036N]; Department of Energy Grant [DE-AC02-98CH10886 to New York Center for Computational Sciences at Stony Brook University/Brookhaven National Laboratory]; State of New York (to New York Center for Computational Sciences at Stony Brook University/Brookhaven National Laboratory); National Institutes of General Medical Sciences; National Institutes of Health [GM100469; GM081410 to T. S.] Funding for open access charge: NIH.
Conflict of interest statement. None declared.
REFERENCES
- 1.Eddy S.R. Non-coding RNA genes and the modern RNA world. Nat. Rev. Genet. 2001;2:919–929. doi: 10.1038/35103511. [DOI] [PubMed] [Google Scholar]
- 2.Mattick J.S., Makunin I.V. Non-coding RNA. Hum. Mol. Gen. 2006;15(Suppl. 1):R17–R29. doi: 10.1093/hmg/ddl046. [DOI] [PubMed] [Google Scholar]
- 3.Mercer T.R., Dinger M.E., Mattick J.S. Long non-coding RNAs: insights into functions. Nat. Rev. Genet. 2009;10:155–159. doi: 10.1038/nrg2521. [DOI] [PubMed] [Google Scholar]
- 4.Williams K.P. The tmRNA Website: invasion by an intron. Nucleic Acids Res. 2002;30:179–182. doi: 10.1093/nar/30.1.179. [DOI] [PMC free article] [PubMed] [Google Scholar]
- 5.Mello C.C., Conte D. Revealing the world of RNA interference. Nature. 2004;431:338–342. doi: 10.1038/nature02872. [DOI] [PubMed] [Google Scholar]
- 6.Cheetham S., Gruhl F., Mattick J., Dinger M. Long noncoding RNAs and the genetics of cancer. Br. J. Cancer. 2013;108:2419–2425. doi: 10.1038/bjc.2013.233. [DOI] [PMC free article] [PubMed] [Google Scholar]
- 7.Huang T., Alvarez A., Hu B., Cheng S.-Y. Noncoding RNAs in cancer and cancer stem cells. Chin. J. Cancer. 2013;32:582–593. doi: 10.5732/cjc.013.10170. [DOI] [PMC free article] [PubMed] [Google Scholar]
- 8.Zamore P.D., Haley B. Ribo-gnome: the big world of small RNAs. Science. 2005;309:1519–1524. doi: 10.1126/science.1111444. [DOI] [PubMed] [Google Scholar]
- 9.Mehler M.F., Mattick J.S. Non-coding RNAs in the nervous system. J. Physiol. 2006;575:333–341. doi: 10.1113/jphysiol.2006.113191. [DOI] [PMC free article] [PubMed] [Google Scholar]
- 10.Esteller M. Non-coding RNAs in human disease. Nat. Rev. Genet. 2011;12:861–874. doi: 10.1038/nrg3074. [DOI] [PubMed] [Google Scholar]
- 11.Berman H.M., Westbrook J., Feng Z., Gilliland G., Bhat T.N., Weissig H., Shindyalov I.N., Bourne P.E. The Protein Data Bank. Nucleic Acids Res. 2000;28:235–242. doi: 10.1093/nar/28.1.235. [DOI] [PMC free article] [PubMed] [Google Scholar]
- 12.Berman H.M., Battistuz T., Bhat T.N., Bluhm W.F., Bourne P.E., Burkhardt K., Feng Z., Gilliland G.L., Iype L., Jain S., et al. The Protein Data Bank. Acta Crystallogr. D. Biol. Crystallogr. 2002;58:899–907. doi: 10.1107/s0907444902003451. [DOI] [PubMed] [Google Scholar]
- 13.Kin T., Yamada K., Terai G., Okida H., Yoshinari Y., Ono Y., Kojima A., Kimura Y., Komori T., Asai K. fRNAdb: a platform for mining/annotating functional RNA candidates from non-coding RNA sequences. Nucleic Acids Res. 2007;35:D145–D148. doi: 10.1093/nar/gkl837. [DOI] [PMC free article] [PubMed] [Google Scholar]
- 14.Griffiths-Jones S., Saini H.K., van Dongen S., Enright A.J. miRBase: tools for microRNA genomics. Nucleic Acids Res. 2008;36:D154–D158. doi: 10.1093/nar/gkm952. [DOI] [PMC free article] [PubMed] [Google Scholar]
- 15.He S., Liu C., Skøgerbo G., Zhao H., Wang J., Liu T., Bai B., Zhao Y., Chen R. NONCODE v2.0: decoding the non-coding. Nucleic Acids Res. 2008;36:D170–D172. doi: 10.1093/nar/gkm1011. [DOI] [PMC free article] [PubMed] [Google Scholar]
- 16.Tinoco I. Jr, Bustamante C. How RNA folds. J. Mol. Biol. 1999;293:271–281. doi: 10.1006/jmbi.1999.3001. [DOI] [PubMed] [Google Scholar]
- 17.Leontis N.B., Lescoute A., Westhof E. The building blocks and motifs of RNA architecture. Curr. Opin. Struct. Biol. 2006;16:279–287. doi: 10.1016/j.sbi.2006.05.009. [DOI] [PMC free article] [PubMed] [Google Scholar]
- 18.Klein D., Schmeing T., Moore P., Steitz T. The kink-turn: a new RNA secondary structure motif. EMBO J. 2001;20:4214–4221. doi: 10.1093/emboj/20.15.4214. [DOI] [PMC free article] [PubMed] [Google Scholar]
- 19.Szewczak A., Moore P. The sarcin/ricin loop, a modular RNA. J. Mol. Biol. 1995;247:81–98. doi: 10.1006/jmbi.1994.0124. [DOI] [PubMed] [Google Scholar]
- 20.Hendrix D.K., Brenner S.E., Holbrook S.R. RNA structural motifs: building blocks of a modular biomolecule. Q. Rev. Biophys. 2005;38:221–243. doi: 10.1017/S0033583506004215. [DOI] [PubMed] [Google Scholar]
- 21.Krasilnikov A.S., Mondragón A. On the occurrence of the T-loop RNA folding motif in large RNA molecules. RNA. 2003;9:640–643. doi: 10.1261/rna.2202703. [DOI] [PMC free article] [PubMed] [Google Scholar]
- 22.Popenda M., Blazewicz M., Szachniuk M., Adamiak R.W. RNA FRABASE version 1.0: an engine with a database to search for the three-dimensional fragments within RNA structures. Nucleic Acids Res. 2008;36:D386–D391. doi: 10.1093/nar/gkm786. [DOI] [PMC free article] [PubMed] [Google Scholar]
- 23.Popenda M., Szachniuk M., Blazewicz M., Wasik S., Burke E.K., Blazewicz J., Adamiak R.W. RNA FRABASE 2.0: an advanced web-accessible database with the capacity to search the three-dimensional fragments within RNA structures. BMC Bioinformatics. 2010;11:231. doi: 10.1186/1471-2105-11-231. [DOI] [PMC free article] [PubMed] [Google Scholar]
- 24.Lai C.-E., Tsai M.-Y., Liu Y.-C., Wang C.-W., Chen K.-T., Lu C.L. FASTR3D: a fast and accurate search tool for similar RNA 3D structures. Nucleic Acids Res. 2009;37:W287–W295. doi: 10.1093/nar/gkp330. [DOI] [PMC free article] [PubMed] [Google Scholar]
- 25.Petrov A.I., Zirbel C.L., Leontis N.B. Automated classification of RNA 3D motifs and the RNA 3D Motif Atlas. RNA. 2013;19:1327–1340. doi: 10.1261/rna.039438.113. [DOI] [PMC free article] [PubMed] [Google Scholar]
- 26.Dror O., Nussinov R., Wolfson H. ARTS: alignment of RNA tertiary structures. Bioinformatics. 2005;21(Suppl. 2):ii47–ii53. doi: 10.1093/bioinformatics/bti1108. [DOI] [PubMed] [Google Scholar]
- 27.Liu Y.-C., Yang C.-H., Chen K.-T., Wang J.-R., Cheng M.-L., Chung J.-C., Chiu H.-T., Lu C.L. R3D-BLAST: a search tool for similar RNA 3D substructures. Nucleic Acids Res. 2011;39:W45–W49. doi: 10.1093/nar/gkr379. [DOI] [PMC free article] [PubMed] [Google Scholar]
- 28.Petrov A.I., Zirbel C.L., Leontis N.B. WebFR3D–a server for finding, aligning and analyzing recurrent RNA 3D motifs. Nucleic Acids Res. 2011;39:W50–W55. doi: 10.1093/nar/gkr249. [DOI] [PMC free article] [PubMed] [Google Scholar]
- 29.Capriotti E., Marti-Renom M.A. SARA: a server for function annotation of RNA structures. Nucleic Acids Res. 2009;37:W260–W265. doi: 10.1093/nar/gkp433. [DOI] [PMC free article] [PubMed] [Google Scholar]
- 30.Hamdani H.Y., Appasamy S.D., Willett P., Artymiuk P.J., Firdaus-Raih M. NASSAM: a server to search for and annotate tertiary interactions and motifs in three-dimensional structures of complex RNA molecules. Nucleic Acids Res. 2012;40:W35–W41. doi: 10.1093/nar/gks513. [DOI] [PMC free article] [PubMed] [Google Scholar]
- 31.Chojnowski G., Walen T., Bujnicki J.M. RNA Bricks–a database of RNA 3D motifs and their interactions. Nucleic Acids Res. 2014;42:D123–D131. doi: 10.1093/nar/gkt1084. [DOI] [PMC free article] [PubMed] [Google Scholar]
- 32.Gan H.H., Pasquali S., Schlick T. Exploring the repertoire of RNA secondary motifs using graph theory; implications for RNA design. Nucleic Acids Res. 2003;31:2926–2943. doi: 10.1093/nar/gkg365. [DOI] [PMC free article] [PubMed] [Google Scholar]
- 33.Gan H.H., Fera D., Zorn J., Shiffeldrim N., Tang M., Laserson U., Kim N., Schlick T. RAG: RNA-As-Graphs database–concepts, analysis, and features. Bioinformatics. 2004;20:1285–1291. doi: 10.1093/bioinformatics/bth084. [DOI] [PubMed] [Google Scholar]
- 34.Fera D., Kim N., Shiffeldrim N., Zorn J., Laserson U., Gan H.H., Schlick T. RAG: RNA-As-Graphs web resource. BMC Bioinformatics. 2004;5:88. doi: 10.1186/1471-2105-5-88. [DOI] [PMC free article] [PubMed] [Google Scholar]
- 35.Izzo J.A., Kim N., Elmetwaly S., Schlick T. RAG: an update to the RNA-As-Graphs resource. BMC Bioinformatics. 2011;12:219. doi: 10.1186/1471-2105-12-219. [DOI] [PMC free article] [PubMed] [Google Scholar]
- 36.Kim N., Petingi L., Schlick T. Network Theory Tools for RNA Modeling. WSEAS Trans. Math. 2013;9:941–955. [PMC free article] [PubMed] [Google Scholar]
- 37.Kim N., Zahran M., Schlick T. Chapter five—computational prediction of riboswitch tertiary structures including pseudoknots by RAGTOP: a hierarchical graph sampling approach. Method. Enzymol. 2015;553:115–135. doi: 10.1016/bs.mie.2014.10.054. [DOI] [PubMed] [Google Scholar]
- 38.Kim N., Fuhr K.N., Schlick T. Graph applications to RNA structure and function. In: Russel R, editor. Biophysics of RNA Folding. NY: Springer; 2013. pp. 23–51. [Google Scholar]
- 39.Laing C., Jung S., Kim N., Elmetwaly S., Zahran M., Schlick T. Predicting helical topologies in RNA junctions as tree graphs. PLoS One. 2013;8:e71947. doi: 10.1371/journal.pone.0071947. [DOI] [PMC free article] [PubMed] [Google Scholar]
- 40.Kim N., Laing C., Elmetwaly S., Jung S., Curuksu J., Schlick T. Graph-based sampling for approximating global helical topologies of RNA. Proc. Natl. Acad. Sci. U.S.A. 2014;111:4079–4084. doi: 10.1073/pnas.1318893111. [DOI] [PMC free article] [PubMed] [Google Scholar]
- 41.Pasquali S., Gan H.H., Schlick T. Modular RNA architecture revealed by computational analysis of existing pseudoknots and ribosomal RNAs. Nucleic Acids Res. 2005;33:1384–1398. doi: 10.1093/nar/gki267. [DOI] [PMC free article] [PubMed] [Google Scholar]
- 42.Kim N., Shiffeldrim N., Gan H.H., Schlick T. Candidates for novel RNA topologies. J. Mol. Biol. 2004;341:1129–1144. doi: 10.1016/j.jmb.2004.06.054. [DOI] [PubMed] [Google Scholar]
- 43.Darty K., Denise A., Ponty Y. VARNA: Interactive drawing and editing of the RNA secondary structure. Bioinformatics. 2009;25:1974–1975. doi: 10.1093/bioinformatics/btp250. [DOI] [PMC free article] [PubMed] [Google Scholar]
- 44.Smit S., Rother K., Heringa J., Knight R. From knotted to nested RNA structures: a variety of computational methods for pseudoknot removal. RNA. 2008;14:410–416. doi: 10.1261/rna.881308. [DOI] [PMC free article] [PubMed] [Google Scholar]
- 45.Schlick T. A modular strategy for generating starting conformations and data structures of polynucleotide helices for potential energy calculations. J. Comput. Chem. 1988;9:861–889. [Google Scholar]
- 46.Yang H., Jossinet F., Leontis N., Chen L., Westbrook J., Berman H., Westhof E. Tools for the automatic identification and classification of RNA base pairs. Nucleic Acids Res. 2003;31:3450–3460. doi: 10.1093/nar/gkg529. [DOI] [PMC free article] [PubMed] [Google Scholar]
- 47.Dror O., Nussinov R., Wolfson H.J. The ARTS web server for aligning RNA tertiary structures. Nucleic Acids Res. 2006;34(Suppl. 2):W412–W415. doi: 10.1093/nar/gkl312. [DOI] [PMC free article] [PubMed] [Google Scholar]
- 48.Abraham M., Dror O., Nussinov R., Wolfson H.J. Analysis and classification of RNA tertiary structures. RNA. 2008;14:2274–2289. doi: 10.1261/rna.853208. [DOI] [PMC free article] [PubMed] [Google Scholar]
- 49.Laing C., Schlick T. Computational approaches to 3D modeling of RNA. J. Phys. Condens. Matter. 2010;22:283101. doi: 10.1088/0953-8984/22/28/283101. [DOI] [PMC free article] [PubMed] [Google Scholar]
- 50.Busch A., Backofen R. INFO-RNA–a fast approach to inverse RNA folding. Bioinformatics. 2006;22:1823–1831. doi: 10.1093/bioinformatics/btl194. [DOI] [PubMed] [Google Scholar]
- 51.Busch A., Backofen R. INFO-RNA–a server for fast inverse RNA folding satisfying sequence constraints. Nucleic Acids Res. 2007;35(Suppl. 2):W310–W313. doi: 10.1093/nar/gkm218. [DOI] [PMC free article] [PubMed] [Google Scholar]
- 52.Garcia-Martin J.A., Clote P., Dotu I. RNAiFold: a constraint programming algorithm for RNA inverse folding and molecular design. J. Bioinform. Comput. Biol. 2013;11:1350001. doi: 10.1142/S0219720013500017. [DOI] [PubMed] [Google Scholar]
- 53.Lyngsø R.B., Anderson J.W., Sizikova E., Badugu A., Hyland T., Hein J. Frnakenstein: multiple target inverse RNA folding. BMC Bioinformatics. 2012;13:260. doi: 10.1186/1471-2105-13-260. [DOI] [PMC free article] [PubMed] [Google Scholar]
Associated Data
This section collects any data citations, data availability statements, or supplementary materials included in this article.