


Abstract
Recent studies have revealed significant roles of RNA structure in almost every step of RNA processing, including transcription, splicing, transport and translation. RNase footprint sequencing (RNase-seq) has emerged to dissect RNA structures at the genome scale. However, it remains challenging to analyze RNase-seq data because of the issues of signal sparsity, variability and correlations among various RNases. We present a probabilistic framework, joint Poisson-gamma mixture (JPGM), for integrative modeling of multiple RNase-seq profiles. Combining JPGM with hidden Markov model allows genome-wide inference of RNA structures. We apply the joint modeling approach for inferring base pairing states on simulated data sets and RNase-seq profiles of the double-strand specific RNase V1 and single-strand specific RNase S1 in yeast. We demonstrate that joint analysis of V1 and S1 profiles outputs interpretable RNA structure states, while approaches that analyze each profile separately do not. The joint modeling approach predicts the structure states of all nucleotides in 3196 transcripts of yeast without compromising accuracy, while the simple thresholding approach misses 43% of the nucleotides. Furthermore, the posterior probabilities outputted by our model are able to resolve the structural ambiguity of ≈300 000 nucleotides with overlapping V1 and S1 cleavage sites. Our model also generates RNA accessibilities, which are associated with three-dimensional conformations.
INTRODUCTION
Determining the molecular structure of RNA is important for understanding its function and regulation (1). Computational prediction of RNA structure solely based on sequence does not take various real situations (e.g. in vitro and in vivo folding) into account (2–5). While traditional experimental methods (such as X-ray crystallography (6), nuclear magnetic resonance (7) and cryo-electron microscopy (8)) allow one to probe the structure of one RNA of a limited length at a time, structural measurement of the entire transcriptome (i.e. the RNA structurome (9)) is recently advanced by the utilization of high-throughput sequencing technologies (10–18). Once properly combined with experimental data, computational models can dramatically increase the accuracy of RNA secondary structure prediction (19–22). The successful extraction of structural features from high-throughput sequencing experimental data is key for genome-scale reconstruction of RNA secondary structure (20,23).
One of the most desired RNA structural features is the landscape of double- and single-strandedness across the transcriptome. Paired and unpaired bases extracted from RNA structure mapping experiments are often used as constraints (19) or guidelines (20) for improved RNA secondary structure reconstruction. The paired or unpaired state of a nucleotide can also be used as a feature for learning RNA motifs that are targeted by RNA binding proteins (20,24,25). Yet, it remains challenging to learn RNA structural features from high-throughput RNA structure mapping data effectively, due to the lack of the understanding of biases and noises in these assays. RNase footprinting coupled with high-throughput sequencing (RNase-seq), one of the most popular RNA structure mapping methods, cleaves structure-specific regions with specific RNases and converts the isolated RNAs into cDNA libraries for next generation sequencing processing. The reagents that are commonly used include the double-strand specific RNase V1 (10,14) and the single-strand specific S1 nuclease (10,11), etc. Comparing to using a single RNase, the use of a combination of complementary RNases provides more coverage of the transcriptome and the characterization of both double- and single-stranded bases (10,14). For example, the parallel analysis of RNA structure (PARS) approach (10) compares the RNase-seq profile of V1 versus that of S1, and uses the log-ratio score of the normalized read counts derived from the two enzymes to estimate the relative double-strandedness of each nucleotide. In the yeast PARS study (10), the log-ratio score represents the interrogation of 57% of all nucleotides in the yeast transcriptome, comparing to 45% or 34% of using V1 or S1 alone.
The analysis of RNase-seq profiles poses significant challenges for statistical modeling. RNase-seq signals demonstrate extensive variability, likely affected by a number of factors other than the double- and single-strandedness. It is notable that transcript abundance could affect the chance of RNase cleavage and result in sparsity in the signal profiles. To overcome the sparsity, it is suggested to use a cutoff of on average one mapped read per base to filter lowly expressed transcripts (23). But signal sparsity still exists with this coverage cutoff. In addition, RNase cleavage could be affected by properties at the single-nucleotide level. For example, the V1 and S1 read counts in the yeast PARS data (10) are positively correlated both across the whole transcriptome (Spearman correlation coefficient (SCC) = 0.37) and among individual bases within one transcript (Figure 1, P-value = 2.61 × 10−288 under t-test), which seems to contradict the opposite structure preferences that V1 and S1 are supposed to have. It suggests that some shared factors other than double- or single-strandedness are affecting the cleavage of both V1 and S1 at the single-nucleotide level. For instance, the spatial accessibility of individual bases of an RNA may affect the cleavage of RNases. Nucleotides located at inside-facing or compact regions of the folded RNA may not be cleaved as easily as those located in outside-facing or loose regions. Another source of RNase-seq signal variability lies in the intrinsic properties of RNases which prevent them from cleaving bases continuously. For example, at least two and usually three residues are required on either side of the hydrolysis site to be recognized by RNase V1 (26). Thus, traditional approaches (10) that treat individual nucleotides independently are insufficient for genome-wide inference of RNA structural features from RNase-seq data.
Figure 1.
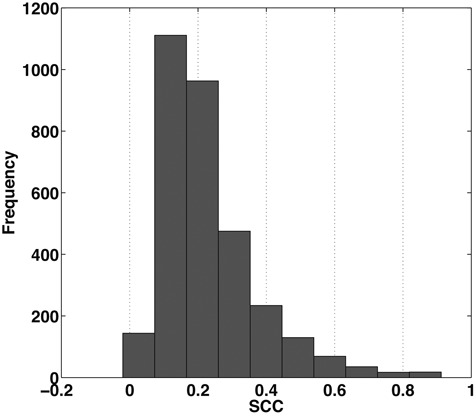
Histogram of the Spearman correlation coefficient (SCC) between the read counts of V1 and S1 RNase-seq profiles per transcript in yeast.
In this study, we present a probabilistic framework for joint analysis of multiple RNase-seq profiles of the whole transcriptome. We test our model on simulated data sets and the RNase-seq profiles of V1 and S1 in yeast (10). We demonstrate that our joint modeling approach yields higher accuracy for inferring RNA structure states compared to approaches that modeling each data set independently or ignoring the correlation among adjacent nucleotides. In addition, our model provides the first genome-wide inference of RNA spatial accessibilities, which are shown to be associated with RNA three-dimensional (3D) structure conformation.
MATERIALS AND METHODS
Overview
Our modeling framework is illustrated in Figure 2. It takes the mapped read counts of complementary RNase-seq data (such as V1 and S1) of the whole transcriptome, and models them by a novel joint Poisson-gamma mixture (JPGM) model with a nucleotide-specific common effect of RNA accessibility. As a trade-off of model complexity and data availability, we implement three components in the model, in which the component coefficients are learned from the data. With V1 and S1 RNase-seq data, we expect the three components correspond to three structure states: double-strand, single-strand and inaccessible-for-cleavage, which will be determined by the learned component coefficients.
Figure 2.
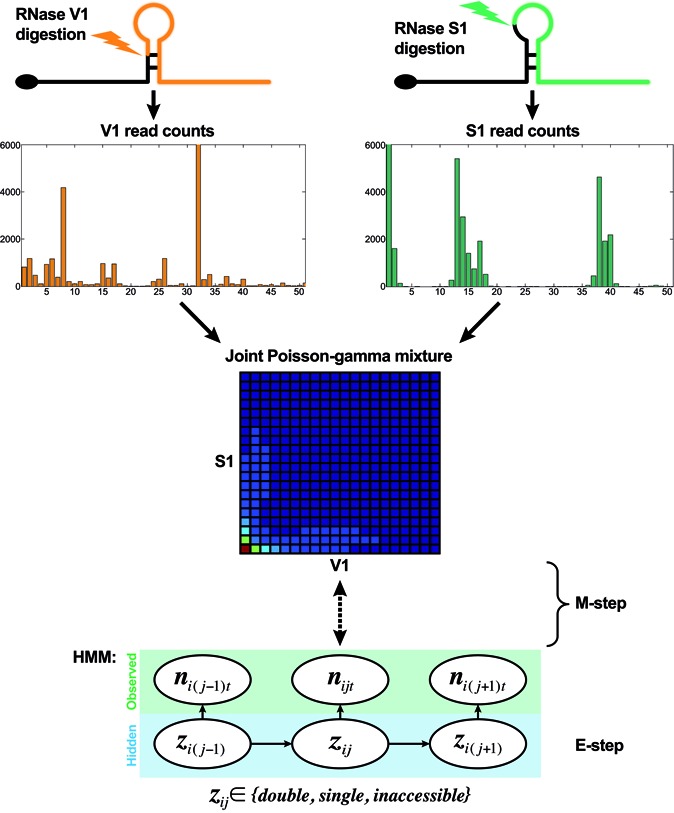
The framework of integrating complementary RNase-seq profiles for genome-wide inference of RNA structure.
RNase-seq signals of adjacent nucleotides in a transcript are correlated, as a result of clustered single-stranded or double-stranded nucleotides. Thus far there are no methods to characterize the within-nucleotide correlations in RNase-seq data. For simplicity, we model the adjacent nucleotides along a transcript as a Markov chain. That is, the structure state of one nucleotide is associated with the state of the nucleotide before it, which can be characterized by a transition probability matrix in Markov chain. We combine JPGM with the hidden Markov model (HMM) such that consecutively double- or single-stranded regions have a greater probability of being inferred. We then use the expectation-maximization (EM) algorithm to infer all the parameters automatically, and output the posterior probabilities of the structure states at the single-nucleotide resolution. Thus, the structure states of all the nucleotides in a transcriptome can be inferred probabilistically.
JPGM model
We model the nucleotide-specific read counts of RNase-seq by the following JPGM model:
 |
Here nijt is the integer-valued read count of the jth nucleotide in transcript i cleaved by RNase t (i.e., t = 1 for V1 and t = 2 for S1). li represents the length of transcript i. λi represents the transcript abundance. dt represents a global parameter characterizing the sequencing depth. We set d1 = 0 and d2 as the log-ratio of the total read count of S1 over that of V1.
 indicates the nucleotide's structure state k to be learned from the combined RNase-seq profiles. We expect that k = 1 or 2 corresponds to double- or single-strand states depending on the estimated model parameters, given that V1 is double-strand specific and S1 is single-strand specific. We set k = 3 as an inaccessible-for-cleavage state with a degenerate distribution valued at 0. βtk represents the relative difference in the average V1 and S1 read counts among the structure states with β11 = 0 for model recognition. Examining of the estimated model parameters βtk will allow one to check whether the inferred three-component RNA structure states are consistent with the specificity of V1 and S1. For example, if β11 > β12 and β11 > β21, then the first component may represent the double-strand state since it is favorable to V1. Similarly. if β22 > β12 and β22 > β21, then the second component may represent the single-strand state since it is favorable to S1. αij, the RNA accessibility of the jth nucleotide in transcript i, is modeled with a gamma distribution of equally valued shape and scale. The effect of αij can be averaged out across nucleotides, i.e. E(exp (αij)) = 1 under Γ(k*, k*), where k* is the dispersion parameter reflecting signal variation across nucleotides since
  . The smaller k* is, the more dispersed the data are. We model αij in JPGM using the gamma distribution with the unknown parameter k* to be estimated so that it can capture the variability in RNase-seq flexibly.
Denote  = exp (αij) and μitk = λiexp (dt + βtk), integrating
  we get (see Supplementary Material for detailed derivation):
 |
(1) |
Hence we derive the joint distribution of V1 and S1 read counts. The JPGM model explicitly considers the shared influence of RNA accessibility on the cleavage of different RNases. It is easy to show that when k* goes to infinity, the JPGM model becomes the Poisson mixture model, in which the influence of RNA accessibility is negligible. The marginal distributions of JPGM are both negative binomial (NB). But the joint distribution is not NB and the two read counts are correlated through a shared latent variable αij. Each nucleotide's two read counts (nij1, nij2) then follow a three-component mixture model as follows:
 |
(2) |
where ϕijk = P( = k), i.e. the mixture portion of structure state k (
 at the jth nucleotide of transcript i.
HMM implementation
We treat each transcript as a hidden Markov chain whose observations are the V1 and S1 reads counts per nucleotide and the hidden states are the aforementioned double-strand, single-strand and inaccessible-for-cleavage. Denoting the initial distribution of RNA structure states as  and the transition probability matrix as
  .
.  ,
,  and the mixture portion ϕijk as well as the probabilities of the structure states for each nucleotide given the observations can be estimated by the Bauma-Welch algorithm (27).
The nucleotide-specific RNA accessibility αij = log ( ) can be inferred through the posterior distribution of
  (see Supplementary Material for detailed derivation):
 |
(3) |
where  .
.  is estimated by the mode of its posterior distribution.
EM algorithm
We use the EM algorithm to estimate all the parameters iteratively. The description of the algorithm is as follows (see Supplementary Material for detailed derivation):
-
Initialize the global parameter
 , k*(0) by fitting a non-HMM JPGM model through the EM algorithm using nucleotides that are cleaved by at least one of the two enzymes. Denote θ as all the parameters concerned.
Initialize
 according to the posterior probability given by EM for nucleotides with non-zero reads. For those with no reads, sample randomly from (0,1).
And initialize
 and
and  by random.
 - (M-step 1) Set l = 1,
 , in which
(4) - (E-step) Update
 by γik(j) calculated through the Bauma-Welch algorithm (27) on transcript i given
  , k*(l − 1), P(l − 1), π(l − 1) and
  fixed. Here

- (M-step 2) Update
 by averaging all γik(1). And update
  by
by  , with
  calculated through the forward-backward algorithm on transcript i (i = 1,...,N), given fixed
  , k*(l − 1) and
  . Here
(5) - (M-step 3) Update
 and k*(l) by optimizing the expected value of the log-likelihood function
(6) l → l + 1, return to the second step and repeat the cycle until the criteria for convergence are met.
RESULTS
Results on simulated data
We simulated 1000 hidden Markov chains whose lengths vary from 200 to 2000, with observations as simulated V1 and S1 read counts and three hidden states as double-strand (enriched in V1 but not S1), single-strand (enriched in S1 but not V1) and inaccessible-for-cleavage (degenerate at 0 in both V1 and S1). The hidden states are sampled according to predefined initial distribution and transition probability matrix specified in Table 1 and 2, respectively. We sampled transcript abundance λi (ranging from 2 to 300) from a uniform distribution. Then we fitted the JPGM model using both the simulated V1 and S1 data sets. To demonstrate the advantage of modeling both data sets jointly versus modeling each data set alone, we also fitted the NB model on the V1 and S1 data sets separately. The structure states are inferred by assigning each nucleotide to the state with the highest posterior probability. We compared the predicted structure states with the corresponding true structure states and calculated the prediction accuracy as the percentage of true structure states that are correctly predicted. As shown in Table 1, the accuracy is 0.99 by fitting V1 and S1 jointly, while it is only 0.51 or 0.76 by fitting V1 or S1 alone. We also compared the estimated parameters to the true parameters, i.e.,  ,
,  ,
,  and k* in Table 1. The estimated parameters are much closer to the true parameters by fitting V1 and S1 jointly compared to fitting V1 or S1 alone. This suggests that joint modeling borrows information from both V1 and S1, thus improves the model fitting.
Table 1. Simulation results of the comparisons of parameter estimates and predictive accuracies obtained from fitting the simulated V1 and S1 data sets jointly (the JPGM model) or individually (the NB model).
| Parameter |  |
 |
 |
k* | Accuracy |
|---|---|---|---|---|---|
| Real values |  |
 |
 |
0.5 | - |
| Est-V1+S1 |  |
 |
 |
0.44 | 0.99 |
| Est-V1 |  |
 |
0.3 | 0.42 | 0.51 |
| Est-S1 |  |
 |
-0.14 | 0.33 | 0.76 |
Table 2. Simulation results of the sensitivity of the JPGM model over varying P, π and k*.
| Parameter | P | π | β | k* | Accuracy |
|---|---|---|---|---|---|
| Mean |  |
 |
 |
0.5 | - |
Varying  & &
|
 |
 |
 |
0.45 | 0.98 |
| Varying k* |  |
 |
 |
0.37 | 0.93 |
To test whether the JPGM model is sensitive to potentially different parameters in different transcripts, we applied it to diverse settings of parameters across transcripts. Specifically, we varied the initial distribution  , the transition probability matrix
  and the dispersion parameter k* across different transcripts. We let
  and each row of
  follow a Dirichlet distribution Dir (
 ), where the parameters
  are 10 times of the values presented in the ”mean” row of
  and
and  in Table 2. We sampled k* from the uniform distribution on the interval [0,1] for each transcript. We then fitted the JPGM model on this data set with identical parameter settings for all transcripts. It can be seen from Table 2 that the estimated parameters are close to the true means. The estimated structure components still maintain the relative levels of V1 and S1. The accuracies of the structure state predictions also remain high. This simulation study demonstrates that the JPGM model is robust to variability among different transcripts.
Furthermore, we tested whether the JPGM model is robust to erroneous data which mimic real situations. We simulated noisier data sets with reduced transcript abundance λi ranging from 2 to 30 from a uniform distribution. To introduce errors, we randomized a series of percentages (between 0 and 1) of the V1 and S1 signals. Then we compared the prediction accuracy of the JPGM model and the log-ratio score of V1 ans S1 read counts per nucleotide (10). The accuracies of the predictions of JPGM along the randomized percentages are consistently higher than those of the log-ratio score (Figure 3), which demonstrates the robustness of the JPGM model on erroneous data.
Figure 3.
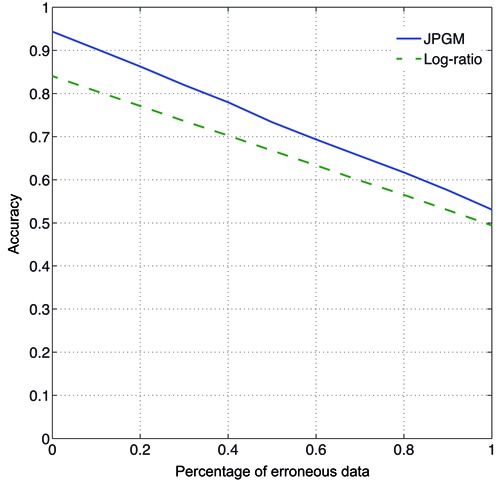
Robustness on erroneous data. The accuracies of the predictions of JPGM and the log-ratio score on simulated data sets with randomized percentages of V1 and S1 signals varying from 0 to 1.
Results on yeast RNase-seq data
We applied the JPGM model to infer the structure states at single-nucleotide resolution for the entire yeast transcriptome using the available V1 and S1 RNase-seq data sets (10). We downloaded the original RNase-seq data of yeast from GEO (Accession No. GSE22393) with all the replicates pooled together. There are 3196 transcripts captured with nucleotide coverage (average read count per nucleotide) ≥ 1. These are composed of 2 015 605 nucleotides cleaved by V1 and 1 498 414 nucleotides cleaved by S1. Over 1.9 million nucleotides in the 3196 transcripts are cleaved by neither V1 nor S1, leaving 43% of all nucleotides unread. As a result, when using each of these enzymes alone to probe the structure of RNA, V1 yields a relatively wider coverage of nucleotides and S1 covers a narrower range of nucleotides. But neither of them alone produces enough coverage for genome-wide probing of RNA structure. Fitting the JPGM model jointly with both the V1 and S1 data sets greatly expands the coverage of structure states for nucleotides in the 3196 transcripts.
Parameter estimation
The parameter estimations of fitting V1 and S1 jointly in the JPGM model are presented in Table 3. Notably, examining the estimated βtk (the overall level of component k on enzyme t), we found that the inferred components have interpretable meanings. On one hand, β11 = 0 > β12 = −1.02 and β11 = 0 > β21 = −2, which suggests that the first component represents the double-stranded state since the double-strand specific enzyme V1 is favored. On the other hand, β22 = 0.94 > β12 = −1.02 and β22 = 0.94 > β21 = −2, which suggests that the second component is the single-stranded state since the single-strand specific enzyme S1 is favored. To investigate whether the shared mixing effect αij plays an important role in deriving the above parameter estimates, we simplified the JPGM model to a Poisson mixture model, which does not include the accessibility αij. As shown in Table 3, the Poisson mixture model does not produce interpretable component parameters since β12 < β11 < β21. It suggests that RNase-seq data do yield useful information on RNA structure but that appropriate models (such as JPGM) are required to account for the spurious correlation between RNase-seq profiles.
Table 3. Parameter estimation using the V1 and S1 RNase-seq data sets in yeast under different model settings.
| Model |  |
 |
 |
k* |
|---|---|---|---|---|
| JPGM |  |
 |
 |
0.45 |
| Poisson mixture |  |
 |
 |
– |
By fitting the JPGM model, we obtained the posterior probabilities of the three structure states (double-strand, single-strand and inaccessible-for-cleavage) at single-nucleotide resolution across the entire yeast transcriptome. As a comparison, the log-ratio score (10) is undefined for 43% of nucleotides with neither V1 nor S1 signals. The representative structure states of each nucleotide can be predicted by assigning the structure state according to the highest posterior probability in the fitted JPGM model. Using this approach, we obtained the proportions of the three structure states in the entire yeast transcriptome, in which 64% are double-strand, 23% are single-strand and 13% are inaccessible-for-cleavage. This is consistent with the equilibrium distribution of the inferred transition probability matrix  . The structure state proportions indicate that over half of the nucleotides across the yeast transcriptome are double-stranded with just a very small portion of nucleotides representing regions that are totally inaccessible for cleavage. This suggests that RNAs need to be well-structured to support their functional roles. By comparing the initial distribution and the equilibrium distribution of the structure states, we found decreased probability of the double-strand (π1 = 0.44 versus 0.64) and increased probability of the single-strand (π2 = 0.30 versus 0.23) in the initial distribution, which is consistent with the observation that the 5′ end of transcripts are less paired compared to gene body in yeast (20). The higher probability of the inaccessible-for-cleavage state (π3 = 0.26 versus 0.13) in the initial distribution reflects the fact of limited cleavage of the 5′ end regions in RNase-seq (10).
Genome-wide assessment using computational predictions of RNAfold
We sought to assess the genome-wide predictions of RNA structure states from the JPGM model. Given that there is no established large-scale experimental benchmark for RNA structures of the whole yeast transcriptome, we constructed a genome-scale benchmark using computational prediction of RNAfold in the ViennaRNA Package 2.0 (28). Specifically, we used RNAfold to calculate the base pairing probability matrix (BPPM) for each of the 3196 yeast transcripts. Then the pairing probability of each nucleotide is calculated as the sum of the corresponding row in the BPPM of the transcript it belongs to. Note that most transcripts’ lengths are less than 2000 nt (Supplementary Figure S1) and all are well below the current length limit of RNAfold (28). We then defined a conservative set of 611 465 double-stranded nucleotides by setting a threshold of pairing probability larger than 0.99, and a conservative set of 190 753 single-stranded nucleotides with pairing probability smaller than 0.01. We set such conservative cutoffs rather than use all nucleotides so that only nucleotides with high probabilities of being paired or unpaired are used, which reduces the uncertainty. To obtain the receiver operating characteristic (ROC) curve, we varied the cutoff on the double-strand posterior probabilities outputted by the JPGM model. We calculated the sensitivities as the percentages of correctly predicted double-stranded nucleotides and specificities as the percentages of correctly predicted single-stranded nucleotides. To test whether jointly modeling the V1 and S1 data sets together outperforms modeling each data set separately, we fitted the NB model using the V1 data set alone and the S1 data set alone, respectively. Also, to test whether the sophisticated JPGM model has advantages over the simple log-ratio score approach, we varied the cutoff on the log-ratio score to calculate the sensitivities and specificities. The ROC curves of the four approaches are shown in Figure 4A. It can be seen that the JPGM model fitted with the V1 and S1 data sets jointly performs the best (area under the ROC curve (AUC) = 0.71), while the log-ratio score has the lowest accuracy (AUC = 0.58) together with the NB model fitted by the V1 data set alone. When we filtered transcripts with more stringent nucleotide coverage cutoffs 10 and 100, the AUCs of the JPGM model are consistently higher than others (Supplementary Figure S2). We also made comparisons on common regions that are cleaved by RNases (nucleotides with nonzero reads count from V1 or S1). It is shown that the JPGM model still outperforms the other three methods, while the log-ratio score performs better than modeling V1 or S1 alone when only the RNase-cleaved nucleotides are concerned (Supplementary Figure S3).
Figure 4.
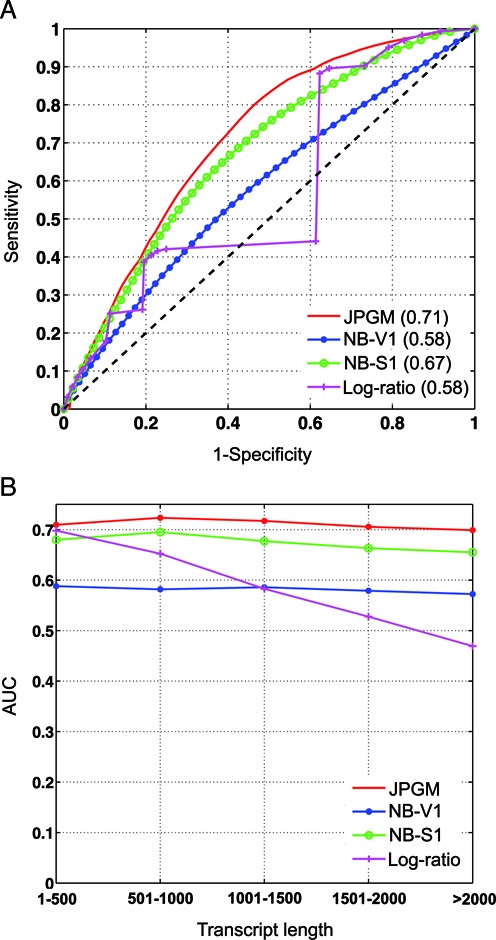
Genome-wide assessment of RNA structure inference with respect to the RNAfold benchmark. (A) The ROC curves and AUCs of the four approaches. (B) The AUCs of the four approaches under different ranges of transcript length. The transcripts are binned into five groups based on transcript length. JPGM: predictions based on the posterior probabilities of the JPGM model applied to V1 and S1 jointly; NB-V1: predictions based on the posterior probabilities of the NB model applied to V1 only; NB-S1: predictions based on the posterior probabilities of the NB model applied to S1 only; Log-ratio: predictions based on the log-ratio score of V1 versus S1 signals.
RNase cleavage conditions may be different for RNAs of different lengths (9). To investigate whether RNA structure inference from RNase-seq is affected by transcript length, we binned transcripts according to their lengths and calculated AUCs of the four methods in each binned group (Figure 4B). Clearly the JPGM model outperforms the other three in all groups and its accuracy is consistent in different length ranges. By contrast, the accuracy of the log-ratio score decreases quickly as the transcript length increases. These comparisons demonstrate that the JPGM model predicts RNA structure states from RNase-seq data more accurately than marginal methods or the log-ratio score and is less affected by transcript length.
The advantages of the JPGM model over the log-ratio score
The improved performance of the JPGM model over the log-ratio score lies in its probabilistic nature considering both the absolute and relative amounts of read counts of V1 and S1, as well as the dependence among adjacent nucleotides. To illustrate the advantages of the JPGM model, we examined seven yeast RNAs (RDN58, snR10, snR33, snR37, snR46, snR3 and snR81) with multiple alignments across species available in the Rfam database (29). We used PETfold (30), a comparative folding tool, to obtain consensus RNA structure states from multiple alignments as references. We also extracted the consensus RNA structure states directly from Rfam (29). We found that the JPGM model outperforms the other approaches, with a larger proportion of predictions validated by the PETfold or Rfam reference structures (Supplementary Figure S4). We further extracted a conservative RNase-cleaved set of 52 single-stranded nucleotides in the seven RNAs with PETfold single-strand reliability over 0.99, and 65 double-stranded nucleotides with single-strand reliability below 0.01. On this conservative benchmark data set, the validated percentage of the predictions from the JPGM model is notably higher than that from the log-ratio score, or from the NB model fitted by V1 or S1 alone (Figure 5A). Among the seven RNAs, snR81 has the lowest average nucleotide coverage as well as a high sparsity (the percentage of uncleaved nucleotides; Supplementary Table S1) and was chosen as an example to visualize predictions from JPGM and the log-ratio score at single-nucleotide level. A region within snR81 is manually selected such that the V1 and S1 read counts demonstrate notable sparsity and variability and the PETfold reference structure contains consecutive single-stranded and double-stranded nucleotides. The structure state predictions from the log-ratio score and the JPGM model were plotted along with the PETfold reference structure states for the region (Figure 5B). The log-ratio score is undefined in nucleotides with neither V1 nor S1 read counts. Thus, it makes no predictions for three nucleotides in this region (shown in gray). The JPGM model correctly predicted the structures states of all these three nucleotides comparing to the PETfold reference structure. In addition, as the log-ratio score is sensitive to small read counts, it wrongly predicts the structure states of two nucleotides (positions 94 and 99), while the JPGM model recovers them due to the consideration of dependences among adjacent nucleotides. We noticed that there is still one nucleotide that both the log-ratio score and the JPGM model predict to be single-stranded while it is double-stranded in the PETfold reference structure. The S1 signal is much stronger comparing to the V1 signal at this nucleotide. In the PETfold reference structure, this position takes the form of A-U pairing, which has only two hydrogen bonds and is less stable than G-C pairing such that it might not be stably paired in reality. Alternatively, there might be potential errors in the RNase-seq signal.
Figure 5.
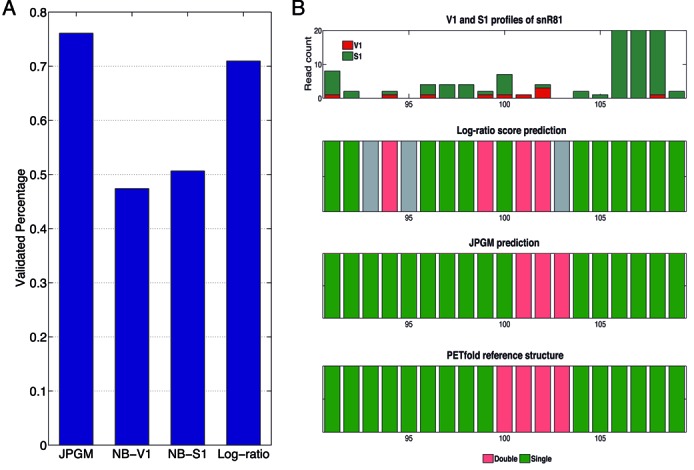
Assessment of RNA structure inference with respect to the PETfold benchmark. (A) The validation proportions of predictions on RNase-cleaved nucleotides in the seven RNAs based on conservative PETfold reliability cutoffs. (B) Illustration of the improved prediction of the JPGM model over the log-ratio score on 91–109 nucleotides of the snR81 RNA. The top row shows the stacked bar plot of V1 and S1 signals per nucleotide. The other three rows are structure states from the log-ratio score, the JPGM model and the PETfold reference structure. For the log-ratio score, a cutoff of zero is used for calling the structure state. For JPGM, NB-V1 and NB-S1, the structure states are inferred by the maximum posterior probabilities. Red represents double-strand state. Green represents single-strand state. Gray represents nucleotides missed by the log-ratio score.
Structure states of nucleotides with overlapping V1 and S1 cleavage sites
We further examined the structure states of ≈300 000 nucleotides with overlapping cleavage sites of V1 and S1 (10). These nucleotides are either ‘unstable’ (having multiple conformations) or in single-stranded regions that can also be cleaved by RNase V1. These two scenarios can not be distinguished by the log-ratio score (Figure 6A). To distinguish between these hypotheses, we plotted the distribution of the posterior probabilities of the double-strand state (i.e. the paring probabilities) resulted from the JPGM model over the ≈300 000 nucleotides. Intriguingly, the ‘bell’ shape of the pairing probabilities suggests that most of these nucleotides are in one dominant structure state (Figure 6B). There are about three quarters of nucleotides with a pairing probability lower than 0.1 or higher than 0.9. We further examined the pairing probabilities of all nucleotides of the yeast transcriptome outputted by the JPGM model (Figure 6C). We found that the nucleotides with overlapping V1 and S1 cleavage sites have a larger percentage of single-strand state comparing to all nucleotides. There is still a small percentage of nucleotides without obvious structure preference, which may represent those in multiple structure conformations.
Figure 6.
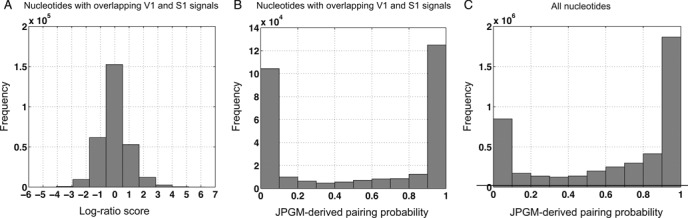
Comparison of the log-ratio score and the JPGM-derived base pairing probabilities. (A) Histogram of the log-ratio scores for the nucleotides with overlapping V1 and S1 cleavage sites; (B) Histogram of the base pairing probabilities derived from the JPGM model for the nucleotides with overlapping V1 and S1 cleavage sites; and (C) Histogram of the base pairing probabilities derived from the JPGM model for all nucleotides in the yeast transcriptome.
RNA accessibility
We next investigated whether the RNA accessibility αij inferred by the JPGM model may reflect RNA 3D structure conformation. To test this, we used Chimera (31) to calculate the solvent accessible surface area (SASA) for each nucleotide of the tRNA tE-UUC-B given its available crystal structure in the Protein Data Bank database (ID: 486D-E) (32). Higher SASA of a nucleotide indicates higher accessibility to a solvent. We found a positive correlation (SCC = 0.19 and one-sided t-test P-value = 0.10) between SASA and αij. We also collected seven RNAs with known secondary structures and used RNAcomposer (33) to computationally predict their tertiary structures and calculated the SASA values. The SCCs between the SASA values and αij are all positive and most of the P-values are low (Table 4). We also calculated an alternative measurement of 3D structure conformation, the nearest neighbor density estimation (KDE), for each nucleotide based on the tertiary structures predicted by RNAComposer. The higher the KDE is, the more compact and less accessible the nucleotide is within a local region. The SCCs between the KDE values and αij are listed in Table 4. Consistently, all the SCCs show negative correlations and low P-values. Although the correlation coefficients are not very high, the consistently low P-values across these RNAs exhibit a significant association between the inferred RNA accessibility and the two measurements of RNA 3D structure confirmation. It suggests that the RNA accessibility αij derived by the JPGM model is associated with the 3D structure conformation of RNAs, i.e. the higher the αij is, the less crowded the local region of a nucleotide tends to be. In Figure 7, we plotted the αij values as a color scale to overlay with the 3D structure of the snR33 RNA. It displays lower RNA accessibility in tightly packed regions and higher accessibility in loose regions. The low (but significant) correlations suggest that RNA structure profiling using RNases (such as V1 and S1) may be influenced by the 3D conformations of RNAs. Therefore, the effect of 3D conformations of RNAs should be taken into account when interpreting RNase-seq data.
Table 4. Correlation between αij and the RNA 3D structure measurements SASA and KDE.
| RNA | Cor-SASA | P-value | Cor-KDE | P-value |
|---|---|---|---|---|
| RDN58-2 | 0.1069 | 0.1094 | -0.1938 | 0.0124 |
| SNR10 | 0.0736 | 0.1377 | -0.1527 | 0.0116 |
| SNR37 | 0.0970 | 0.0332 | -0.1732 | 0.0005 |
| SNR33 | 0.2612 | 0.0005 | -0.4049 | 0.0000 |
| SNR46 | 0.2095 | 0.0029 | -0.3146 | 0.0000 |
| SNR53 | 0.2214 | 0.0672 | -0.2449 | 0.0486 |
| SNR81 | 0.0164 | 0.4253 | -0.1086 | 0.1056 |
Figure 7.
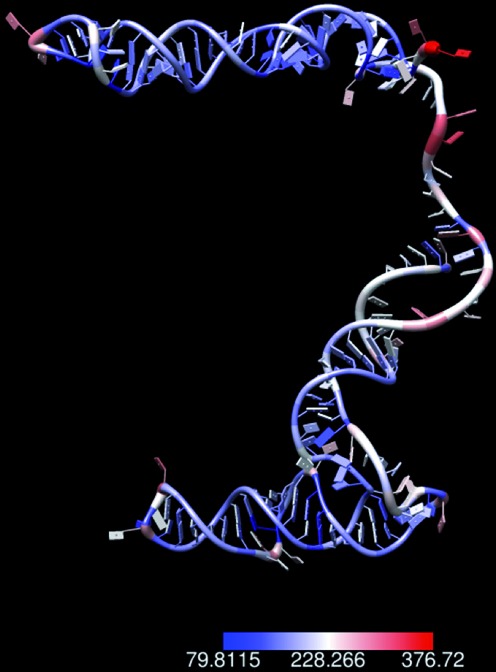
Overlay of RNA accessibilities estimated by the JPGM model on the 3D structure of snR33
DISCUSSION
In this study, we have developed the JPGM model to infer RNA structures from joint modeling of complementary RNase-seq profiles. The JPGM model captures the correlation and variability of different RNases and the local dependence among adjacent nucleotides along the transcripts. We applied it to analyze the RNase-seq data of V1 and S1 jointly in the yeast transcriptome. It extracts interpretable structural features ab initio from the ‘noisy’ nucleotide-level read counts at the genome scale. Our model surmounts the drawbacks of approaches that analyze V1 or S1 alone, or simple take the log-ratio of the two signals. We have demonstrated that the JPGM model correctly predicts a much greater number of nucleotides while achieves higher accuracy than other alternatives. Our work illustrates the benefit of integrative modeling of complementary RNase-seq data (i.e. from both double-strand specific the single-strand specific RNases) for more accurate inference of RNA structure. In general, our methodology is widely applicable to analyze both in vitro and in vivo (15,34) RNase-seq data for RNA structure analysis in any transcriptome. With extensions, our approach can also be adapted to analyze other genomic or transcriptomic profiles generated from high-throughput sequencing.
We have used a conservative subset of RNAfold-derived structure states as a benchmark for genome-wide assessment. Comparative folding, although limited in the number of RNAs in Rfam, is a promising alternative. Compared to folding a single sequence, comparative folding algorithms such as PETfold combines conservation information across species and may achieve higher quality. As RNAs available for comparative folding grow in number, it will provide a valuable resource for large-scale validation of high-throughput RNA structure profiling analysis methods.
One of the major advantages of the JPGM model over previous approaches (such as the log-ratio score) is its inferential nature. It models multiple RNase-seq data sets with a unified probabilistic framework. It outputs the posterior probabilities of different structure states for all nucleotides simultaneously, which can then be prioritized into specific classes using the maximum posterior probability. The JPGM framework specifically models the correlation between multiple RNase-seq profiles, as well as local dependence among adjacent nucleotides, which are lacking in previous approaches.
The JPGM model is able to learn multiple RNA structure state components automatically. In principle, it can be generalized to learn any number of components. When applied to the yeast RNase-seq data, the JPGM model learns three components, which represent three structure states (double-strand, single-strand and inaccessible-for-cleavage). Only a small proportion of nucleotides have roughly equal posterior probabilities of being either unpaired or paired states, some of which may possess multiple conformations. In a more dynamic environment, such as living cells, more components may be explored to fully capture the complex configurations of RNA structures.
The HMM implementation of the JPGM model is a simplification of the structural associations among adjacent nucleotides in one transcript. When more data are available, such as the footprint sequencing profiles of more diverse types of RNases, it can be extended to capture more complex dependence structures among nucleotides. As the first approach to capture the dependence among adjacent nucleotides, the JPGM model already demonstrates dramatic improvement over previous approaches such as the simple log-ratio score.
When applying the JPGM model to the yeast RNase-seq data sets, we obtain the first genome-wide estimation of RNA accessibilities through the latently modeled variable αij, which is shown to be associated with RNA 3D structure conformation. It points to the potential influence of RNA 3D structure on RNase cleavage. The low correlations suggest that there might also be other effects, such as additional experimental factors or sequence bias that affect RNase cleavage. While the 3D structures of RNAs are largely unavailable, the genome-wide measurements of RNA accessibility may play an important role for dissecting the functional elements encoded in RNAs and deepening our understanding on the global RNA regulation.
SUPPLEMENTARY DATA
Supplementary Data are available at NAR Online.
Acknowledgments
We thank Yuping Zhang for critical reading and commenting on the manuscript. We also thank the IT support of The Jackson Laboratory for Genomic Medicine and the University of Connecticut for assistance.
FUNDING
The Jackson Laboratory for Genomic Medicine [to Z.O.]. Funding for open access charge: The Jackson Laboratory for Genomic Medicine [to Z.O.].
Conflict of interest statement. None declared.
REFERENCES
- 1.Yoav A., Yulei W., John D.S., Chih Long L., Patrick O.B., Daniel H. Genome-wide analysis of mRNA translation profiles in Saccharomyces cerevisiae. Proc. Natl. Acad. Sci. U.S.A. 2003;100:3889–3894. doi: 10.1073/pnas.0635171100. [DOI] [PMC free article] [PubMed] [Google Scholar]
- 2.Ding Y., Lawrence C.E. A Bayesian statistical algorithm for RNA secondary structure prediction. Comput. Chem. 1999;23:387–400. doi: 10.1016/s0097-8485(99)00010-8. [DOI] [PubMed] [Google Scholar]
- 3.Mathews D.H., Sabina J., Zuker M., Turner D.H. Expanded sequence dependence of thermodynamic parameters improves prediction of RNA secondary structure. J. Mol. Biol. 1999;288:911–940. doi: 10.1006/jmbi.1999.2700. [DOI] [PubMed] [Google Scholar]
- 4.Zuker M., Stiegler P. Optimal computer folding of large RNA sequences using thermodynamic and auxiliary information. Nucleic Acids Res. 1981;9:133–148. doi: 10.1093/nar/9.1.133. [DOI] [PMC free article] [PubMed] [Google Scholar]
- 5.Zuker M. Mfold web server for nucleic acid folding and hybridization prediction. Nucleic Acids Res. 2003;31:3406–3415. doi: 10.1093/nar/gkg595. [DOI] [PMC free article] [PubMed] [Google Scholar]
- 6.Guo F., Gooding A.R., Cech T.R. Structure of the Tetrahymena ribozyme: base triple sandwich and metal ion at the active site. Mol. Cell. 2004;16:351–362. doi: 10.1016/j.molcel.2004.10.003. [DOI] [PubMed] [Google Scholar]
- 7.Latham M.P., Brown D.J., McCallum S.A., Pardi A. NMR methods for studying the structure and dynamics of RNA. Chembiochem. 2005;6:1492–1505. doi: 10.1002/cbic.200500123. [DOI] [PubMed] [Google Scholar]
- 8.Mueller F., Sommer I., Baranov P., Matadeen R., Stoldt M., Wöhnert J., Görlach M., van Heel M., Brimacombe R. The 3D arrangement of the 23S and 5S rRNA in the Escherichia coli 50 S ribosomal subunit based on a cryo-electron microscopic reconstruction at 7.5 A resolution. J. Mol. Biol. 2000;298:35–59. doi: 10.1006/jmbi.2000.3635. [DOI] [PubMed] [Google Scholar]
- 9.Westhof E., Romby P. The RNA structurome: high-throughput probing. Nat. Methods. 2010;7:965–967. doi: 10.1038/nmeth1210-965. [DOI] [PubMed] [Google Scholar]
- 10.Kertesz M., Wan Y., Mazor E., Rinn J.L., Nutter R.C., Chang H.Y., Segal E. Genome-wide measurement of RNA secondary structure in yeast. Nature. 2010;467:103–107. doi: 10.1038/nature09322. [DOI] [PMC free article] [PubMed] [Google Scholar]
- 11.Underwood J.G., Uzilov A.V., Katzman S., Onodera C.S., Mainzer J.E., Mathews D.H., Lowe T.M., Salama S.R., Haussler D. FragSeq: transcriptome-wide RNA structure probing using high-throughput sequencing. Nat. Methods. 2010;7:995–1001. doi: 10.1038/nmeth.1529. [DOI] [PMC free article] [PubMed] [Google Scholar]
- 12.Lucks J.B., Mortimer S.A., Trapnell C., Luo S., Aviran S., Schroth G.P., Pachter L., Doudna J.A., Arkin A.P. Multiplexed RNA structure characterization with selective 2′-hydroxyl acylation analyzed by primer extension sequencing (SHAPE-Seq) Proc. Natl. Acad. Sci. U.S.A. 2011;108:11063–11068. doi: 10.1073/pnas.1106501108. [DOI] [PMC free article] [PubMed] [Google Scholar]
- 13.Wan Y., Qu K., Ouyang Z., Kertesz M., Li J., Tibshirani R., Makino D.L., Nutter R.C., Segal E., Chang H.Y. Genome-wide measurement of RNA folding energies. Mol. Cell. 2012;48:169–181. doi: 10.1016/j.molcel.2012.08.008. [DOI] [PMC free article] [PubMed] [Google Scholar]
- 14.Li F., Zheng Q., Ryvkin P., Dragomir I., Desai Y., Aiyer S., Valladares O., Yang J., Bambina S., Sabin L.R., et al. Global analysis of RNA secondary structure in two metazoans. Cell Rep. 2012;1:69–82. doi: 10.1016/j.celrep.2011.10.002. [DOI] [PubMed] [Google Scholar]
- 15.Wan Y., Qu K., Zhang Q.C., Flynn R.A., Manor O., Ouyang Z., Zhang J., Spitale R.C., Snyder M.P., Segal E., Y C.H. Landscape and variation of RNA secondary structure across the human transcriptome. Nature. 2014;505:706–709. doi: 10.1038/nature12946. [DOI] [PMC free article] [PubMed] [Google Scholar]
- 16.Rouskin S., Zubradt M., Washietl S., Kellis M., Weissman J.S. Genome-wide probing of RNA structure reveals active unfolding of mRNA structures in vivo. Nature. 2014;505:701–705. doi: 10.1038/nature12894. [DOI] [PMC free article] [PubMed] [Google Scholar]
- 17.Ding Y., Tang Y., Kwok C.K., Zhang Y., Bevilacqua P.C., Assmann S.M. In vivo genome-wide profiling of RNA secondary structure reveals novel regulatory features. Nature. 2014;505:696–700. doi: 10.1038/nature12756. [DOI] [PubMed] [Google Scholar]
- 18.Spitale R.C., Flynn R.A., Zhang Q.C., Crisalli P., Lee B., Jung J.W., Kuchelmeister H.Y., Batista P.J., Torre E.A., Kool E.T., et al. Structural imprints in vivo decode RNA regulatory mechanisms. Nature. 2015;519:486–490. doi: 10.1038/nature14263. [DOI] [PMC free article] [PubMed] [Google Scholar]
- 19.Deigan K.E., Li T., Mathews D.H., Weeks K.M. Accurate SHAPE-directed RNA structure determination. Proc. Natl. Acad. Sci. U.S.A. 2009;106:97–102. doi: 10.1073/pnas.0806929106. [DOI] [PMC free article] [PubMed] [Google Scholar]
- 20.Ouyang Z., Snyder M.P., Chang H.Y. SeqFold: genome-scale reconstruction of RNA secondary structure integrating high-throughput sequencing data. Genome Res. 2013;23:377–387. doi: 10.1101/gr.138545.112. [DOI] [PMC free article] [PubMed] [Google Scholar]
- 21.Washietl S., Hofacker I.L., Stadler P.F., Kellis M. RNA folding with soft constraints: reconciliation of probing data and thermodynamic secondary structure prediction. Nucleic Acids Res. 2012;40:4261–4272. doi: 10.1093/nar/gks009. [DOI] [PMC free article] [PubMed] [Google Scholar]
- 22.Kourosh Z., Michelle M.M., Ivan D., Jeffrey H.C., Peter C. Integrating chemical footprinting data into RNA secondary structure prediction. PLoS One. 2012;7:e45160. doi: 10.1371/journal.pone.0045160. [DOI] [PMC free article] [PubMed] [Google Scholar]
- 23.Wan Y., Qu K., Ouyang Z., Chang H.Y. Genome-wide mapping of RNA structure using nuclease digestion and high-throughput sequencing. Nat. Protoc. 2013;8:849–69. doi: 10.1038/nprot.2013.045. [DOI] [PubMed] [Google Scholar]
- 24.Li X., Quon G., Lipshitz H.D., Morris Q. Predicting in vivo binding sites of RNA-binding proteins using mRNA secondary structure. RNA. 2010;16:1096–1107. doi: 10.1261/rna.2017210. [DOI] [PMC free article] [PubMed] [Google Scholar]
- 25.Kazan H., Ray D., Chan E.T., Hughes T.R., Morris Q. RNAcontext: a new method for learning the sequence and structure binding preferences of RNA-binding proteins. PLoS Comput. Biol. 2010;6:e1000832. doi: 10.1371/journal.pcbi.1000832. [DOI] [PMC free article] [PubMed] [Google Scholar]
- 26.Lowman H.B., Draper D.E. On the recognition of helical RNA by cobra venom VI nuclease. J. Biol. Chem. 1986;261:5396–5403. [PubMed] [Google Scholar]
- 27.Rabiner L.R. A tutorial on hidden Markov models and selected applications in speech recognition. Proc. IEEE. 1989;77:257–286. [Google Scholar]
- 28.Lorenz R., Bernhart S.H., Zu Siederdissen C.H., Tafer H., Flamm C., Stadler P.F., Hofacker I.L. ViennaRNA Package 2.0. Algorithms Mol. Biol. 2011;6:26. doi: 10.1186/1748-7188-6-26. [DOI] [PMC free article] [PubMed] [Google Scholar]
- 29.Griffiths-Jones S., Bateman A., Marshall M., Khanna A., Eddy S.R. Rfam: an RNA family database. Nucleic Acids Res. 2003;31:439–441. doi: 10.1093/nar/gkg006. [DOI] [PMC free article] [PubMed] [Google Scholar]
- 30.Seemann S.E., Menzel P., Backofen R., Gorodkin J. The PETfold and PETcofold web servers for intra-and intermolecular structures of multiple RNA sequences. Nucleic Acids Res. 2011;39(suppl 2):W107–W111. doi: 10.1093/nar/gkr248. [DOI] [PMC free article] [PubMed] [Google Scholar]
- 31.Pettersen E.F., Goddard T.D., Huang C.C., Couch G.S., Greenblatt D.M., Meng E.C., Ferrin T.E. UCSF Chimera–a visualization system for exploratory research and analysis. J. Comput. Chem. 2004;25:1605–1612. doi: 10.1002/jcc.20084. [DOI] [PubMed] [Google Scholar]
- 32.Berman H.M., Westbrook J., Feng Z., Gillil G., Bhat T.N., Weissig H., Shindyalov I.N., Bourne P.E. The Protein Data Bank. Nucleic Acids Res. 2000;28:235–242. doi: 10.1093/nar/28.1.235. [DOI] [PMC free article] [PubMed] [Google Scholar]
- 33.Popenda M., Szachniuk M., Antczak M., Purzycka K.J., Lukasiak P., Bartol N., Blazewicz J., Adamiak R.W. Automated 3D structure composition for large RNAs. Nucleic Acids Res. 2012;40:e112. doi: 10.1093/nar/gks339. [DOI] [PMC free article] [PubMed] [Google Scholar]
- 34.Gosai S.J., Foley S.W., Wang D., Silverman I.M., Selamoglu N., Nelson A.D., Beilstein M.A., Daldal F., Deal R.B., Gregory B.D. Global analysis of the RNA–protein interaction and RNA secondary structure landscapes of the Arabidopsis nucleus. Mol. Cell. 2015;57:1–13. doi: 10.1016/j.molcel.2014.12.004. [DOI] [PMC free article] [PubMed] [Google Scholar]
Associated Data
This section collects any data citations, data availability statements, or supplementary materials included in this article.