


Abstract
APOBEC3G (A3G) DNA deaminase activity requires a holoenzyme complex whose assembly on nascent viral reverse transcripts initiates with A3G dimers binding to ssDNA followed by formation of higher-order A3G homo oligomers. Catalytic activity is inhibited when A3G binds to RNA. Our prior studies suggested that RNA inhibited A3G binding to ssDNA. In this report, near equilibrium binding and gel shift analyses showed that A3G assembly and disassembly on ssDNA was an ordered process involving A3G dimers and multimers thereof. Although, fluorescence anisotropy showed that A3G had similar nanomolar affinity for RNA and ssDNA, RNA stochastically dissociated A3G dimers and higher-order oligomers from ssDNA, suggesting a different modality for RNA binding. Mass spectrometry mapping of A3G peptides cross-linked to nucleic acid suggested ssDNA only bound to three peptides, amino acids (aa) 181–194 in the N-terminus and aa 314–320 and 345–374 in the C-terminus that were part of a continuous exposed surface. RNA bound to these peptides and uniquely associated with three additional peptides in the N- terminus, aa 15–29, 41–52 and 83–99, that formed a continuous surface area adjacent to the ssDNA binding surface. The data predict a mechanistic model of RNA inhibition of ssDNA binding to A3G in which competitive and allosteric interactions determine RNA-bound versus ssDNA-bound conformational states.
INTRODUCITON
In 2002, Sheehy et al. (1) demonstrated that apolipoprotein B mRNA editing enzyme catalytic polypeptide-like 3G (APOBEC3G or A3G) was the cellular factor responsible for the restriction of HIV-1 lacking functional viral infectivity factor or Vif (2). The most effective mechanism for A3G-mediated viral restriction was through its ability to mutate deoxycytidine (dC) in single-stranded DNA (ssDNA) to create deoxyuridine (dU) on minus strand viral cDNA which templates deoxyguanidine (dG) to deoxyadenine (dA) hypermutation during second strand synthesis (3–6,7). Access to the reverse transcription complexes was ensured by assembly of A3G within nascent viral particles through A3G interactions with viral genomic RNA, cellular 7SL RNA as well as with Gag (8–16). The dC to dU mutations were introduced irregularly with an overall 3′–5′ gradient along the nascent first strand cDNA (4,17). Mechanisms for the deaminase-dependent reduction in viral infectivity include proviral DNA degradation resulting from dC to dU hypermutation of proviral first strand DNA or the expression of truncated, mis-folded or otherwise non-functional viral proteins as a result of dG to dA hypermutation of viral open reading frames (2,18). Deaminase-independent mechanism for the reduction in viral replication and integration also have been characterized (2).
Vif binding to and targeting of A3G for polyubiquitination and proteosomal degradation is the principal viral defense against host cell restriction by A3G (19–22). However, cellular mechanisms also render A3G unable to participate in host-defense. The most notable of which is sequestering of A3G in ribonucleoprotein particles (RNP) (23,24,25). RNAs 25 nt in length or longer can inhibit A3G ssDNA binding and dC deaminase activity in vitro (26). In vivo, the predominant form of A3G in several cell types is as RNP within cytoplasmic P-bodies (23,27,28) associated with diverse cellular RNAs with little or no sequence preference (26,29,30). Once localized to P-bodies, A3G does not contribute to host cell retroviral defense (24,27,28,31). Paradoxically, assembly with nascent virions, which is required for viral restriction, involves oligomerization of newly synthesized A3G molecules on viral RNA and cellular 7SL RNA (9,11,13,32,33). This apparent duality of A3G RNP function is poorly understood, though likely a function of the non-specific nature of A3G's association with RNA (23,27,28) combined with A3G association with HIV Gag (15,34,35) that allows it to specifically infiltrate HIV viral particles.
Cytidine deaminase activity can be restored to cellular A3G following in vitro RNase A digestion (36). RNA bound to A3G that is assembled within viral particles also inhibits A3G deaminase activity. However, deaminase activity of A3G in virions is recovered post-entry following RNase H removal of HIV genomic RNA during reverse transcription (8). Although the field understands that catalytically active A3G requires homo oligomerization on ssDNA and that catalytically inactive A3G also forms homo oligomers on RNA (26,37–39), the mechanism of RNA inhibition of A3G catalytic activity is poorly understood and complicated by the lack of structural data.
In this study, we address the mechanism of RNA binding to A3G and describe the mechanism for RNA inhibition of A3G binding to ssDNA under defined in vitro conditions using a combination of biophysical approaches and structural modeling. Quantification of A3G binding to ssDNA and RNA suggested different binding modalities. The physical nature of these interactions was evaluated using mass spectrometry (MS) analysis of tryptic peptides from native A3G:nucleic acid complexes that were covalently stabilized through UV irradiation-induced cross-linking. The data suggested that ssDNA bound adjacent to the zinc-dependent catalytic core domain in the C-terminus and within an exposed surface that extended to an N-terminal region of A3G, here-to-fore not implicated in ssDNA binding. The data provided a rational explanation for why the C-terminal half of A3G alone was not efficient in ssDNA binding and deaminase activity required for antiviral activity in infected cells (40–43) but it is still not clear why the C-terminal half of A3G supported ssDNA deaminase activity in the bacteria-based Rifampicin sensitivity reversion assay (44). MS analysis suggested that RNA bound to the C-terminal half of A3G. This is a novel observation and suggests that RNA may act as a competitive inhibitor of ssDNA binding to A3G. We also identified peptides that were uniquely cross-linked to RNA within the N-terminus of A3G. Interestingly, these peptides were predicted to form an exposed continuous surface within the N-terminus that was juxtaposed to the surface predicted to bind to both ssDNA and RNA. We predict that these interactions with RNA may induce conformational constraints that allosterically inhibit A3G binding to ssDNA. The observations in this study support a mechanism of competitive and allosteric RNA inhibition of A3G deaminase activity that will be relevant for understanding anti-retroviral host defense.
MATERIALS AND METHODS
APOBEC3G (A3G) preparation
The open reading frame of wild type and full length human A3G (accession # NM_021822) with a C-terminal 4-His tag was cloned into pFastbac (Invitrogen) using NheI and XhoI and verified by DNA sequencing. Protein was expressed in Sf9 cells by Immunodiagnostics Inc (Waltham, MA) and provided as frozen cell pellets for A3G purification as previously described (36) (see Supplemental Methods).
5′ labeling of oligonucleotides
The oligonucleotides used for electrophoretic mobility shift assays (EMSA) and primer extension reactions (Table 1) were 5′ end radiolabeled with 32P- γ-ATP (6000 Ci/mmol) using T4 polynucleotide kinase (Roche) and purified using 15% denaturing PAGE. Fluorescently labeled oligonucleotides used for EMSA and fluorescence anisotropy were purchases as 5′ end C6-NH3 linker modified oligos (IDT) and incubated for 12 h at 24°C with Alexa Fluor® 647 succinimidyl ester in 0.1 M sodium tetraborate buffer (pH 8.5) followed by purification with 15% denaturing PAGE.
Table 1. Oligonucleotide List.
| ssDNA oligonucleotides: |
| 15 nt iSub ssDNA with one BrdU substitution: |
| 5′-TTATTBrdUUUAAGGATT-3′ |
| 25 nt Sub ssDNA with one BrdU substitution: 5-′TTATTBrdUUUAAGGATTTATTTATTTA-3′ |
| 99 nt ssDNA with one BrdU substitution: |
| 5′-GGGAACAAAAGCTGGGTACCGGGCCCCCCCTCGAGGTTTATTBrdUUUAAGGATTTATTTATTTATGATCAGTATATTAA AGATAGTTATGATTTACAAGCT-3′ |
| 99 nt ssDNA with three BrdU substitution: |
| 5′-GGGAACAAAAGCTTBrdUUUACCGGGCCCCCCCTCGAGGTTTATTBrdUUUAAGGATTTATTTATTTATGATC AGTATATTAAAGATTTBrdUUUAGATTTA CAAGCT-3′ |
| AlexaFluor647® labeled 15 nt Sub ssDNA: |
| 5′- A647-TTATTUUUAAGGATT-3′ |
| AlexaFluor647® labeled 25 nt Sub ssDNA: |
| 5′- A647-TTATTUUUAAGGATTTATTTATTTA-3′ |
| RNA oligonucleotides: |
| 15 nt iiSub RNA: |
| 5′-UUAUUUUUAAGGAUU-3′ |
| 25 nt Sub RNA: |
| 5′-UUAUUUUUAAGGAUUUAUUUAUUUA-3′ |
| 25 nt Sub RNA with one BrdU substitution: |
| 5′-UUAUUBrdUUUAAGGAUUUAUUUAUUUA-3′ |
| AlexaFluor647® labeled 15 nt Sub RNA: |
| 5′- A647-UUAUUUUUAAGGAUU-3 |
| AlexaFluor647® labeled 25 nt Sub RNA: |
| 5′-A647-UUAUUUUUAAGGAUUUAUUUAUUUA-3′ |
| 25 nt ApoB RNA: |
| 5′-CAUAUAUGAUACAAUUUGAUCAGUA-3′ |
| 99 nt ApoB RNA: |
| 5′-GGGAACAAAAGCUGGGUACCGGGCCCCCCCUCGAGGUCGAUGCAGACAUAUAUGAUACAAUUUGAUCAGUAUAAAGAUAGU UAUGACCGGGCGCGGUGGCGCGCGCC-3′ |
(i) Sub DNA, a substrate ssDNA sequence that supports A3G dC to dU deamination. (ii) Sub RNA, a ribonucleic acid with the same base sequence as the corresponding Sub DNA of the same length.
A3G assembly with nucleic acids
Complexes of A3G and nucleic acid were prepared by incubating the indicated amounts of A3G and the indicated molar ratios of unlabeled or 32P- or AlexaFluor® 647-labeled oligonucleotides (Table 1) in deaminase buffer (1XDB, 40 mM Tris pH 7.2, 50 mM NaCl, 10 mM MgCl2, 1 mM DTT, 0.1% Triton X-100, 2% glycerol) for 20 min at 37°C. In competition analyses, the indicated concentrations of unlabeled competitor RNA or ssDNA were pre-incubated with A3G for 5 min at 37°C prior to the incubation of labeled oligonucleotides for an additional 20 min at 37°C. Complexes assembled in each reaction condition were resolved on a 5% native gel (26,39) and visualized using a Typhoon™ phosphorimager (GMI) by excitation at 633 nm and measuring fluorescence at 670 nm when fluorescent ssDNA was used. Radiolabeled samples were exposed to phosphorimager screens and quantified by Phosphorimager scanning densitometry.
For quantification of the EMSA images, the densitometric values from the Phosphorimager scans for free ssDNA, C1 and C3 complexes were added as the total ssDNA signal in each titration (per gel lane) and this sum was divided into the densitometric value of free ssDNA, C1 or C3 in order to determine the ‘relative’ amount of ssDNA within each electrophoretic mobility of ssDNA. These relative values were acquired from triplicate titration experiments, averaged and the standard error of the mean (SEM) determined.
Equilibrium fluorescence anisotropy
Alexa Fluor® 647 labeled ssDNA or RNA (Table 1) were added to each reaction at a fixed concentration of 2 nM with 0–100 nM A3G for 20 min at 37°C in 1XDB. Fluorescence anisotropy measurements were carried out using a Fluormax-4 Spectrofluorometer (HORIBA). Anisotropy measurements (ex = 647 nm, em = 670 nm) with 5 nm band passes were made in triplicate and mean values were reported. The change in anisotropy was calculated by subtracting the average anisotropy of the free 5′- labeled ssDNA or RNA from the average anisotropy of the A3G: nucleic acid assembly reactions. The change in anisotropy as measured in triplicate in two separate studies (n = 6) was plotted against [A3G]. The Kd was calculated through non-linear regression by fitting the data to Eq. (1), where A3G:NA is the fraction of A3G bound to nucleic acid (NA).
 |
(1) |
Equilibrium competition analyses employed 2 nM Alexa Fluor® 647 labeled ssDNA incubated with A3G and unlabeled ssDNA or RNA. Change in average anisotropy was plotted against the unlabeled competitor nucleic acid concentration. Through non-linear regression analysis the data were fit to Eq. (2) and the IC50 was determined.
 |
(2) |
Deaminase assay and quantification
In a standard cytidine deaminase (CD) assay, ssDNA substrate (0.2 μM) was incubated with A3G (1.75 μM) for 40 min in 1XDB at 37°C. RNA competition studies were performed as described above followed by a standard CD assay. After incubation with the ssDNA substrate, the reaction was stopped by the addition of an equal volume of 2X stop buffer (0.1 M Tris pH 7, 0.01 M EDTA, 0.4% SDS, 0.2 M NaCl, 0.2 mg/ml Proteinase K, 0.1 mg/ml E. coli tRNA). Substrate was then purified using phenol/chloroform/isoamylalcohol (50:49:1) and ethanol precipitation. Poisoned primer extension products were resolved with 15% denaturing PAGE and quantified with a Typhoon™ phosphorimager as recently described (39). The percent deamination was calculated by dividing the band volume of the deaminated substrate (dU) by the total band volume of deaminated and unmodified substrates (dU+dC). The data shown are representative of four independent determinations.
UV-induced cross-linking of nucleic acids to A3G protein
A3G was assembled with nucleic acid at 4:1 molar ratio (if not indicated otherwise) in 1XPBS at 37°C for 20 min and cooled on ice. Complexes assembled with BrdU-modified oligonucleotides (Table 1) were then irradiated for 20 min with medium wavelength UV light (302 nm) (45,46), while those assembled with RNA oligonucleotides were irradiated with short wavelength UV light (254 nm) (47). The A3G cross-linked products were separated with 12% SDS PAGE and visualized after staining with Coomassie SimpleBlue SafeStain (Life Technologies) as proteins bands with slower mobility in the gel as compared to the mobility of uncross-linked and monomeric A3G. Protein cross-linked to BrdU ssDNA oligonucleotides migrated as a band 5–6 kDa larger than uncross-linked A3G whereas A3G cross-linked to RNA had a more marked reduction in mobility causing these bands to be positioned near the top of the resolving gel. In control experiments, AlexaFluor ® 647-labeled oligonucleotides were cross-linked to A3G and resolved by 12% SDS PAGE and visualized using a Typhoon™ phosphorimager by excitation at 633 nm and measuring fluorescence at 670 nm to validate that the shifted bands were due to conjugation of A3G with nucleic acids.
Preparation of A3G for mass spectrometry
Nucleic acid-free A3G and A3G cross-linked to nucleic acid were cut from SDS-PAGE gels and washed three times in 20 mM Tris pH 7.5 2.5 mM MgCl2 (for ssDNA cross-linking) or in 25 mM Tris pH 7.5 2 mM EDTA (for RNA cross-linking) and processed as described in Supplemental Methods. MS analysis of tryptic peptides was performed using LTQ Orbitrap XL (Thermo Fisher Scientific) analysis, a nano-HPLC system (Easy-nLC II, Thermo Fisher Scientific) coupled to the electrospray ionization source of an LTQ Orbitrap XL mass spectrometer (Thermo Fisher Scientific). Data were collected as RAW files and converted to .mgf files using Bioworks Browser. Resultant .mgf were imported into ProteinScape (Bruker Daltonics) and searched via MASCOT files (MatrixScience). Search parameters included: trypsin as an enzyme; three missed cleavages; 0.05 Da for MS and MS/MS data from the LTQ Obitrap XL (1 for #13C, +2; +3 for charge state), decoy search and acceptance criteria of a minimum one peptide greater than identity score (minimum score of 15). The False Discovery Rate was less than 5%. The high number of missed cleavages was chosen using the assumption that trypsin might not cut at a modified residue, as modified residues would not fit in the trypsin active site. A non-redundant list of identified peptides was compiled with ProteinExtractor. Matched spectra were manually validated using BioTools (Bruker Daltonics).
Modeling of A3G peptides cross-linked with 25 nt nucleic acids
A3G peptides implicated by mass spectroscopy analysis in binding to 25 nt RNA and ssDNA were mapped on the crystal structure of the A3G C-terminal half (PDB 3IR2, (48)) and on a homology model of the wild-type sequence of the A3G N-terminal half generated with the automated mode of SWISS-MODEL (49) using the NMR structure (60) PDB 2MZ of a solubilized A3G N-terminal variant comprising 80% sequence identity with the wild-type A3G N-terminal half, as the template. Cartoon and surface-rendered images were generated with PyMol (50).
RESULTS
A3G binds to ssDNA and RNA with similar affinity
We previously demonstrated that RNAs as short as 15 nt bound to A3G however only RNAs ≥25 nt inhibited A3G binding ssDNA and deoxycytidine deaminase activity (26). RNA inhibition of A3G deaminase activity was previously shown to lack sequence specificity (26,29) but we show here that RNA inhibition is concentration dependent (Supplemental Figure S1). Mechanistic details for RNA inhibition of A3G ssDNA deaminase activity are lacking. Therefore we determined the dissociation constants (Kd) of A3G by fluorescence anisotropy (FA) using Alexa Fluor 647 labeled 25 nt ssDNA and 25 nt RNA of comparable sequences (Table 1). A3G bound to 25 nt ssDNA and RNA with low nM affinities (Kd of 3.8 nM ± 0.8 SEM compared to 2.9 nM ± 0.6 SEM (n = 6), respectively) (Figure 1A and B). Reducing the length of ssDNA and RNA to 15 nt measurably reduced A3G binding affinities but these remained in the low nM range (Kd of 10 nM ± 2 SEM and 4.4 nM ± 0.6 SEM (n = 6), respectively) (Figure 1C and D). The remainder of our studies were conducted with nucleic acids 25 nt or greater.
Figure 1.
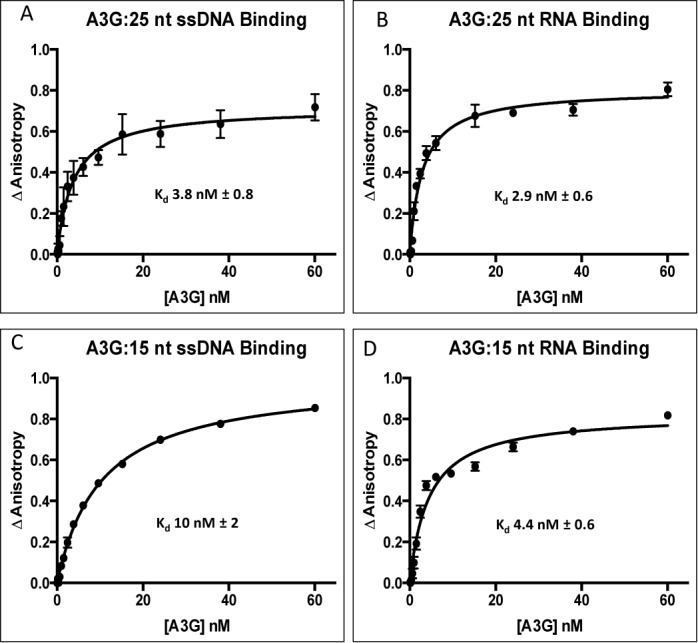
Fluorescence anisotropy of APOBEC3G binding to RNA and ssDNA. Fluorescence anisotropy changes due to A3G binding to AlexFluor 647 labeled (A) 25 nt Sub ssDNA, (B) 25 nt Sub RNA, (C) 15 nt Sub ssDNA and (D) 15 nt Sub RNA were quantified in triplicate by titrating A3G into a binding buffer containing 2 nM of the indicated nucleic acid. The titration of A3G was 0–60 nM. The average normalized change in anisotropy (y-axis) of three individual experiments is plotted as a function of A3G concentration (x-axis) and error bars represent the Standard Error of the Mean (SEM) of the data. The data were fit to a single-site binding equation (see Methods) and binding constants (Kd) shown within each panel determined using GraphPad Prism 6.0.
A3G deaminates processively along ssDNA by a proposed sliding and jumping mechanism (51–53). We evaluated the potential for A3G to exchange ssDNA by FA in competition binding assay wherein unlabeled 25 nt substrate ssDNA (Sub ssDNA) or RNA (Sub RNA) (Table 1) served as competitors for Alexa Fluor 647 labeled 25 nt Sub ssDNA or RNA. Unlabeled ssDNA proved to be an effective competitor for the same sequence of labeled ssDNA or comparable RNA sequence (IC50 of 15 nM ± 1.1 SEM and 22 nM ± 1.1 SEM, (n = 6), respectively) (Figure 2A and B). Surprisingly, unlabeled RNA was far less able to compete for fluorescently labeled RNA or ssDNA binding to A3G (IC50 of 115 nM ± 1.2 SEM (n = 6) and 57 nM ± 1.2 SEM (n = 6) respectively) (Figure 2C and D). Despite A3G having similar affinities for RNA and ssDNA, RNA self-competition required nearly 10-fold more competitor than was observed for ssDNA self-competition (compare Figure 2A and C). These data raise the question that there may be physical differences in how A3G interacts with RNA and ssDNA.
Figure 2.
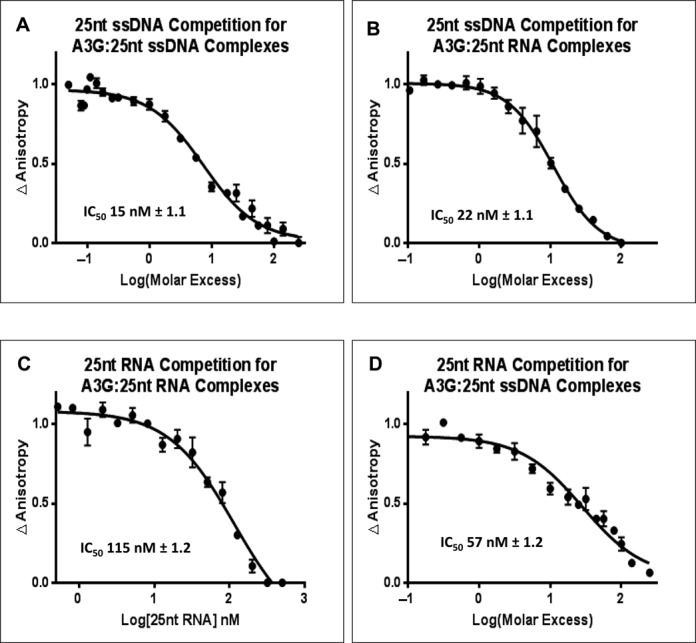
Fluorescence anisotropy of nucleic acid competition binding to A3G. A3G C3 complexes were assembled with AlexFluor 647 labeled 25 nt Sub ssDNA (A and D) using 2 nM A3G and 2 nM of AlexFluor 647 labeled 25 nt ssDNA. A3G ribonucleoprotein complexes (B and C) were assembled with 2 nM A3G and 2 nM 25 nt Sub RNA (B and C). Complexes assembled with AlexFluor 647 labeled nucleic acids were subjected to competition with unlabeled 25 nt Sub ssDNA (A and B) or 25 nt Sub RNA (C and D) over a range of molar excess of competitor from 0 to 250. The average normalized change in anisotropy (y-axis) of three individual experiments was plotted versus the Log10 of the competitor molar excess (x-axis). Changes in fluorescence anisotropy were quantified. The error bars represent the Standard Error of the Mean (SEM) of the data. The data were fit to a single-site competition equation (see Methods) and the inhibitory concentration (IC50) determined using GraphPad Prism 6.0.
A3G binds to ssDNA and RNA with distinctive modalities
Published EMSA of A3G complexes with nucleic acids in fact suggested that the electrophoretic mobility of A3G:ssDNA complexes was distinct from A3G:RNA complexes (26,29,37–39,54–58). A3G bound to ssDNA at 4°C or 37°C but only deaminated dC at 37°C (39). We show here that RNA binding to A3G required elevated temperatures and was markedly impaired by reducing the temperature of the assembly reaction from 37°C to 4°C (Supplemental Figure S2). Therefore RNA and ssDNA binding to A3G differ in their thermal energy requirements.
To better understand A3G binding to RNA and ssDNA we examined the complexes that A3G forms with ssDNA by EMSA using near equilibrium in vitro assembly conditions (Figure 3). Labeled 25 nt Sub ssDNA progressively shifted with the addition of A3G to the electrophoretic migration of C1 complexes previously characterized as A3G dimers (39) (Figure 3, lanes 3–9). Upon the addition of 18.8 nM A3G (lane 9), and with further addition of A3G, C1 complexes progressively shifted to the electrophoretic migration of C3 complexes, previously characterized as A3G tetramers (39) (Figure 3, lanes 10–13). The quantification of the relative signals at the electrophoretic mobility of free ssDNA, C1 and C3 in the gel image on the left in Figure 3 are graphically represented on the right in Figure 3. Three independent analyses were carried out (not shown) and quantified. The average relative signal in free ssDNA, C1 and C3 at each step of the titration was calculated (as described in Methods) and the SEM determined to be +/− 1.8 to 3.2% across the titration. Therefore, near equilibrium titration corroborated an A3G concentration-dependent ordered assembly of the C3 holoenzyme reported previously under non-equilibrium conditions (39).
Figure 3.
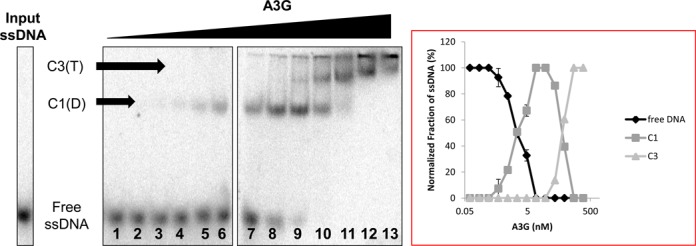
Near equilibrium assembly of A3G C3 complexes on ssDNA. (Left) EMSA of A3G:ssDNA complexes assembled on 5′ [32P] γ-ATP 5′ end-labeled 25 nt Sub ssDNA. The concentration of labeled 25 nt Sub ssDNA in each reaction was 2.0 nM (input ssDNA), whereas the concentration of A3G in the assembly reaction was titrated as follows: 0.073 nM, 0.146 nM, 0.29 nM, 0.59 nM, 1.17 nM, 2.34 nM, 4.7 nM 9.4 nM, 18.8 nM, 37.5 nM, 75nM, 150 nM, 300 nM (Lanes 1–13 respectively, x-axis). C1, A3G dimer bound to ssDNA. C3, A3G tetramer bound to ssDNA. The gel image shown is from a single experiment but representative of what was observed in three replicate determinations. (Right) Graphic representation of the relative intensity of each EMSA band quantified by PhosphorImager scanning densitometry from gel image shown to the left.
Near equilibrium conditions were also established to evaluate how ssDNA competed for labeled 25 nt Sub ssDNA bound to A3G by titrating increasing amounts of unlabeled 25 nt Sub ssDNA of the same sequence into assembly reactions with sufficient A3G to assemble C3 complexes relative to a fixed amount of radiolabeled ssDNA (300 nM) (Figure 4A, input A3G:ssDNA assembly). With the addition of unlabeled ssDNA, radiolabeled 25 nt Sub ssDNA in C3 complexes appeared diminished with a commensurate appearance of radiolabeled ssDNA in C1 complexes (Figure 4A, lanes 2–6). Little or no protein-free (‘free’) radiolabeled ssDNA was observed until a 0.8 molar ratio of unlabeled competitor ssDNA to labeled ssDNA was achieved (Figure 4A, lane 6). At this molar ratio, radiolabeled ssDNA in C3 complexes was <5% of the total radiolabeled ssDNA, and C1 was the most abundant complex. Further addition of competitor ssDNA resulted in the generation of free, labeled ssDNA (Figure 4A, lanes 7–13). The quantification of the relative signals from free ssDNA, C1 and C3 in the gel image on the left in Figure 4A are graphically represented to the right in Figure 4A. Again this study was performed in triplicate (not shown) and quantified. The average relative signal in free ssDNA, C1 and C3 at each step of the titration was calculated and the SEM determined to be +/− 1.6–5.1% across the titration.
Figure 4.
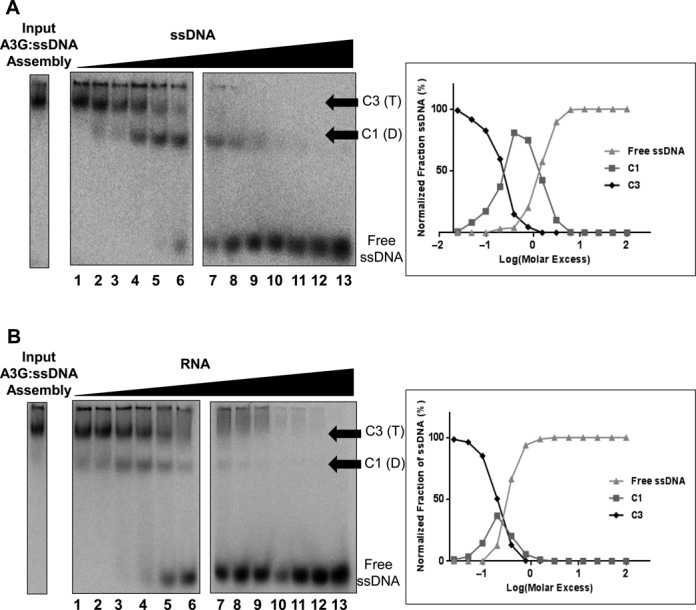
Competition for A3G C3 complexes with ssDNA or RNA. (A) (upper left), EMSA of A3G ssDNA C3 complexes assembled with 5′ [32P] γ-ATP 5′ end-labeled 25 nt Sub ssDNA (Table 1) using 0.3 μM of input labeled ssDNA with 2.4 μM of input A3G (input A3G:ssDNA assembly) and following competition with unlabeled 25 nt Sub ssDNA. Molar excess of unlabeled 25 nt Sub ssDNA in the competition reactions was titrated as follows: 0.025, 0.05, 0.1, 0.2, 0.4, 0.8, 1.56, 3.1, 6.25, 12.5, 25, 50, 100 (Lanes 1–13 respectively, x-axis). C1, A3G dimer bound to ssDNA. C3, A3G tetramer bound to ssDNA. The gel image shown is from a single experiment but representative of what was observed in three replicate determinations. (upper right) Graphic representation of the relative intensity of each EMSA band quantified by PhosphorImager scanning densitometry of the gel image shown to the left. (B) (lower left), EMSA of A3G ssDNA C3 complexes assembled with 5′ [32P] γ-ATP 5′ end-labeled 25 nt Sub ssDNA (input A3G:ssDNA assembly) as described above were subjected to competition with unlabeled 25 nt Sub RNA (Table 1) using competitor molar excess of 0.025, 0.05, 0.1, 0.2, 0.4, 0.8, 1.56, 3.1, 6.25, 12.5, 25, 50, 100 (Lanes 1–13 respectively, x-axis). C1, A3G dimer bound to ssDNA. C3, A3G tetramer bound to ssDNA. The gel image shown is from a single experiment but representative of what was observed in three replicate determinations. (lower right) Graphic representation of the relative intensity of each EMSA band quantified by PhosphorImager scanning densitometry of the gel image shown to the left.
Assuming that C3 tetramer formation was driven by free A3G protein interacting with preformed A3G dimers bound to ssDNA (39), the near equilibrium data suggested a nuanced mechanism of competition wherein A3G dimers bound to radiolabeled ssDNA within C3 complexes were more difficult to displace than A3G associated with the C3 complexes through protein–protein interactions. With sufficiently high addition of competitor ssDNA, radiolabeled ssDNA also was displaced from A3G that had remained bound to it in C1 complexes. Taken together with the data in Figure 3, the ssDNA self-competition suggested a highly ordered progression in assembly from homo dimeric A3G–DNA binding complexes to homo tetrameric A3G holoenzyme complexes that were driven largely by the addition of A3G to the reaction and protein-protein interactions.
A strikingly different outcome was obtained when 25 nt Sub RNA was used as a competitor for radiolabeled 25 nt Sub ssDNA assembled with A3G assembly as C3 complexes (Figure 4B). A3G and radiolabeled 25 nt ssDNA were combined in sufficient proportions for efficient assembly of C3 complexes and a titration of unlabeled 25 nt RNA was added to the assembly reactions (Figure 4B, input A3G:ssDNA assembly). Upon addition of low amounts of RNA (0.025 molar ratio of unlabeled RNA competitor to labeled ssDNA Figure 4A, lane 1), C3 complexes began to diminish with the appearance of prominent C1 complexes as well as some free labeled ssDNA (Figure 4B, lanes 1–4). Although C3 complex reduction due to ssDNA self-competition directly correlated with a commensurate increase in C1 (Figure 4A, lane 7), RNA competition did not show this. Instead, C3 complexes, though markedly diminished by RNA competition, were detectable across a broad range of RNA competitor concentrations coincident with the appearance of free radiolabeled ssDNA (Figure 4B, lanes 4–6). These data suggest that RNA binding to A3G stochastically inhibited all means by which A3G associated with ssDNA.
The relative signals from free ssDNA, C1 and C3 in the gel image on the left in Figure 4B are shown graphically to the right in Figure 4B. Not included in these calculations was a signal from fluorescent ssDNA with low electrophoretic mobility seen as a smear at the top of the lanes. The abundance of this material appeared to decrease with increasing amounts of competitor RNA added but other than labeled ssDNA, the composition of this material is unknown and not further investigated here. The average relative signal in free ssDNA, C1 and C3 at each step of the titration from triplicate determinations was calculated and the SEM determined to be +/− 2.2–4.3% across the titration.
A3G binds to ssDNA through three peptides
To determine the RNA and ssDNA binding sites on A3G, we assembled wild type and full length A3G with RNA or ssDNA, stabilized the interaction by ultraviolet (UV) light cross-linking, trypsin and nuclease digested the complexes and conducted MS peptide analysis (see Methods). It was anticipated that the mass-to-charge ratio for peptides cross-linked to ribo- or deoxyribo-nucleotides would differ markedly from their peptide counterparts derived from A3G that remained cross-linked to nucleic acids in each sample. Therefore, such cross-linked peptides would not be determined in Mascot searches with parameters set to identify native (unmodified) A3G tryptic peptides. A comparison of the A3G peptide coverage of cross-linked samples to A3G peptide coverage of uncross-linked A3G samples would suggest A3G peptides involved in nuclei acid binding (Supplemental Figure S3).
A3G peptide coverage from protein bands excised from SDS-PAGE at the native molecular mass of A3G averaged 76% (Supplemental Figure S3A) in three independent sample preparations and produced consistent data with high-score peptides identification in Mascot searches (typical peptide scores were over 40). Regardless of which samples were analyzed the A3G peptide sequences spanning 1–14, 53–55, 77–102, 137–150, 164–169, 298–301, 321–334, 375–384 amino acid residues were not identified in Mascot searches. These tryptic peptides were short (2–4 residues) and their signals may have been too low for MS detection. We cannot exclude that some of these peptides contained amino acid residues with posttranslational modifications and were missed because we performed our Mascot searches for unmodified peptides.
For cross-linking of ssDNA–A3G, bromouridine (BrdU)-modified oligonucleotides were assembled as C3 complexes. One or more BrdU were positioned in the substrate at or close to the A3G ‘hotspot’ for deamination (UUBrdU) within 15, 25 or 99 nt ssDNAs (Table 1). After cross-linking with medium wavelength UV-light (302 nm), cross-linked A3G was resolved from uncross-linked A3G and processed as described in Methods. Notably, three tryptic peptides were reproducibly absent from the samples that had been cross-linked to 15 nt, 25 nt and 99 nt ssDNAs that corresponded to amino acid positions 181–194 (N-terminal domain) and 314–320 and 345–374 (C-terminal domain) (Figure 5A). The overall A3G peptide coverage in these cross-linked samples was reduced to 63% (Supplement Figure S3B–D). Introduction of three BrdU modifications in 99 nt ssDNA (Table 1) led to identification of an additional cross-linked peptide corresponding to amino acid positions 227–238 (Figure 5A, Supplemental Figure S3E).
Figure 5.
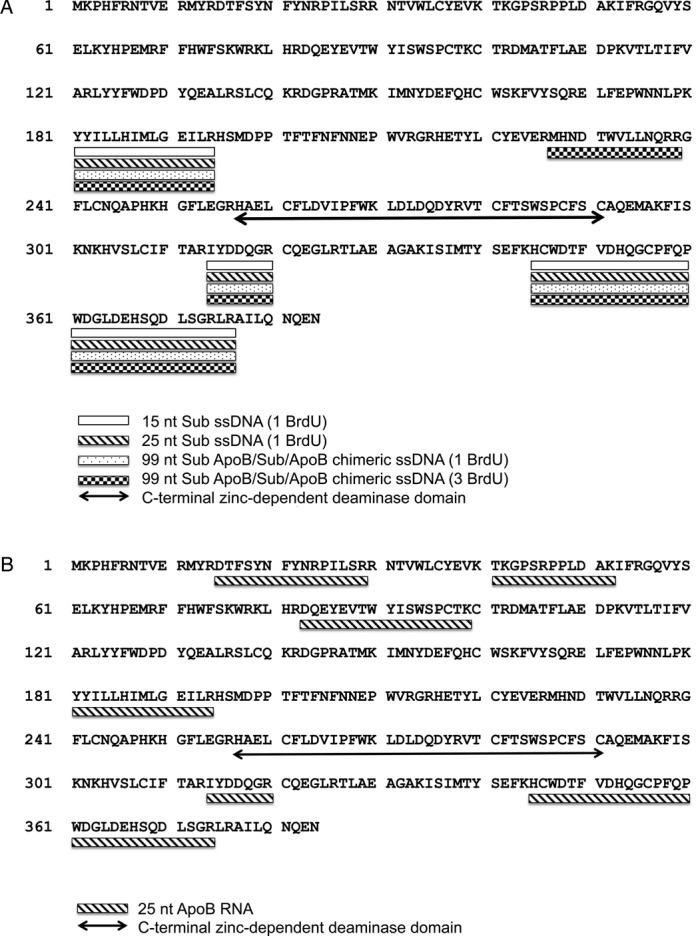
Graphic representation of the tryptic A3G peptides that cross-linked to 25 nt Sub ssDNA and RNA. (A) A3G was assembled with the indicated ssDNA containing BrdU to form C3 complexes and protein–ssDNA interactions stabilized by cross-linking with medium wave UV light as described in Methods. Tryptic peptides were produced, purified and analyzed by mass spectrometry as described in Methods. The full-length amino acid sequence of A3G is shown with tryptic peptides found to be cross-linked to various ssDNAs indicated by the coded bars. The sequence motif of the C-terminal zinc-dependent deaminase domain is underlined with a double headed arrow. (B) A3G was assembled with 25 nt ApoB RNA to form ribonucleoprotein complexes and protein–RNA interactions stabilized by cross-linked with short wave UV light as described in Methods. Tryptic peptides were produced, purified and analyzed by mass spectrometry as described in Methods. The full-length amino acid sequence of A3G is shown with trypic peptides found to be cross-linked to RNA indicated by underline bar. The sequence motif of the C-terminal zinc-dependent deaminase domain is underlined with a double headed arrow.
Residues that encompass the zinc-dependent catalytic site in the C-terminus were not implicated in ssDNA binding; suggesting that while these residues are essential for catalysis, they may not be essential for ssDNA binding. However, the lack of cross-linking does not necessarily mean that they could not be bound because UV-cross-linking is affected by protein conformational dynamics, favored by particular residues that cross-link to BrdU (46) and requires the proper alignment of cross-linking moieties wherein interactions between protein and nucleic acid backbone are not cross-linked. Thus, additional ssDNA binding sites on A3G cannot be ruled out.
Peptides that bind to RNA are within both C- and N-termini of A3G
The sites on A3G bound to RNA were evaluated in a similar manner using short wave length UV light to cross-linked 25 nt apoB RNA to A3G as the starting material. This RNA sequence was chosen for its AT-rich RNA and absence of stable secondary structures so as to optimize A3G binding (26,59). Peptide coverage from A3G cross-linked to this RNA was 57% in three independent experiments (Supplement Figure S3F). Tryptic peptides cross-linked to RNA included all of those implicated in binding to ssDNA (aa 181–194 (N-terminal domain), 314–320 and 345–374 (C-terminal domain)) (Figure 5B). These data support a competition model for RNA and ssDNA binding to A3G. However, in addition, peptide analysis of A3G RNP suggested unique RNA binding sites in the N-terminus of A3G corresponding to amino acids positions 15–29, 41–52 and 83–99 (Figure 5B). The data suggested that allosteric inhibition of ssDNA binding to A3G may occur as well through RNA occupancy of N-terminal RNA binding sites.
Competitive and allosteric RNA binding surfaces relative to ssDNA binding to A3G
A model of the distribution of peptides cross-linked to nucleic acids was determined using the crystal structure of the C-terminal half of A3G (PDB 3IR2, (48)) and a wild-type A3G sequence homology of the A3G N-terminal half that we produced based on the NMR structure of the N-terminus of A3G that was mutated to improve its solubility (60) (Figure 6). The C〈 rmsd between our ‘wild-type’ homology model and the solubilized A3G NMR structure (PDB 2MZZ model 1) was 0.68 Å. The global model quality estimate (GMQE) for this ‘all wild type sequence’ homology model was acceptable (0.75).
Figure 6.
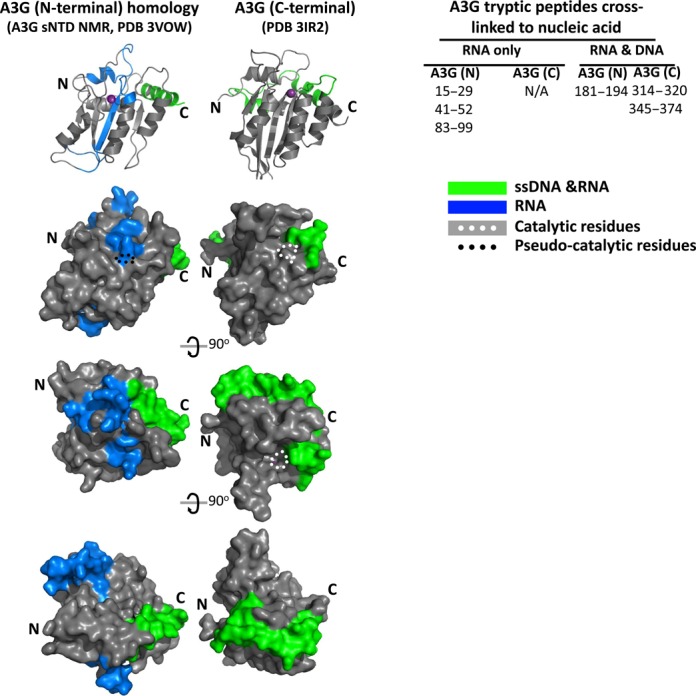
Model of RNA and ssDNA binding regions on A3G. The tryptic A3G peptides identified by MS that cross-linked to either 25 nt RNA (blue) or to both the 25 nt RNA and a 25 nt ssDNA (green) are shown on cartoon diagrams and surface representations of the A3G C-terminal CD2 (PDB 3IR2, (48)) and of an A3G N-terminal CD1 SWISS homology model. The N-terminal homology model was generated with SWISS model (49) using the NMR structure (PDB 2MZZ, (60)) of a solubilized A3G N-terminal variant, comprising 80% sequence identity with the wild-type A3G N-terminal half. The location of the catalytic (white dots) and pseudo-catalytic (black dots) zinc-coordinating residues are indicated for orientation. The upper A3G surface models are depicted in the same orientation as the cartoon diagrams of A3G. The orientation of CD1 relative to CD2 within full length A3G has not been determined and therefore is not shown as being linked in this model. CD1 and CD2 are depicted as both facing the viewer for convenience of depiction though it is acknowledged that this may not necessarily be their presentation in native A3G.
The distribution of DNA-binding peptides mapped onto the structural models for A3G suggested that DNA may wrap around the C-terminal CD2 and interact with at least one face of the N-terminal CD1. The region of the A3G N-terminal half involved in binding to ssDNA was located within α-helix 6 (residues 181–194) placing ssDNA that was bound to the N-terminus of A3G in close proximity to the C-terminal catalytic domain. The two C-terminal DNA-binding peptides (residues 345–372 comprising α-helix 5, loop 10 and α-helix 6 and residues 314–320 comprising loop 7) mapped to surface areas that wrap around the catalytic domain and were proximal to the N-terminal DNA-binding domain. This model supported DNA binding to residues within one large contiguous surface area on A3G that comprised parts of both N and C-terminal halves. The total solvent accessible surface area potentially exposed to ssDNA from these three DNA cross-linked peptides is predicted to be 3207 Å2.
The peptides uniquely implicated in RNA cross-linking to A3G within the N-terminus, corresponded to α-helix 1 and loop 1 (aa 15–29), loop 2 (aa 41–52) and β-strand 3, loop 5 and part of α-helix 3 (aa 83–99). Modeling suggested that these residues were within a solvent-accessible exposed surface area predicted to be 3110 Å2 that was adjacent to the surface area involved in binding to ssDNA and RNA.
DISCUSSION
Prior primary sequence analysis and structure modeling showed that A3G contains two cytidine deaminase domains (CD1 and CD2) (43,59,61,62). Although each CD has at its core a conserved zinc-dependent deaminase (ZDD) super secondary structure motif that coordinates zinc, neither was sufficient alone for the functional activity seen with full length A3G (48,63,64). The N-terminal ZDD (whose fold encompasses residues 65–100) is catalytically inactive but is important for RNA binding, oligomerization and supports the cytidine deaminase activity and ssDNA binding mediated by the C-terminal ZDD (whose fold encompasses residues 257–291) (37,43,63,65). Site-directed mutagenesis of residues within CD2 that are essential for the zinc coordination and proton shuttling inhibited the catalytic activity of A3G but did not affect ssDNA binding (48,64,66). Our data also suggested that peptides containing these residues were not cross-linked to ssDNA.
Residues throughout the C-terminus of A3G have been implicated in ssDNA binding (residues 211–375) (41,55,64,67). Previously published structural modeling suggested that ssDNA binding to A3G involved charged residues R213, R215, R313 and R320 within the ‘Brim’ and N244, R374 and R376 within the ‘Kink’ regions flanking CD2 (66). Mutation of these residues individually or in combination inhibited deaminase activity on ssDNA substrates in vitro, A3G-dependent Rifampicin resistance reversion in E. coli and antiviral activity in single cycle infectivity assays, but they did not affect ssDNA binding. Only mutations of W127 or W94 in combination with the double R313 R320 mutation inhibited A3G ssDNA binding (41,48,64–67). One cannot conclude that the mutated residues were involved in ssDNA binding based on loss-of-function data alone. However, considering these data, the current study suggested that ssDNA binding to 15 nt and 25 nt ssDNA occurred within A3G sequences 181–194, 314–320 and 345–374 that include or are proximal to the Brim and Kink charged residues. The published models were based on A3G binding to a 69 nt ssDNA and in this regard, when we assembled A3G with a 99 nt ssDNA substrate, a peptide corresponding to aa 226–239 was cross-linked to ssDNA. This is proximal to both Brim and Kink residues N244, R213 and R215. Peptide mapping therefore suggested that the distinction between Brim and Kink models may not be justified given they are both represented in the surface area predicted to bind to ssDNA in our study. We cannot rule out additional A3G residues that bind to ssDNA that we could not detect by MS due to their lower cross-linking efficiency and/or instability. Nonetheless, with the data reported here, a fuller picture is emerging for the requirement of residues from both the N- and C-terminus of A3G in ssDNA binding. Importantly, three-dimensional modeling suggested these residues are part of a continuous exposed surface for DNA interactions. There is now compelling evidence that A3G dimers and higher order oligomers are involved in binding to ssDNA and dC deaminase activity and its processivity along ssDNA (37,39,48,52,55,57). We have not determined whether the ssDNA binding surface identified here functions autonomously in binding to ssDNA within the context of an A3G monomer. The emerging consensus that A3G binds to ssDNA as a dimer (36,39,48,55,57,58,68,69) suggests that the nanomolar affinity of A3G for ssDNA may be enabled by dimerization of two A3G ssDNA binding ‘half-sites’.
Site-directed mutagenesis for RNA binding residues in prior reports has been confined to the N-terminal half of A3G. These studies suggested that residues from aa 22–136 and in particular aa 122–127 (RLYRFW) affected A3G RNA binding, viral particle encapsidation of A3G and RNA-bridged A3G oligomerization (9,13,14,16,20,29,52,56,58,63,67,70). We used MS of tryptic peptides from A3G following UV cross-linking of protein to nucleic acid to identify peptides of A3G that may be involved in nucleic acid interaction. While UV cross-linking does not prove binding, it demonstrates atomic level proximity between residues within A3G and nucleic acids, consistent with direct contact (45,46). Peptides identified by MS as uniquely cross-linked to RNA formed a continuous exposed surface spanning aa 15–194 that includes the majority of residues implicated by mutagenesis.
An important new finding from the present study was that RNA and ssDNA cross-linking identified common peptides involved in this interaction (aa 181–194, 314–320 and 345–374). This offers a rational explanation for a competitive mechanism whereby RNA inhibits ssDNA binding. Modeling suggested that the surface of A3G which was uniquely involved in RNA binding was in juxtaposition with the surface involved in binding to both ssDNA and RNA. This new understanding suggested that RNA binding to the N-terminal, RNA-unique surface may allosterically modulate ssDNA binding within the ssDNA and RNA shared surface.
Given the large and heterogeneous nature of A3G ribonucleoprotein complexes in cells (27), it is difficult to predict the stoichiometry of RNA to A3G in RNP complexes but EMSA suggest that multiple stoichiometries may coexist (26,29,37–39,54–58). Given the multiple surfaces available for RNA-binding on the A3G, A3G:RNA stoichiometries may include but are not limited to ones in which (i) a single A3G binds simultaneously to more than one strand of RNA, (ii) a single RNA may wrap around each A3G protein thereby occupying multiple binding sites per A3G monomer and (iii) combinations of the former two possibilities wherein multiple A3G proteins, through oligomerization with RNA, contribute surfaces to an RNA binding domain that only exists in the A3G oligomeric state. Any and all of these possibilities may account for the megaDalton and heterogeneous aggregates characteristic of cellular A3G–RNP.
The multiplicity of presumed binding surfaces for RNA and binding modalities to RNA may underlie why RNA was not as effective a competitor as ssDNA for ssDNA or RNA bound to A3G. We speculate that this characteristic may affect the ability of RNAs to exchange between different A3G within RNP in living cells prior to A3G turnover or during viral particle encapsidation. It has been suggested that only newly translated A3G, with little or no bound RNA, assembled with nascent viral particles whereas A3G in cellular RNP did not (8). We do not rule out that RNA binding to the N- or C-terminus may determine different functional implications for A3G, including modulating ssDNA deaminase activity as recently proposed (63,65,67) or functions that are dependent on the sequence of RNA that is bound to A3G. It will be of interest to determine whether the ability of A3G to exchange from the viral RNA genome to nascent proviral ssDNA during HIV replication is affected by a kinetic advantage of ssDNA competing for A3G binding; therefore not solely determined by RNaseH degradation of the RNA viral genome during reverse transcription. The mechanistic explanation for differences in the ability of RNA and ssDNA to compete for nucleic acid bound to A3G remains to be determined.
In conclusion, this study addressed an open question in the field concerning why RNA binding to A3G inhibits ssDNA binding and thereby inhibits the dC to dU deaminase activity? Our reliance on native protein in complex with nucleic acids as the starting material enabled the first direct evaluation of the residues within intact A3G that were involved in nucleic acid binding. This is the first structure-based support for a competitive mechanism for RNA inhibition of A3G binding to ssDNA binding and deaminase activity and reveals C-terminal peptides heretofore not implicated in RNA binding. The N-terminal peptide contribution to this ssDNA binding surface is a novel finding and provides a structural explanation for why the catalytic domain of CD2 was not sufficient for deoxycytidine deaminase activity. RNA exclusively bound to an exposed surface in the N-terminus of A3G and proximal to the ssDNA binding surface suggested the potential for RNA allosteric regulation of A3G deaminase activity and A3G oligomerization. Further studies have been suggested that will address the structure and function of the nucleic acid binding surfaces described here.
Supplementary Material
Acknowledgments
The authors wish to thank Dr. Ryan Bennett for critical comments in the preparation of this manuscript.
Footnotes
Present addresses:
William M. McDougall, Department of Microbiology and Physiological Systems, University of Massachusetts Medical School, 368 Plantation Street, AS8–2055 Worcester, MA 01605, USA
Alan E. Friedman, Department of Chemistry University at Buffalo, SUNY 515 Natural Sciences Complex, Buffalo, NY 14260, USA
SUPPLEMENTARY DATA
Supplementary Data are available at NAR Online.
FUNDING
W.M.McD was supported during his graduate thesis research in part NIH T32 training grants GM68411 and AI419815 and an Elon Huntington Hooker Graduate Research Fellowship. B.T. was supported in part through a deKiewiet undergraduate research fellowship. The research was supported NIH/NIAID R21AI095007, NIH/NIAID R21NS067671 and NIH/NIGMS110568 (Dr Harold Smith, PI). Additional support was provided through a contract research grant from OyaGen, Inc. Mass spectrometry was performed by the University of Rochester Medical Center Mass Spectrometry Resource Laboratory.
Conflict of interest statement. None declared.
REFERENCES
- 1.Sheehy A.M., Gaddis N.C., Choi J.D., Malim M.H. Isolation of a human gene that inhibits HIV-1 infection and is suppressed by the viral Vif protein. Nature. 2002;418:646–650. doi: 10.1038/nature00939. [DOI] [PubMed] [Google Scholar]
- 2.Smith H.C. APOBEC3G: a double agent in defense. Trends Biochem. Sci. 2011;36:239–244. doi: 10.1016/j.tibs.2010.12.003. [DOI] [PMC free article] [PubMed] [Google Scholar]
- 3.Harris R.S., Bishop K.N., Sheehy A.M., Craig H.M., Petersen-Mahrt S.K., Watt I.N., Neuberger M.S., Malim M.H. DNA deamination mediates innate immunity to retroviral infection. Cell. 2003;113:803–809. doi: 10.1016/s0092-8674(03)00423-9. [DOI] [PubMed] [Google Scholar]
- 4.Chelico L., Pham P., Calabrese P., Goodman M.F. APOBEC3G DNA deaminase acts processively 3′ –> 5′ on single-stranded DNA. Nat. Struct. Mol. Biol. 2006;13:392–399. doi: 10.1038/nsmb1086. [DOI] [PubMed] [Google Scholar]
- 5.Yu Q., Konig R., Pillai S., Chiles K., Kearney M., Palmer S., Richman D., Coffin J.M., Landau N.R. Single-strand specificity of APOBEC3G accounts for minus-strand deamination of the HIV genome. Nat. Struct. Mol. Biol. 2004;11:435–442. doi: 10.1038/nsmb758. [DOI] [PubMed] [Google Scholar]
- 6.Suspene R., Rusniok C., Vartanian J.P., Wain-Hobson S. Twin gradients in APOBEC3 edited HIV-1 DNA reflect the dynamics of lentiviral replication. Nucleic Acids Res. 2006;34:4677–4684. doi: 10.1093/nar/gkl555. [DOI] [PMC free article] [PubMed] [Google Scholar]
- 7.Holmes R.K., Malim M.H., Bishop K.N. APOBEC-mediated viral restriction: not simply editing. Trends Biochem. Sci. 2007;32:118–128. doi: 10.1016/j.tibs.2007.01.004. [DOI] [PubMed] [Google Scholar]
- 8.Soros V.B., Yonemoto W., Greene W.C. Newly synthesized APOBEC3G is incorporated into HIV virions, inhibited by HIV RNA, and subsequently activated by RNase H. PLoS Pathog. 2007;3:e15. doi: 10.1371/journal.ppat.0030015. [DOI] [PMC free article] [PubMed] [Google Scholar]
- 9.Friew Y.N., Boyko V., Hu W.S., Pathak V.K. Intracellular interactions between APOBEC3G, RNA, and HIV-1 Gag: APOBEC3G multimerization is dependent on its association with RNA. Retrovirology. 2009;6:56–86. doi: 10.1186/1742-4690-6-56. [DOI] [PMC free article] [PubMed] [Google Scholar]
- 10.Bogerd H.P., Cullen B.R. Single-stranded RNA facilitates nucleocapsid: APOBEC3G complex formation. RNA. 2008;14:1228–1236. doi: 10.1261/rna.964708. [DOI] [PMC free article] [PubMed] [Google Scholar]
- 11.Svarovskaia E.S., Xu H., Mbisa J.L., Barr R., Gorelick R.J., Ono A., Freed E.O., Hu W.S., Pathak V.K. Human apolipoprotein B mRNA-editing enzyme-catalytic polypeptide-like 3G (APOBEC3G) is incorporated into HIV-1 virions through interactions with viral and nonviral RNAs. J. Biol. Chem. 2004;279:35822–35828. doi: 10.1074/jbc.M405761200. [DOI] [PubMed] [Google Scholar]
- 12.Burnett A., Spearman P. APOBEC3G multimers are recruited to the plasma membrane for packaging into human immunodeficiency virus type 1 virus-like particles in an RNA-dependent process requiring the NC basic linker. J. Virol. 2007;81:5000–5013. doi: 10.1128/JVI.02237-06. [DOI] [PMC free article] [PubMed] [Google Scholar]
- 13.Wang T., Tian C., Zhang W., Luo K., Sarkis P.T., Yu L., Liu B., Yu Y., Yu X.F. 7SL RNA mediates virion packaging of the antiviral cytidine deaminase APOBEC3G. J. Virol. 2007;81:13112–13124. doi: 10.1128/JVI.00892-07. [DOI] [PMC free article] [PubMed] [Google Scholar]
- 14.Huthoff H., Malim M.H. Identification of amino acid residues in APOBEC3G required for regulation by human immunodeficiency virus type 1 Vif and Virion encapsidation. J. Virol. 2007;81:3807–3815. doi: 10.1128/JVI.02795-06. [DOI] [PMC free article] [PubMed] [Google Scholar]
- 15.Alce T.M., Popik W. APOBEC3G is incorporated into virus-like particles by a direct interaction with HIV-1 Gag nucleocapsid protein. J. Biol. Chem. 2004;279:34083–34086. doi: 10.1074/jbc.C400235200. [DOI] [PubMed] [Google Scholar]
- 16.Bach D., Peddi S., Mangeat B., Lakkaraju A., Strub K., Trono D. Characterization of APOBEC3G binding to 7SL RNA. Retrovirology. 2008;5:54. doi: 10.1186/1742-4690-5-54. [DOI] [PMC free article] [PubMed] [Google Scholar]
- 17.Chelico L., Pham P., Goodman M.F. Mechanisms of APOBEC3G-catalyzed processive deamination of deoxycytidine on single-stranded DNA. Nat. Struct. Mol. Biol. 2009;16:454–456. doi: 10.1038/nsmb0509-454. [DOI] [PMC free article] [PubMed] [Google Scholar]
- 18.Gaddis N.C., Chertova E., Sheehy A.M., Henderson L.E., Malim M.H. Comprehensive Investigation of the Molecular Defect in vif-Deficient Human Immunodeficiency Virus Type 1 Virions. J. Virol. 2003;77:5810–5820. doi: 10.1128/JVI.77.10.5810-5820.2003. [DOI] [PMC free article] [PubMed] [Google Scholar]
- 19.Sheehy A.M., Gaddis N.C., Malim M.H. The antiretroviral enzyme APOBEC3G is degraded by the proteasome in response to HIV-1 Vif. Nat. Med. 2003;9:1404–1407. doi: 10.1038/nm945. [DOI] [PubMed] [Google Scholar]
- 20.Zhang W., Du J., Evans S.L., Yu Y., Yu X.F. T-cell differentiation factor CBF-beta regulates HIV-1 Vif-mediated evasion of host restriction. Nature. 2012;481:376–379. doi: 10.1038/nature10718. [DOI] [PubMed] [Google Scholar]
- 21.Jager S., Kim D.Y., Hultquist J.F., Shindo K., LaRue R.S., Kwon E., Li M., Anderson B.D., Yen L., Stanley D., et al. Vif hijacks CBF-beta to degrade APOBEC3G and promote HIV-1 infection. Nature. 2012;481:371–375. doi: 10.1038/nature10693. [DOI] [PMC free article] [PubMed] [Google Scholar]
- 22.Conticello S.G., Harris R.S., Neuberger M.S. The Vif protein of HIV triggers degradation of the human antiretroviral DNA deaminase APOBEC3G. Curr. Biol. 2003;13:2009–2013. doi: 10.1016/j.cub.2003.10.034. [DOI] [PubMed] [Google Scholar]
- 23.Kreisberg J.F., Yonemoto W., Greene W.C. Endogenous factors enhance HIV infection of tissue naive CD4 T cells by stimulating high molecular mass APOBEC3G complex formation. J. Exp. Med. 2006;203:865–870. doi: 10.1084/jem.20051856. [DOI] [PMC free article] [PubMed] [Google Scholar]
- 24.Chiu Y.L., Witkowska H.E., Hall S.C., Santiago M., Soros V.B., Esnault C., Heidmann T., Greene W.C. High-molecular-mass APOBEC3G complexes restrict Alu retrotransposition. Proc. Natl. Acad. Sci. U.S.A. 2006;103:15588–15593. doi: 10.1073/pnas.0604524103. [DOI] [PMC free article] [PubMed] [Google Scholar]
- 25.Prohaska K.M., Bennett R.P., Salter J.D., Smith H.C. The multifaceted roles of RNA binding in APOBEC cytidine deaminase functions. Wiley Interdisciplinary Rev. RNA. 2014;5:493–508. doi: 10.1002/wrna.1226. [DOI] [PMC free article] [PubMed] [Google Scholar]
- 26.McDougall W.M., Smith H.C. Direct evidence that RNA inhibits APOBEC3G ssDNA cytidine deaminase activity. Biochem. Biophys. Res. Commun. 2011;412:612–617. doi: 10.1016/j.bbrc.2011.08.009. [DOI] [PMC free article] [PubMed] [Google Scholar]
- 27.Gallois-Montbrun S., Kramer B., Swanson C.M., Byers H., Lynham S., Ward M., Malim M.H. Antiviral protein APOBEC3G localizes to ribonucleoprotein complexes found in P bodies and stress granules. J. Virol. 2007;81:2165–2178. doi: 10.1128/JVI.02287-06. [DOI] [PMC free article] [PubMed] [Google Scholar]
- 28.Wichroski M.J., Robb G.B., Rana T.M. Human retroviral host restriction factors APOBEC3G and APOBEC3F localize to mRNA processing bodies. PLoS Pathog. 2006;2:e41. doi: 10.1371/journal.ppat.0020041. [DOI] [PMC free article] [PubMed] [Google Scholar]
- 29.Apolonia L., Schulz R., Curk T., Rocha P., Swanson C.M., Schaller T., Ule J., Malim M.H. Promiscuous RNA binding ensures effective encapsidation of APOBEC3 proteins by HIV-1. PLoS Pathog. 2015;11:e1004609. doi: 10.1371/journal.ppat.1004609. [DOI] [PMC free article] [PubMed] [Google Scholar]
- 30.Strebel K., Khan M.A. APOBEC3G encapsidation into HIV-1 virions: which RNA is it. Retrovirology. 2008;5:55. doi: 10.1186/1742-4690-5-55. [DOI] [PMC free article] [PubMed] [Google Scholar]
- 31.Kozak S.L., Marin M., Rose K.M., Bystrom C., Kabat D. The anti-HIV-1 editing enzyme APOBEC3G binds HIV-1 RNA and messenger RNAs that shuttle between polysomes and stress granules. J. Biol. Chem. 2006;281:29105–29119. doi: 10.1074/jbc.M601901200. [DOI] [PubMed] [Google Scholar]
- 32.Goila-Gaur R., Khan M.A., Miyagi E., Strebel K. Differential sensitivity of ‘old’ versus ‘new’ APOBEC3G to human immunodeficiency virus type 1 vif. J. Virol. 2009;83:1156–1160. doi: 10.1128/JVI.01734-08. [DOI] [PMC free article] [PubMed] [Google Scholar]
- 33.Li J., Chen Y., Li M., Carpenter M.A., McDougle R.M., Luengas E.M., Macdonald P.J., Harris R.S., Mueller J.D. APOBEC3 multimerization correlates with HIV-1 packaging and restriction activity in living cells. J. Mol. Biol. 2014;426:1296–1307. doi: 10.1016/j.jmb.2013.12.014. [DOI] [PMC free article] [PubMed] [Google Scholar]
- 34.Cen S., Peng Z.G., Li X.Y., Li Z.R., Ma J., Wang Y.M., Fan B., You X.F., Wang Y.P., Liu F., et al. Small molecular compounds inhibit HIV-1 replication through specifically stabilizing APOBEC3G. J. Biol. Chem. 2010;285:16546–16552. doi: 10.1074/jbc.M109.085308. [DOI] [PMC free article] [PubMed] [Google Scholar]
- 35.Luo K., Xiao Z., Ehrlich E., Yu Y., Liu B., Zheng S., Yu X.F. Primate lentiviral virion infectivity factors are substrate receptors that assemble with cullin 5-E3 ligase through a HCCH motif to suppress APOBEC3G. Proc. Natl. Acad. Sci. U.S.A. 2005;102:11444–11449. doi: 10.1073/pnas.0502440102. [DOI] [PMC free article] [PubMed] [Google Scholar]
- 36.Wedekind J.E., Gillilan R., Janda A., Krucinska J., Salter J.D., Bennett R.P., Raina J., Smith H.C. Nanostructures of APOBEC3G support a hierarchical assembly model of high molecular mass ribonucleoprotein particles from dimeric subunits. J. Biol. Chem. 2006;281:38122–38126. doi: 10.1074/jbc.C600253200. [DOI] [PMC free article] [PubMed] [Google Scholar]
- 37.Iwatani Y., Takeuchi H., Strebel K., Levin J.G. Biochemical activities of highly puified, catalytically active human APOBEC3G: correlation with antiviral effect. J. Virol. 2006;80:5992–6002. doi: 10.1128/JVI.02680-05. [DOI] [PMC free article] [PubMed] [Google Scholar]
- 38.Chaurasiya K.R., McCauley M.J., Wang W., Qualley D.F., Wu T., Kitamura S., Geertsema H., Chan D.S., Hertz A., Iwatani Y., et al. Oligomerization transforms human APOBEC3G from an efficient enzyme to a slowly dissociating nucleic acid-binding protein. Nat. Chem. 2014;6:28–33. doi: 10.1038/nchem.1795. [DOI] [PMC free article] [PubMed] [Google Scholar]
- 39.McDougall W.M., Okany C., Smith H.C. Deaminase activity on single-stranded DNA (ssDNA) occurs in vitro when APOBEC3G cytidine deaminase forms homotetramers and higher-order complexes. J. Biol. Chem. 2011;286:30655–30661. doi: 10.1074/jbc.M111.269506. [DOI] [PMC free article] [PubMed] [Google Scholar]
- 40.Chen K.M., Martemyanova N., Lu Y., Shindo K., Matsuo H., Harris R.S. Extensive mutagenesis experiments corroborate a structural model for the DNA deaminase domain of APOBEC3G. FEBS Letts. 2007;581:4761–4766. doi: 10.1016/j.febslet.2007.08.076. [DOI] [PMC free article] [PubMed] [Google Scholar]
- 41.Holden L.G., Prochnow C., Chang Y.P., Bransteitter R., Chelico L., Sen U., Stevens R.C., Goodman M.F., Chen X.S. Crystal structure of the anti-viral APOBEC3G catalytic domain and functional implications. Nature. 2008;456:121–124. doi: 10.1038/nature07357. [DOI] [PMC free article] [PubMed] [Google Scholar]
- 42.Li X., Ma J., Zhang Q., Zhou J., Yin X., Zhai C., You X., Yu L., Guo F., Zhao L., et al. Functional analysis of the two cytidine deaminase domains in APOBEC3G. Virology. 2011;414:130–136. doi: 10.1016/j.virol.2011.03.014. [DOI] [PubMed] [Google Scholar]
- 43.Navarro F., Bollman B., Chen H., Konig R., Yu Q., Chiles K., Landau N.R. Complementary function of the two catalytic domains of APOBEC3G. Virology. 2005;333:374–386. doi: 10.1016/j.virol.2005.01.011. [DOI] [PubMed] [Google Scholar]
- 44.Smith H.C. Measuring editing activity and identifying cytidine-to-uridine mRNA editing factors in cells and biochemical isolates. Methods Enzymol. 2007;424:389–416. doi: 10.1016/S0076-6879(07)24018-2. [DOI] [PubMed] [Google Scholar]
- 45.Chodosh L.A. Current Protocols in Molecular Biology. John Wiley & Sons, Inc; 1996. UV crosslinking of proteins to nucleic acids. 12.5.1–12.5.8. [DOI] [PubMed] [Google Scholar]
- 46.Hicke B.J., Willis M.C., Koch T.H., Cech T.R. Telomeric protein-DNA point contacts identified by photo-cross-linking using 5-bromodeoxyuridine. Biochemistry. 1994;33:3364–3373. doi: 10.1021/bi00177a030. [DOI] [PubMed] [Google Scholar]
- 47.Urlaub H., Hartmuth K., Kostka S., Grelle G., Luhrmann R. A general approach for identification of RNA-protein cross-linking sites within native human spliceosomal small nuclear ribonucleoproteins (snRNPs). Analysis of RNA-protein contacts in native U1 and U4/U6.U5 snRNPs. J. Biol. Chem. 2000;275:41458–41468. doi: 10.1074/jbc.M007434200. [DOI] [PubMed] [Google Scholar]
- 48.Shandilya S.M., Nalam M.N., Nalivaika E.A., Gross P.J., Valesano J.C., Shindo K., Li M., Munson M., Royer W.E., Harjes E., et al. Crystal structure of the APOBEC3G catalytic domain reveals potential oligomerization interfaces. Structure. 2010;18:28–38. doi: 10.1016/j.str.2009.10.016. [DOI] [PMC free article] [PubMed] [Google Scholar]
- 49.Arnold K., Bordoli L., Kopp J., Schwede T. The SWISS-MODEL workspace: a web-based environment for protein structure homology modelling. Bioinformatics. 2006;22:195–201. doi: 10.1093/bioinformatics/bti770. [DOI] [PubMed] [Google Scholar]
- 50.Thy Pymol Molecular Graphics System. Version 1.7.4 Schrödinger, LLC. [Google Scholar]
- 51.Chelico L., Pham P., Goodman M.F. Stochastic properties of processive cytidine DNA deaminases AID and APOBEC3G. Philos. Trans. R Soc. Lond. B Biol. Sci. 2009;364:583–593. doi: 10.1098/rstb.2008.0195. [DOI] [PMC free article] [PubMed] [Google Scholar]
- 52.Chelico L., Prochnow C., Erie D.A., Chen X.S., Goodman M.F. Structural model for deoxycytidine deamination mechanisms of the HIV-1 inactivation enzyme APOBEC3G. J. Biol. Chem. 2010;285:16195–16205. doi: 10.1074/jbc.M110.107987. [DOI] [PMC free article] [PubMed] [Google Scholar]
- 53.Nowarski R., Britan-Rosich E., Shiloach T., Kotler M. Hypermutation by intersegmental transfer of APOBEC3G cytidine deaminase. Nat. Struct. Mol. Biol. 2008;15:1059–1066. doi: 10.1038/nsmb.1495. [DOI] [PubMed] [Google Scholar]
- 54.Belanger K., Savoie M., Rosales Gerpe M.C., Couture J.F., Langlois M.A. Binding of RNA by APOBEC3G controls deamination-independent restriction of retroviruses. Nucleic Acids Res. 2013;41:7438–7452. doi: 10.1093/nar/gkt527. [DOI] [PMC free article] [PubMed] [Google Scholar]
- 55.Chelico L., Sacho E.J., Erie D.A., Goodman M.F. A model for oligomeric regulation of APOBEC3G cytosine deaminase-dependent restriction of HIV. J. Biol. Chem. 2008;283:13780–13791. doi: 10.1074/jbc.M801004200. [DOI] [PMC free article] [PubMed] [Google Scholar]
- 56.Huthoff H., Autore F., Gallois-Montbrun S., Fraternali F., Malim M.H. RNA-dependent oligomerization of APOBEC3G is required for restriction of HIV-1. PLoS Pathog. 2009;5:e1000330. doi: 10.1371/journal.ppat.1000330. [DOI] [PMC free article] [PubMed] [Google Scholar]
- 57.Shlyakhtenko L.S., Lushnikov A.Y., Li M., Lackey L., Harris R.S., Lyubchenko Y.L. Atomic force microscopy studies provide direct evidence for dimerization of the HIV restriction factor APOBEC3G. J. Biol. Chem. 2011;286:3387–3395. doi: 10.1074/jbc.M110.195685. [DOI] [PMC free article] [PubMed] [Google Scholar]
- 58.Shlyakhtenko L.S., Lushnikov A.Y., Miyagi A., Li M., Harris R.S., Lyubchenko Y.L. Atomic force microscopy studies of APOBEC3G oligomerization and dynamics. J. Struct. Biol. 2013;184:217–225. doi: 10.1016/j.jsb.2013.09.008. [DOI] [PMC free article] [PubMed] [Google Scholar]
- 59.Jarmuz A., Chester A., Bayliss J., Gisbourne J., Dunham I., Scott J., Navaratnam N. An Anthropoid-Specific Locus of Orphan C to U RNA-Editing Enzymes on Chromosome 22. Genomics. 2002;79:285–296. doi: 10.1006/geno.2002.6718. [DOI] [PubMed] [Google Scholar]
- 60.Kouno T., Luengas E.M., Shigematsu M., Shandilya S.M., Zhang J., Chen L., Hara M., Schiffer C.A., Harris R.S., Matsuo H. Structure of the Vif-binding domain of the antiviral enzyme APOBEC3G. Nat. Struct. Mol. Biol. 2015;22:485–491. doi: 10.1038/nsmb.3033. [DOI] [PMC free article] [PubMed] [Google Scholar]
- 61.Wedekind J.E., Dance G.S., Sowden M.P., Smith H.C. Messenger RNA editing in mammals: new members of the APOBEC family seeking roles in the family business. Trends Genet. 2003;19:207–216. doi: 10.1016/S0168-9525(03)00054-4. [DOI] [PubMed] [Google Scholar]
- 62.LaRue R.S., Andresdottir V., Blanchard Y., Conticello S.G., Derse D., Emerman M., Greene W.C., Jonsson S.R., Landau N.R., Lochelt M., et al. Guidelines for naming nonprimate APOBEC3 genes and proteins. J. Virol. 2009;83:494–497. doi: 10.1128/JVI.01976-08. [DOI] [PMC free article] [PubMed] [Google Scholar]
- 63.Belanger K., Langlois M.A. RNA-binding residues in the N-terminus of APOBEC3G influence its DNA sequence specificity and retrovirus restriction efficiency. Virology. 2015;483:141–148. doi: 10.1016/j.virol.2015.04.019. [DOI] [PubMed] [Google Scholar]
- 64.Chen K.M., Harjes E., Gross P.J., Fahmy A., Lu Y., Shindo K., Harris R.S., Matsuo H. Structure of the DNA deaminase domain of the HIV-1 restriction factor APOBEC3G. Nature. 2008;452:116–119. doi: 10.1038/nature06638. [DOI] [PubMed] [Google Scholar]
- 65.Feng Y., Chelico L. Intensity of deoxycytidine deamination of HIV-1 proviral DNA by the retroviral restriction factor APOBEC3G is mediated by the noncatalytic domain. J. Biol. Chem. 2011;286:11415–11426. doi: 10.1074/jbc.M110.199604. [DOI] [PMC free article] [PubMed] [Google Scholar]
- 66.Shindo K., Li M., Gross P.J., Brown W.L., Harjes E., Lu Y., Matsuo H., Harris R.S. A Comparison of Two Single-Stranded DNA Binding Models by Mutational Analysis of APOBEC3G. Biology. 2012;1:260–276. doi: 10.3390/biology1020260. [DOI] [PMC free article] [PubMed] [Google Scholar]
- 67.Furukawa A., Nagata T., Matsugami A., Habu Y., Sugiyama R., Hayashi F., Kobayashi N., Yokoyama S., Takaku H., Katahira M. Structure, interaction and real-time monitoring of the enzymatic reaction of wild-type APOBEC3G. EMBO J. 2009;28:440–451. doi: 10.1038/emboj.2008.290. [DOI] [PMC free article] [PubMed] [Google Scholar]
- 68.Bennett R.P., Salter J.D., Liu X., Wedekind J.E., Smith H.C. APOBEC3G subunits self-associate via the C-terminal deaminase domain. J. Biol. Chem. 2008;283:33329–33336. doi: 10.1074/jbc.M803726200. [DOI] [PMC free article] [PubMed] [Google Scholar]
- 69.Salter J.D., Krucinska J., Raina J., Smith H.C., Wedekind J.E. A hydrodynamic analysis of APOBEC3G reveals a monomer-dimer-tetramer self-association that has implications for anti-HIV function. Biochemistry. 2009;48:10685–10687. doi: 10.1021/bi901642c. [DOI] [PMC free article] [PubMed] [Google Scholar]
- 70.Lavens D., Peelman F., Van der Heyden J., Uyttendaele I., Catteeuw D., Verhee A., Van Schoubroeck B., Kurth J., Hallenberger S., Clayton R., et al. Definition of the interacting interfaces of Apobec3G and HIV-1 Vif using MAPPIT mutagenesis analysis. Nucleic Acids Res. 2010;38:1902–1912. doi: 10.1093/nar/gkp1154. [DOI] [PMC free article] [PubMed] [Google Scholar]
Associated Data
This section collects any data citations, data availability statements, or supplementary materials included in this article.