
Figure 5. miR-23b attenuates progression of gastric cancer cells through Notch2 pathway or Ets1.
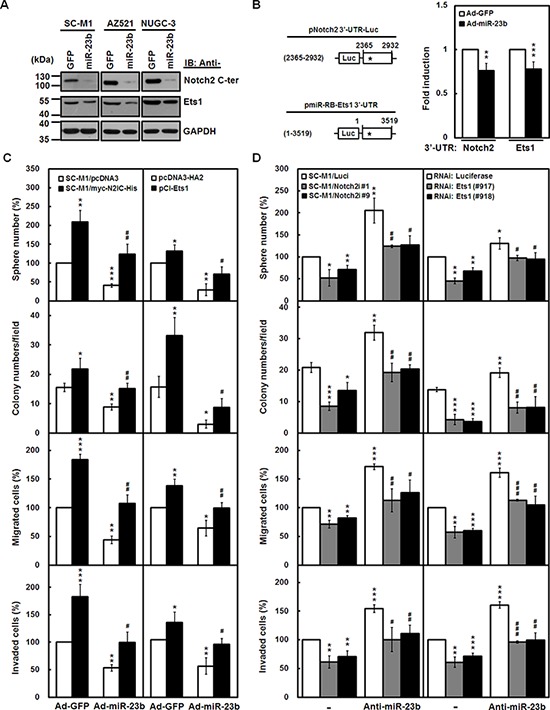
A. SC-M1, AZ521, and NUGC-3 cells were infected with adenoviruses expressing miR-23b (Ad-miR-23b) or GFP (Ad-GFP) for 48 hours. Whole-cell extracts of the infected cells were prepared for Western blot analysis using anti-Notch2 C-terminal (C-ter), anti-Ets1, and anti-GAPDH antibodies. B. Schematic representation of luciferase reporter plasmids pNotch2 3′-UTR-Luc (2365–2932) and pmiR-RB-Ets1 3′-UTR containing DNA fragments of human Notch2 receptor (nucleotide 2365 to 2932) and Ets1 (nucleotide 1–3519) 3′-UTRs, respectively (left). Star indicates position of the putative miR-23b-binding site in reporter plasmids. After transfection with reporter plasmids pNotch2 3′-UTR-Luc (2365-2932) and pmiR-RB-Ets1 3′-UTR for 24 hours, SC-M1 cells were infected with adenoviruses expressing miR-23b or GFP for 24 hours and used for reporter gene assay (right). Means of three independent experiments performed at least in triplicate are shown. **P < 0.01; ***P < 0.001. C. The N2IC-expressing SC-M1/myc-N2IC-His cells and SC-M1/pcDNA3 control cells were infected with adenoviruses expressing miR-23b or GFP for 48 hours (left). SC-M1 cells were infected with adenoviruses expressing miR-23b or GFP for 24 hours after transfection with Ets1-expressing construct pCI-Ets1 or control vector pcDNA3-HA2 for 24 hours (right). Then the treated cells were seeded for the assays of tumorsphere formation, colony formation, migration, and invasion as described in the legends to Figure 3 and Figure 4. *P < 0.05; **P < 0.01; ***P < 0.001. #P < 0.05; ##P < 0.01. D. Notch2 receptor-knocked down SC-M1/Notch2i cells (#1 and #9) and SC-M1/Luci control cells were transfected with antagomir-23b (anti-miR-23b) or scrambled control (−) for 48 hours (left). SC-M1 cells were co-transfected with antagomir-23b and siRNA vectors against Ets1 (#917 and #918) for 48 hours (right). Then the treated cells were seeded for the assays of tumorsphere formation, colony formation, migration, and invasion. *P < 0.05; **P < 0.01; ***P < 0.001. #P < 0.05; ##P < 0.01; ###P < 0.001. Data are shown as mean ± standard deviation.