
Figure 2. Death of PECA cells after ALA-PDT.
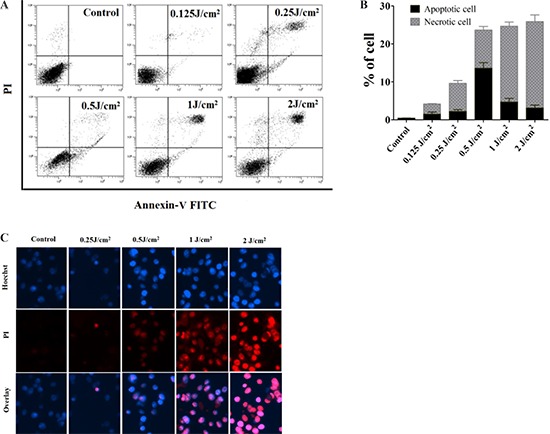
A. and B. FACS analysis for cell death. PECA cells were stained with Annexin-V-FITC/PI after ALA-PDT with different light doses (0.125 to 2 J/cm2), 1 h after treatment (n = 5). Cell death increased with light dose. Under 0.5 J/cm2 light dose, the proportion of apoptotic PECA cells reached maximum, while 2 J/cm2 light dose mainly induced necrotic cells. C. Cell death revealed by (Hoechst) /PI staining 1 h after different treatments, with untreated cells as a control. ALA-PDT at 0.5 J/cm2 mainly induced apoptosis while ALA-PDT at 2 J/cm2 mainly induced necrosis.