Abstract
Inhalation exposure systems are necessary tools for determining the dose response relationship of inhaled toxicants under a variety of exposure conditions. The objective of this study was to develop an automated computer controlled system to expose small laboratory animals to precise concentrations of uniformly dispersed airborne silica particles. An acoustical aerosol generator was developed which was capable of re-suspending particles from bulk powder. The aerosolized silica output from the generator was introduced into the throat of a venturi tube. The turbulent high-velocity air stream within the venturi tube increased the dispersion of the re-suspended powder. That aerosol was then used to expose small laboratory animals to constant aerosol concentrations, up to 20mg/m3, for durations lasting up to 8h. Particle distribution and morphology of the silica aerosol delivered to the exposure chamber were characterized to verify that a fully dispersed and respirable aerosol was being produced. The inhalation exposure system utilized a combination of airflow controllers, particle monitors, data acquisition devices and custom software with automatic feedback control to achieve constant and repeatable exposure environments. The automatic control algorithm was capable of maintaining median aerosol concentrations to within ±0.2 mg/m3 of a user selected target concentration during exposures lasting from 2 to 8 h. The system was able to reach 95% of the desired target value in <10min during the beginning phase of an exposure. This exposure system provided a highly automated tool for conducting inhalation toxicology studies involving silica particles.
Keywords: Aerosol, automated, exposure system, inhalation, silica
Introduction
Crystalline silica, often referred to as Quartz, is formed when silicon dioxide (SiO2) molecules are lined up in order to form a crystal structure. It is an abundant mineral found in rocks, sand and soil. Occupational exposure to crystalline silica occurs in a variety of workplace settings such as mining, tunneling, sand blasting, cement manufacturing, ceramic production, glass production, electronic industry, manufacturing abrasives and construction. Silicosis is an obstructive lung disease where scar tissue develops in the lungs reducing the gas exchange between the blood and air. This disease is associated with inhalation exposure to crystalline silica. Exposure to crystalline silica can also increase the risk of developing lung cancer (Hughes et al., 2001; Knutsson et al., 2000; Peretz et al., 2006). Other studies have shown a link between crystalline silica exposure and the development of autoimmune disorders (Calvert et al., 2003; Rafnsson et al., 1998; Rosenman & Zhu, 1995). Diseases associated with crystalline silica exposure are usually incurable but are preventable. It is unlikely that one common mechanism is responsible for all possible disorders associated with crystalline silica, and the exact sequence of events from silica inhalation to the development of the disease state is still unknown. Research is being conducted which is attempting to accurately predict the outcome of occupational exposure to silica at early stages. For example, a hypothesis is being tested whether a blood gene expression profile can be used as a noninvasive marker capable of predicting organ toxicity in preclinical stages in workers who have occupational exposure risk to airborne silica (Sellamuthu et al., 2011, 2012). To aid in this type of research, an automated system that could aerosolize, disperse and carefully control the airborne silica powder within an inhalation exposure chamber was developed. This article focuses on the design and testing of that system.
The exposure system was required to meet the following design specifications: (1) the generator should produce airborne particles continuously for exposure times ranging from 2 to 8h, (2) the exposure chamber aerosol concentrations should be maintained at any selected aerosol concentration ranging between 1 and 20 mg/m and this concentration should be automatically controlled with minimal fluctuations during an exposure period, (3) the size distribution of the airborne exposure particles should remain constant during consecutive exposure periods regardless of exposure mass concentration, (4) the particles delivered to the exposure chamber should be separated into single silica particles and not include particles >5 μm, (5) the exposure concentration response time should quickly reach equilibrium after the animals have been placed into the exposure chamber, (6) the overshoot in exposure concentration at the beginning of an exposure period should be minimal, (7) the exposure chamber should houses up to 24 mice or 8 rats within individual cages, and particle concentration variations between cage locations should be minimal, (8) the exposure chamber temperature and relative humidity should be monitored to ensure they remain within acceptable rages, 71–75°F and 30–65% respectfully and (9) the system should be computer controlled and require little, if any, operator intervention over an exposure period.
Materials and methods
Description of silica material
The bulk silica sample used in this study was MIN-U-SIL 5 (U.S. Silica, Berkeley Springs, WV). According to the vendor's description, MIN-U-SIL is a high-purity, high-quality natural crystalline silica. The ground silica sand is inherently inert, white, bright, has low moisture and is at least 99.2% SiO2, with 97% of the silica particles having an equivalent spherical diameter <5 μm.
Description of the silica exposure system
Overall system design
A diagram of the complete computer controlled silica inhalation exposure system is shown in Figure 1. Air from a water seal compressor was conditioned by passing it through a dryer, a charcoal filter and then a HEPA filter. The clean air was then provided to three mass flow controllers (Aalborg, model # GPC373S). The first mass flow controller supplied air at a flow rate ranging from 5 to 6 LPM to the acoustical particle generator, the second mass flow controller supplied an air flow of 5–20 LPM to the generator's enclosure box and the third mass flow controller supplied 25 LPM of dilution air to a venturi tube. Aerosol from the acoustical generator was introduced into the throat, or side port, of the venturi. The particles entered a high-velocity turbulent air stream that was created by the venturi, at a 90° angle and were quickly accelerate as they passed through the tube. This action caused the small agglomerated particles to break apart increasing the dispersion and dilution of the aerosol.
Figure 1.
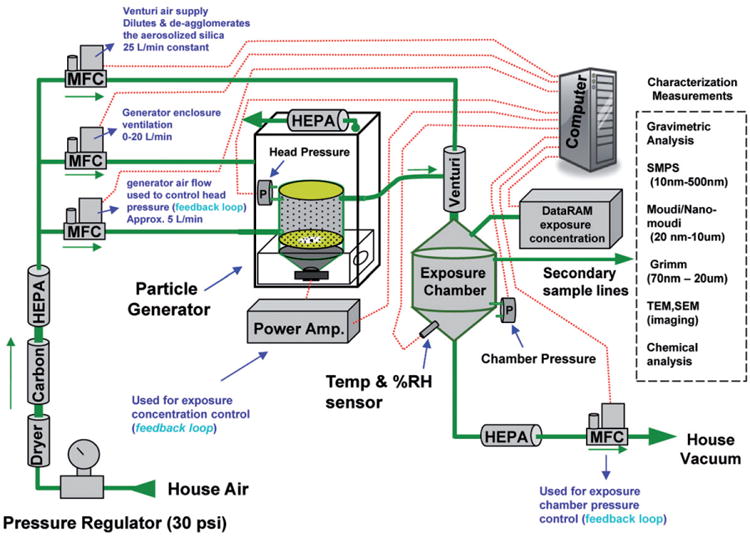
Diagram of the silica inhalation exposure system.
The output of the venturi tube entered the top of the exposure chamber. A DataRAM 4 (Thermo Electron) was used to monitor the mass concentration of silica aerosol in the exposure chamber in real time. To maintain the desired exposure aerosol concentration, signals from the DataRAM were used by the computer to adjust the voltage level driving a speaker in the base of the particle generator. Aerosol concentrations were also determined gravimetrically with 37 mm cassettes and Teflon filters at the end of each exposure period to verify and calibrate the DataRAM readings. After the silica aerosol exited the exposure chamber, it was filtered through a HEPA filter and the clean air was exhausted through a fourth mass flow controller to a vacuum system. Pressure inside the exposure chamber was measured continuously with a pressure transducer (Setra, model # 264). The exposure system's software automatically made adjustments to the exhaust mass flow controller to keep the exposure chamber at a slightly negative pressure of −0.1 in of H2O. This minimized the effects of air leaks and aided in preventing the aerosol from escaping the exposure chamber and entering the surrounding environment.
The temperature and humidity of the air inside the exposure chamber was continuously measured with a temperature/humidity sensor (Vaisala HMP60).
Aerosol generator (Stage 1)
The first stage of the generator is based on an improved version of the PITT-3 aerosol generator (Weyel et al., 1984). Details of the generator used in this study to aerosolize the silica powder are illustrated in Figure 2. A major component of the generator was a large cylindrical acrylic chamber. The chamber was 18 in in height with a 14-in diameter. Both ends of the cylinder were enclosed with flexible latex rubber diaphragms to form a drum-like structure. The diaphragms were 0.02 in thick and were held tightly in place with rubber O-rings. The walls of the acrylic cylinder, excluding the viewing port, were lined with conductive stainless steel foil, which was electrically grounded, to prevent the buildup of static electrical charge. The acrylic cylinder was mounted vertically above a base containing a high compliance 15 in loudspeaker (Ciare, model # 15.00SW). The speaker faced upward and without making physical contact was acoustically coupled to the bottom diaphragm of the acrylic cylinder. During operation, bulk samples of silica (15 g) were placed inside the cylinder onto the lower diaphragm. The speaker was driven with a computer generated analog signal amplified with a low-frequency audio amplifier (Butt Kicker, Model # BKA-1000-4A). The signal used to excite the speaker consisted of a variable frequency sine wave that gradually swept back and forth between 13 and 21 Hz over a 12-s period. This signal was chosen because it generated frequencies above and below the resonant frequency of the acrylic cylinder and flexible diaphragm combination. The resonant frequency of the generator is a function of the acrylic cylinder dimensions and the flexible diaphragms on each end. How tightly the flexible diaphragms are stretched over the cylinder can also affect the resonant frequency. Typically the diaphragms are installed tight enough to ensure a smooth flat horizontal surface without the presence of creases or wrinkles and not any tighter. A sweeping voltage signal proved useful because even when the resonant frequency changed slightly, the driving signal still swept through the new resonant frequency. Thus, slight changes in the actual resonant frequency (±3 Hz) of the generator had minimal effects on the overall output efficiency of the generator during day to day operation. The output concentration of the generator was controlled by varying the amplitude of the signal used to drive the speaker. Clean dry air entered the generator on the lower left hand side of the acrylic chamber (Figure 2) and exited the cylinder on the upper right hand side. The chamber acted as a vertical elutriator allowing only small airborne particles to escape the cylinder. The larger particles consisting of agglomerated powder tended to stay in the lower portion of the cylinder until they were broken apart.
Figure 2.
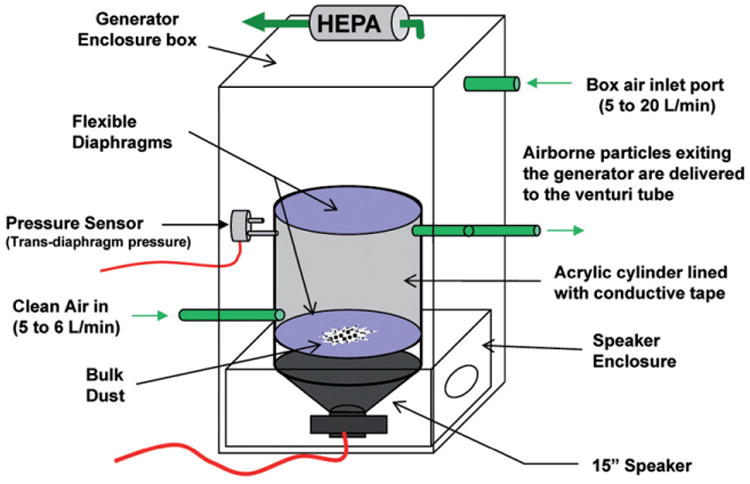
Diagram of the aerosol generator (acoustical generator).
The acrylic cylinder, latex diaphragms and loudspeaker assembly were placed in a large enclosure box (48 in × 20 in × 20 in) with a small air pressure inlet port, and air relief port. The purpose of the box was to: (1) muffle the acoustic noise produced by the loudspeaker, (2) form a barrier to protect operators from aerosols that escaped from the generator due to an unexpected leak or ruptured diaphragm and (3) to help control the pressure differential across the flexible diaphragms on the ends of the cylinder.
The pressure inside the generator's cylindrical chamber was capable of rising or falling quickly as air flowed through it and into the venturi tube. This pressure, if uncontrolled, would cause the two flexible membranes on each end of the acrylic cylinder to bulge outward because of positive pressure or inward because of negative pressure. The deformation of the diaphragms caused by a positive pressure causes the bulk silica sample to collect at the center of the lower flexible diaphragm. Since most of the displacement energy is delivered to that portion of the diaphragm, a slightly positive pressure across the flexible diaphragms is desirable. If the positive pressure became excessive; however, the flexible diaphragms would become overly stretched, less compliant and result in a reduction in generator efficiency. On the other hand, if the pressure inside the generator cylinder becomes negative the flexible ends tend to bulge inward causing the bulk powder to move to the outer edges of the lower diaphragm. In this case, the generator aerosol output quickly decreases. The pressure between the inside and outside of the acrylic chamber was measured with a pressure transducer (Setra, Model # 264). That pressure was automatically controlled with adjustments to the generator's cylinder input air and the enclosure box input air by a computer controlled automated feedback loop. As a result, the trans-diaphragm pressure was held constant at an optimal value of +0.1 in H2O, thus maximizing the generator's performance. Detailed graphs of cylinder pressure versus generator output, generator air flow versus generator output and generator excitation voltage versus generator output have been previously published on a similarly designed acoustical generator (McKinney et al., 2009).
Venturi particle disperser (Stage 2)
The exposure system in the current study differs from that previously described (McKinney et al., 2009) by adding a venturi tube (Intox) as a second stage. In addition to assisting in breaking up agglomerated particles, the venturi acts as a diluter and provides higher total flow rates that are needed for the larger animal exposure chamber. Incorporating a venturi tube in the system, however, required additional feedback control measures to maintain the stable generator trans-diaphragm pressure. Details of the feedback control loops are given in a later section.
Animal exposure chamber
The animal exposure chamber used in the automated silica inhalation exposure system is illustrated in Figure 3. It was made from a modified 20 gal (75 l) stainless steel drum which was able to accommodate 36 mice or 8 rats housed in individual cages. The drum lid was constructed with a large clear Plexiglas window with access ports for various instruments. A custom-made exhaust manifold was designed and placed in the bottom of the drum so that that the aerosol would be evenly distributed. A whole-body exposure chamber was selected because ingestion of small amounts of silica from grooming was less likely to affect the biological results than the high levels of restraint stress involved with nose-only chambers (Aydin et al., 2011; Gamaro et al., 1999; Jakab & Hemenway, 1989; Tyl et al., 1994).
Figure 3.
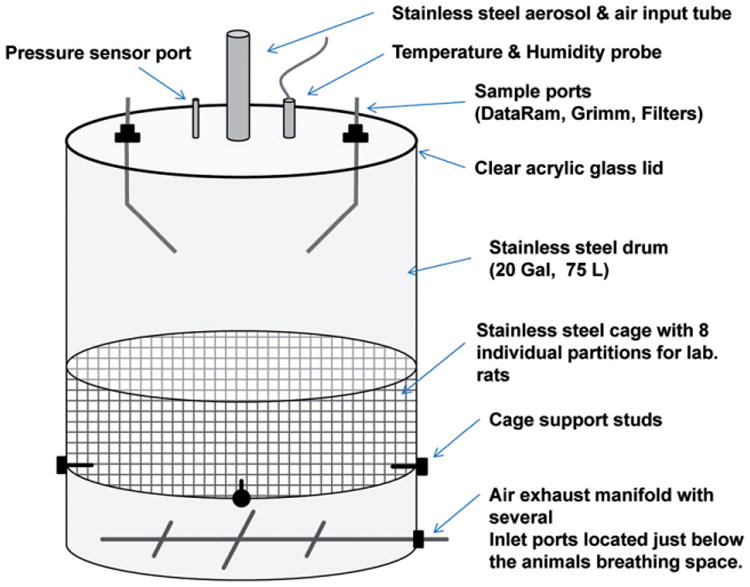
Diagram of the small animal exposure chamber.
Computer user software interface
The computer software controlling the silica exposure system was implemented using the LabVIEW programming environment. The software interface was displayed in the form of a virtual instrument as shown in Figure 4. A graph, shown on the screen of the lower portion of the virtual instrument, continuously displayed the exposure chamber concentration in addition to the desired exposure concentration. User-activated virtual buttons in the upper right hand corner of the user interface provided the main controls for the exposure system. After animals had been placed into the exposure chamber the button, labeled “Animals are in the chamber start the exposure now”, was pressed, which immediately changed that button's label to “Exposure has started!!” The virtual instrument then prompted the user to select a data file name, the desired exposure concentration and the exposure duration. After entering those parameters, all feedback control systems were enabled and average silica concentration over the entire exposure period, the peak concentration, the last 15-min average concentration and the total elapsed time displays were reset to zero. The elapsed time and exposure averages were continuously displayed by the virtual instrument over the entire exposure period.
Figure 4.
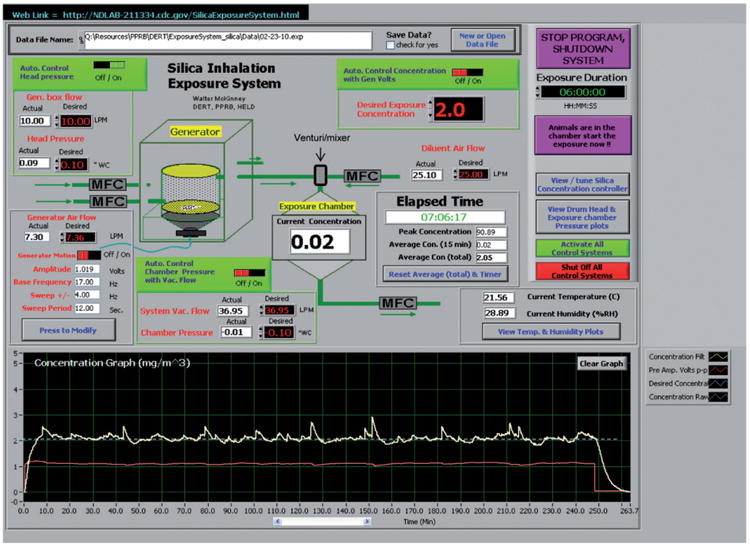
Exposure system graphical user interface.
The computer automatically saved the history of the following exposure parameters in the selected data file at 2-s intervals: the elapsed exposure time (seconds), the generator excitation (volts), the airflow through the generator (LPM), the air flow though the generator enclosure box, the air supplied to the venturi tube, the generator trans-diaphragm pressure (inches-H2O), the exposure chamber mass concentration (mg/m3), the exposure chamber temperature (°C), the exposure chamber relative humidity (%), the exposure chamber pressure (inches-H2O) and the air flow exhausted from the exposure chamber. Because the computer software fully controlled the inhalation exposure, the system operator needed only to periodically check the exposure system parameters to verify the system was operating properly and to collect filter samples via the sample port in the exposure chamber. When the desired exposure period had completed, the software automatically turned the speaker excitation off, then alerted the system operator when the exposure chamber concentration had dropped to a safe level for removing the animals. At the same time, the data file containing the exposure data was closed and the feedback control loops were deactivated.
Control system software
The computer controlled silica exposure system employed three different feedback loops which continuously controlled: (1) the animal exposure chamber aerosol mass concentration, (2) the animal exposure chamber pressure and (3) the acoustical generator's trans-diaphragm pressure. The exposure concentration was maintained at a constant value by adjusting the particle generator's excitation voltage every 20 s based on the DataRAM measurements. Typical desired exposure concentrations ranged from 2 to 20 mg/m3.
The pressure in the animal exposure chamber, was regulated by making corrections once every 2 s to the exhaust flow based on readings from a pressure transducer (Setra, Model # 264). This pressure was typically held constant at a slight negative value (−0.1 in of H2O). The differential pressure across the particle generator's diaphragms was automatically controlled by making adjustments to the amount of air entering the generator enclosure box which had a small air relief port and HEPA filter (see Figure 2). Small “trim” adjustments were occasionally made to the acoustical generator's input air, ranging from 5 to 6 LPM, when the enclosure box pressurization air was near its flow limits (0–20 LPM). This was necessary because the side input port of the venturi tube behaved like a high-impedance constant flow vacuum source operating at ∼5.5 LPM. When the generator's input air was lower than that required by the venturi, the acoustical generator's chamber pressure would quickly drop. Similarly, when the generator's input air was higher than that required by the venturi, the acoustical generator's chamber pressure would quickly rise. During a typical exposure period silica would accumulate on the walls of the venturi tube resulting in a slight decrease in the amount of air the venturi side port attempted to pull. If a portion of that coating broke loose from the walls, the amount of air entering the venturi would increase slightly. When the changes in venturi side port flow could not be compensated for by adding additional flow to the generator enclosure box to lower or increase the box pressure, the automated controller was forced to trim the generator's input flow. Correction were made every 2 s based on the output of the pressure measured (Setra, Model # 264) across the diaphragms. The pressure differential across the generator diaphragms was typically held constant at +0.1 in of H2O to yield maximum generator output efficiency.
A form of proportional-integral-derivative (PID) control algorithm (Nise, 1995) was implemented for each of the feedback control loops employed by the silica inhalation exposure system. The constants Pgain, Igain and Dgain used by each PID control loop were determined using manual tuning methods. In brief: (1) the adjustment period was set to 1.75 times the system delay and Igain and Dgain were set to zero, (2) step responses were conducted at various values of Pgain until 20% overshoot and non-increasing oscillations were observed, (3) additional step responses were conducted while adjusting Dgain until overshoot was reduced to under 5% and steady state oscillations were eliminated and (4) Igain was then adjusted to eliminate any steady state error.
Results
DataRam aerosol concentration calibration
The continuous output of a DataRam was used to estimate the mass concentration of the aerosol in the animal exposure chamber in real time. Gravimetric samples were taken from the exposure chamber while operating the system at a wide variety of desired SiO2 mass concentrations between 2 and 33 mg/m3. These gravimetric samples were collected by drawing aerosol through 47 mm polycarbonate filters (Whatman, Clinton, PA) at a flow rate of 1.0 l/min with a sample pump. The linear relationship between the gravimetric filter samples and the average DataRam reading during each sample period were used to calibrate the DataRam in terms of the SiO2 mass concentration. The correlation between gravimetric measurements and the average DataRam reading is shown in Figure 5. The DataRam readings multiplied by a calibration factor of 0.75, the slope of the straight line in Figure 5, was approximately equal to the measured gravimetric results.
Figure 5.
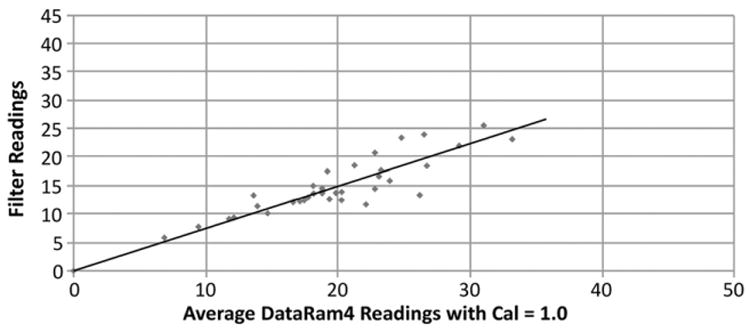
Relationship between gravimetric filter measurements of aerosol mass concentrations in the animal exposure chamber and DataRam estimations.
Comparison of open and closed loop exposure concentration control
In order to evaluate the effectiveness of the automatic control system for regulating the mass concentration of the aerosol in the exposure chamber, concentration versus time was compared for two different 6-h test runs, one with the control system activated and one with it deactivated. In this test, the desired mass concentration was set to15mg/m3. The closed loop test run was conducted first, and the average generator voltage during the steady state portion of this run was used as the constant open loop voltage of the second run. The SDs of the DataRAM measurements about the mean concentrations for both test exposures were used to evaluate fluctuations in the mass concentration. The other feedback control loops were left active (generator pressure and exposure chamber pressure) for both test runs. The improvement in the control of aerosol mass concentrations within the animal exposure chamber by adding feedback control is illustrated in Figure 6. Without feedback the steady state mean mass concentration was 18.26 mg/m and the SD was 3.09 mg/m over a 6-h exposure period. The peak overshoot achieved when the system was initially energized was 100%. With feedback control enabled the steady state mean mass concentration was 15.02 with a SD of 0.51 and the desired concentration was quickly achieved without a significant overshoot at the start of the exposure period.
Figure 6.
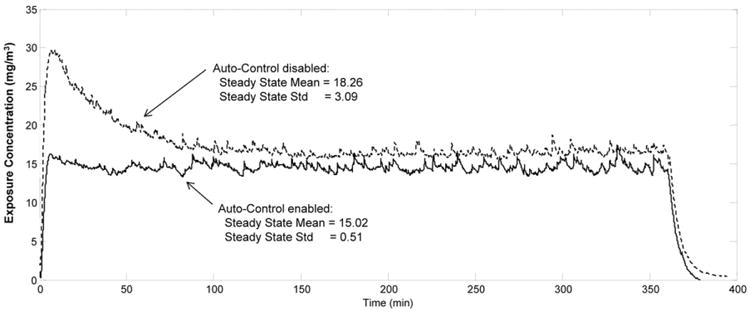
Comparison between open loop and closed loop controls on aerosol mass concentration in the animal exposure chamber.
Feedback controller stability at various mass concentrations
Stability of the automatic concentration control algorithm was tested by examining the aerosol mass concentration in the exposure chamber, measured with the DataRAM, during five different exposure runs. The target concentrations for the five exposure runs were 2.0, 5.0, 10.0, 15.0 and 20.0 mg/m3. Figure 7 shows the DataRAM measurements made over 6-h exposure periods at the five different aerosol mass concentrations. For target mass concentrations of 2.0, 5.0, 10.0, 15.0 and 20.0 mg/m the actual mass median concentrations ± SD achieved were 1.99 ±0.14, 5.00 ±0.29, 9.99 ±0.38, 14.99 ±0.49, 20.01 ±0.38 mg/m3. The rise time to reach 90% the desired mass concentration was 11.9, 5.2, 4.1, 3.5 and 3.8 min.
Figure 7.
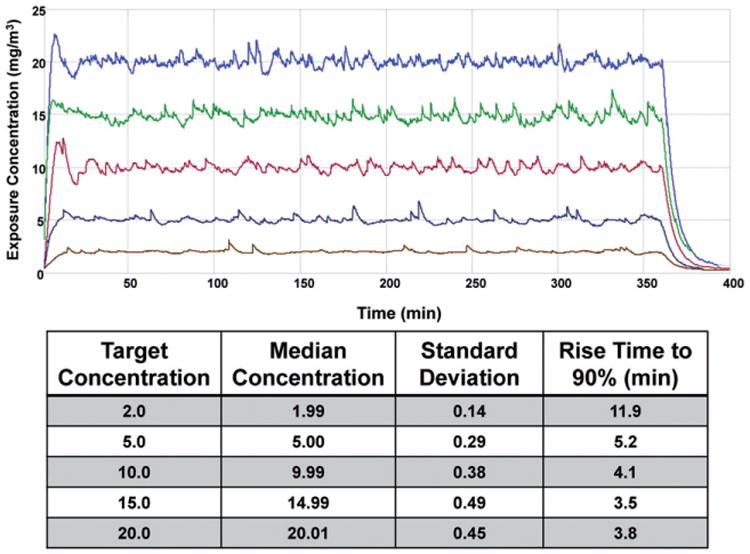
DataRam measurements of the aerosol mass concentrations versus time for silica exposure runs at target concentrations of 2, 5, 10, 15 and 20 mg/m3.
Effect of the venturi in breaking up agglomerates
The effectiveness of the venturi in breaking up agglomerated aerosol particles was determined by making comparisons of the aerosol dimensions measured with and without the use of the venturi stage. An experiment was conducted to determine the particle size distribution of the output of the generator under several different exposure chamber concentrations (5, 10 and 20 mg/m3). At each of these three exposure concentrations, the system was configured with either the venturi tube, or a “T” connector replacing the venturi and supplying the same amount of dilution air. The normalized particle number distributions of the aerosols were determined using a GRIMM 15 channel real time aerosol spectrometer (GRIMM Technologies, Inc., Douglasville, GA). In addition, the particle aerodynamic mass distribution was determined using a 10-stage impactor (MOUDI, model 110-R) in series with a nano-impactor (MOUDI, model 115). Exposure chamber samples were also taken during each test run for scanning electron microscope analysis. The aerosol number distribution, measured in the animal exposure chamber with and without using the venturi, is shown in Figure 8. Aerosols produced by the acoustical generator had larger mass median diameters. This appears due to the re-agglomeration of the high concentration of SiO2 particles in the acoustical generator before they reached the diluter. Aerosols that passed through the venturi, however, appeared to have a much smaller diameter and were not affected as much at the higher mass concentrations. Electron micrograph of aerosols in Figure 9, collected with and without the venturi, show that the venturi was effective in reducing the agglomeration of the SiO2 particles. The particle mass distribution versus aerodynamic diameter of the SiO2 aerosol measured with the MOUDI, shown in Figure 10, was not significantly different with or without the venturi. The MOUDI measurements did however show a small increase in the amount of small particles produced with the venturi stage but these small particles have a very small effect on the total mass of the aerosol.
Figure 8.
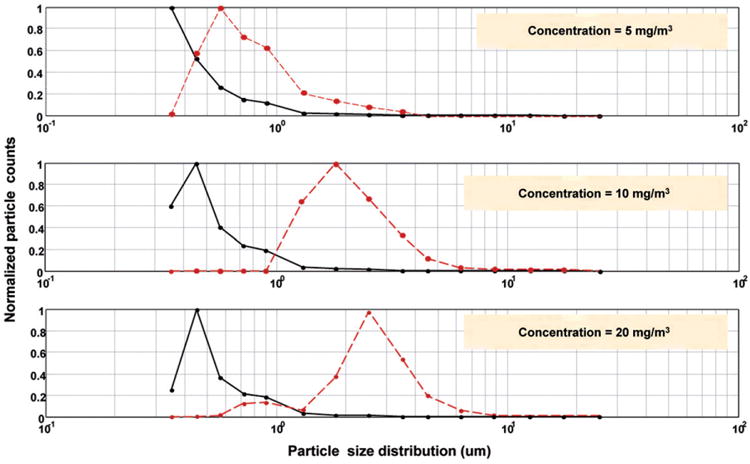
The aerodynamic particle size distributions in the exposure chamber using a venturi de-agglomerator/diluter or a basic “T” fitting diluter.
Figure 9.
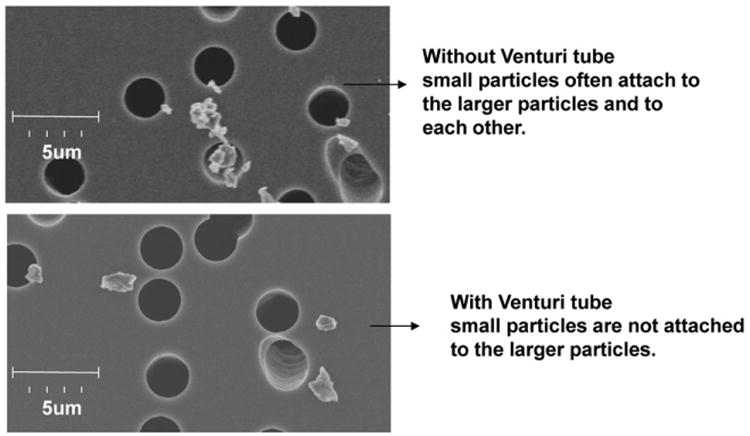
Photo micrographs of aerosols that were generated with a venturi de-agglom-erator/diluter compared with a “T” diluter.
Figure 10.
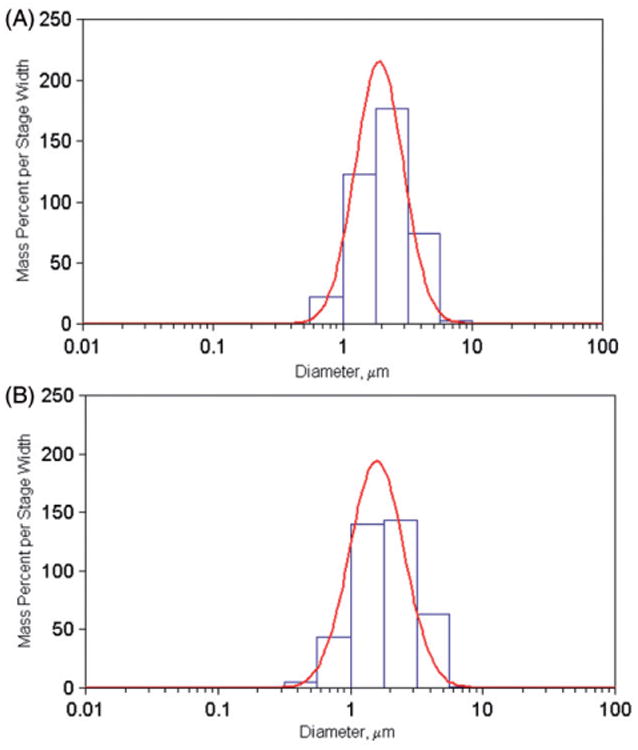
Particle mass size distribution measured with an MOUDI impactor.
Spatial variation in aerosol concentrations within exposure chamber
Sampling pumps and filters were placed in the cylindrical exposure chamber as shown in Figure 11 with one in the center of the chamber and three others placed symmetrically at 0°, 120° and 240° in animal cages. The target mass concentration of the silica aerosol was 12mg/m maintained for 2.5 h, during four separate exposure runs. Chamber samples were collected by drawing aerosol through 47 mm polycarbonate filters (Whatman, Clinton, PA) at a flow rate of 0.2l/min with a sample pump (SKC, Pocket Pump, model # 210-1002). The flow rate was chosen to simulate the average minute ventilation of a rat. The filters, collected after each exposure period, were weighed and the variation in filter weights at each location was determined. The results are given in Table 1. The total mean concentration averaging all locations was 12mg/m3. The mean concentrations at each measured chamber location were within ±5% of the target concentration.
Figure 11.
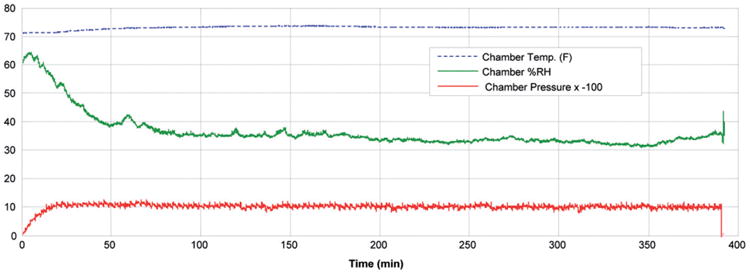
Exposure chamber temperature, humidity and pressure versus time during a typical exposure with animals in the chamber.
Table 1.
Variations in exposure chamber concentration as a function of location.
| Exposure chamber sample location (as seen from above) | Mean concentration (mg/m3) | SD (mg/m3) |
|---|---|---|
| Center animal cage | 11.55 | 0.70 |
| Outer animal cage at 12 o’clock | 12.16 | 1.06 |
| Outer animal cage at 4 o’clock | 11.86 | 0.85 |
| Outer animal cage at 8 o’clock | 12.43 | 0.38 |
Variation in exposure chamber temperature and humidity versus time
Temperature and relative humidity measurements inside the exposure chamber were made continuously using a temperature/humidity probe (Vaisala, HMP60). These parameters were not under feedback control, but they were monitored and continuously logged during each exposure run. A damp mat was placed in the lower portion of the exposure chamber, under the exhaust ports, during testing of the exposure system and during each animal exposure period to provide a humidity source. Figure 11 shows the temperature, humidity and exposure chamber pressure relative to ambient pressure during a typical 6-h exposure period with animals present. The average temperature was 73°F, the relative humidity ranged from 31% to 63% and the chamber pressure was continuously held at −0.1 in H2O.
Discussion and conclusions
A computer-controlled system for exposing small laboratory animals to silica aerosols was designed, fabricated and performance tested. A two-staged silica generation method was used to aerosolize and disperse the silica dust into single particles. Stage one, an acoustical aerosol generator, acted as an aerosol feeder to the second stage, a venturi aerosol disperser. The acoustical generator supplied a uniformly regulated source of silica particles to the throat of a venturi that increased the dispersion of agglomerated particles before the aerosol entered the animal exposure chamber.
The two-stage method used in this system has several advantages over feeding a dry dust directly into a venturi via a hopper or funnel: (1) the concentration can be precisely controlled by varying the power delivered to the acoustical generator, (2) large clumps of powder will not clog the venturi because they remain in the acoustical generator and will not be fed to the venturi and (3) aerosols that are above the respirable limit will not be delivered to the exposure chamber. In general, the system met or exceeded all the project objectives. (1) The exposure system, controlled by several feedback loops, used custom software to provide a constant aerosol concentration of well dispersed silica particles for extended time periods. (2) The exposure system was capable of providing a range of inhalation doses. (3) The size distribution of the silica aerosol remained constant during repeated exposure periods at a given mass concentration. (4) The particles delivered to the exposure chamber were de-agglomerated and did not include particles >5 μm. (5) The “overshoot” of the aerosol concentration during the initial rise transient was minimal. (6) The exposure chamber was capable of exposing 24 mice or 8 rats to a constant aerosol concentration at all locations in the chamber during an exposure period. (7) The exposure chamber temperature and relative humidity were monitored and maintained between the acceptable ranges of 71–75°F and 30–65%, respectively. (8) The system required a minimum of operator intervention over an exposure period. Following testing, this method for exposing small animals to various constant concentrations of SiO2 has proven to be very successful for researchers at NIOSH (Sellamuthu et al., 2011, 2012). This exposure system was developed for crystalline silica particles, however the system would likely work with a wide variety of dry particles. It is also possible that the exposure system could be scaled up with minimal difficulty to accommodate much larger exposure chambers that can house more animals which would be required for long term lower concentration inhalation studies.
Footnotes
Declaration of interest: The findings and conclusions of this work are those of the authors and do not necessarily represent the views of the National Institute for Occupational Safety and Health.
References
- Aydin C, Grace CE, Gordon CJ. Effect of physical restraint on the limits of thermoregulation in telemetered rats. Exp Physiol. 2011;96:1218–27. doi: 10.1113/expphysiol.2011.060301. [DOI] [PubMed] [Google Scholar]
- Calvert G, Rice F, Boiano J, et al. Occupational silica exposure and risk of various diseases: an analysis using death certificates from 27 states of the United States. Occup Environ Med. 2003;60:122–9. doi: 10.1136/oem.60.2.122. [DOI] [PMC free article] [PubMed] [Google Scholar]
- Gamaro GD, Michalowski MB, Catelli DH, et al. Effect of repeated restraint stress on memory in different tasks. Braz J Med Biol Res. 1999;32:341–7. doi: 10.1590/s0100-879x1999000300015. [DOI] [PubMed] [Google Scholar]
- Hughes JM, Weill H, Rando RJ, et al. Cohort mortality study of North American industrial sand workers. II. Case-referent analysis of lung cancer and silicosis deaths. Ann Occup Hyg. 2001;45:201–7. [PubMed] [Google Scholar]
- Jakab GJ, Hemenway DR. Restraint of animals required for nose-only inhalation toxicologic studies suppresses pulmonary antibacterial defenses. Inhal Toxicol. 1989;1:289–300. [Google Scholar]
- Knutsson A, Damber L, Jarvholm B. Cancers in concete works: results of a cohort study of 33 688 workers. Occup Environ Mid. 2000;57:264–7. doi: 10.1136/oem.57.4.264. [DOI] [PMC free article] [PubMed] [Google Scholar]
- McKinney W, Chen B, Frazer D. Computer controlled multi-walled carbon nanotube inhalation exposure system. Inhal Toxicol. 2009;21:1053–61. doi: 10.1080/08958370802712713. [DOI] [PubMed] [Google Scholar]
- Nise NS. Control systems engineering. 2nd. Menlo Park, CA: Addison-Wesley Publishing Company; 1995. [Google Scholar]
- Peretz A, Checkoway H, Daufman JD, et al. Silica, silicosis, and lung cancer. Isr Med Assoc J. 2006;8:14–118. [PubMed] [Google Scholar]
- Rafnsson V, Ingimarsson O, Hjalmarsson I, Gunnarsdottir H. Association between exposure to crystalline silica and risk of sarcoidosis. Occup Environ Med. 1998;55:657–60. doi: 10.1136/oem.55.10.657. [DOI] [PMC free article] [PubMed] [Google Scholar]
- Rosenman K, Zhu Z. Pneumoconiosis and associated medical conditions. Am J Indus Med. 1995;27:107–13. doi: 10.1002/ajim.4700270110. [DOI] [PubMed] [Google Scholar]
- Sellamuthu R, Umbright CM, Roberts J, et al. Blood gene expression profiling detects silica induced pulmonary damage. Toxicol Sci. 2011;122:253–64. doi: 10.1093/toxsci/kfr125. [DOI] [PubMed] [Google Scholar]
- Sellamuthu R, Umbright CM, Roberts J, et al. Transcriptomics analysis of lungs and peripheral blood of crystalline silica exposed rats. Inhal Toxicol. 2012;24:570–9. doi: 10.3109/08958378.2012.697926. [DOI] [PMC free article] [PubMed] [Google Scholar]
- Tyl RW, Ballantyne B, Fisher LC, et al. Evaluation of exposure to water aerosol or air by nose-only or whole-body inhalation procedures for CD-1 mice in developmental toxicity studies. Toxicol Sci. 1994;23:251–60. doi: 10.1006/faat.1994.1103. [DOI] [PubMed] [Google Scholar]
- Weyel DA, Ellakkani M, Alarie Y, Karol M. An aerosol generator for the resuspension of cotton dust. Toxicol Appl Pharmacol. 1984;76:544–7. doi: 10.1016/0041-008x(84)90359-4. [DOI] [PubMed] [Google Scholar]


