

Abstract
Aims/Introduction
To assess the effects of sodium glucose co-transporter 2 inhibitor therapy on the pathophysiology of type 2 diabetes.
Materials and Methods
We administered ipragliflozin to 21 inpatients with type 2 diabetes for 7 days, and analyzed the diurnal profiles of plasma glucose and 3-hydroxybutyrate. A total of 21 age-, sex- and body mass index-matched diabetic patients served as controls.
Results
Continuous glucose monitoring showed that the 24-h glucose curve was shifted downward without hypoglycemia by the administration of ipragliflozin. The average glucose level was reduced from 182 ± 54 mg/dL to 141 ± 33 mg/dL (P < 0.0001). The magnitude of the reduction was highly correlated with the baseline average glucose level. Homeostasis model assessment of insulin resistance was decreased, and homeostasis model assessment of β-cell function was increased during the treatment. Urinary glucose excretion was correlated with the average glucose level both on day 0 and on day 7, although the regression line was steeper and shifted leftward on day 7. The ipragliflozin-treated patients lost more weight than the control patients (1.4 ± 0.5 vs 0.5 ± 0.6 kg, P < 0.0001). Plasma levels of 3-hydroxybutyrate were significantly increased with peaks before breakfast and before dinner. Patient age and bodyweight loss were negatively and positively correlated with the peak levels of 3-hydroxybutyrate on day 7, respectively.
Conclusions
The ipragliflozin treatment improved the 24-h glucose curve without causing hypoglycemia. The close correlation between the magnitude of glucose reduction and the baseline plasma glucose concentration suggests that the risk of hypoglycemia is likely low. It might be prudent to monitor ketone body levels in younger patients and in patients with rapid weight loss.
Keywords: 3-Hydroxybutyrate, Continuous glucose monitoring, Sodium glucose co-transporter inhibitor
Introduction
Recently, the role of glucose reabsorption by the renal proximal tubule has emerged as an essential part of glucose homeostasis. Under normal physiological conditions, approximately 160–180 g of glucose is filtered by the kidneys in a day, and virtually all glucose filtered is reabsorbed by the renal proximal tubule and returned to the circulation1,2. In a hyperglycemic state, the ability of the proximal tubule to reabsorb glucose increases as the filtered glucose load increases until the maximum glucose transport capacity is reached. When the reabsorption capacity of the proximal tubule is surpassed, glucosuria becomes apparent. The renal threshold of plasma glucose for urinary glucose excretion is 180–200 mg/dL in healthy individuals1,3. Glucose reabsorption from the glomerular filtrate into renal tubular epithelial cells is mediated by sodium glucose co-transporter (SGLT) proteins. Approximately 90% of the filtered glucose is reabsorbed through SGLT2, a low-affinity, high-capacity transporter located predominantly in the S1 segment of the renal proximal tubule, and the remainder is reabsorbed through SGLT1, a high-affinity, low-capacity transporter located in the S2 and S3 segments4–6.
The maximum tubular reabsorption capacity for glucose is significantly increased in patients with diabetes7,8. As a result, renal glucose excretion is often disproportionally low in the hyperglycemic state. The inadequate renal excretion of excess plasma glucose likely promotes the elevation of plasma glucose. The augmented reabsorption of glucose by the renal proximal tubule is partly attributable to a compensatory increase in glucose reabsorption through SGLT1. Furthermore, an increase in SGLT2 expression has been shown to be one of the molecular mechanisms responsible for the increase in the renal threshold in diabetic patients9–11. Thus, the reduction of renal glucose reabsorption through the inhibition of SLGT2 is a rational approach to improving glucose metabolism in diabetic patients.
Several SGLT2 selective inhibitors have come onto the market and are available for the treatment of type 2 diabetes. SGLT2 inhibitors might offer some advantages over other classes of hypoglycemic agents. When used as monotherapy, SGLT2 inhibitors have a low risk for hypoglycemia because of their insulin-independent mode of action12–17. The urinary excretion of excess glucose could result in decreased glucose toxicity, and thereby preserve islet mass and improve insulin sensitivity. Another favorable effect of SGLT2 inhibitors is a reduction in bodyweight. In contrast, the known adverse effects of SGLT2 inhibitors include an increased risk of dehydration, urinary tract infections and mycotic genital infections because of the increase in urinary glucose. An add-on therapy of an SGLT2 inhibitor to insulin or insulin secretagogues could increase the risk of hypoglycemia. Furthermore, the increased urinary glucose excretion could result in glucose deficiency, leading to ketoacidosis in some patients with insulin secretory defects or those who ingest low-carbohydrate foods.
Although it has been established that SGLT2 inhibitors have hypoglycemic effects in patients with type 2 diabetes, the effects of SGLT2 inhibitors on continuous glucose monitoring (CGM)-recorded glucose curve remain to be fully described. Furthermore, SGLT2 inhibitor-induced changes in diurnal profiles of plasma ketone bodies have not been reported. The aims of the present study were to elucidate the effects of short-term ipragliflozin therapy on diurnal profiles of glucose and 3-hydroxybutyrate (3HB), bodyweight, blood pressure, hematocrit, serum uric acid, electrolytes, insulin resistance, and β-cell function. In addition, we assessed the factors that contribute to the acceleration of ketogenesis induced by the administration of ipragliflozin.
Materials and Methods
The participants of the present study were 21 inpatients with type 2 diabetes, aged 57 ± 10 years, with a body mass index (BMI) of 28.9 ± 4.3 kg/m2 (Table1). The required sample size to assess the hypoglycemic effect was calculated to be 16 using the data of fasting plasma glucose in a double-blind glycemic control trial of ipragliflozin in Japanese patients18. The participants of this study were recruited from patients admitted to the Kurume University Hospital, Kurume, Japan, for glycemic control. The diagnosis of type 2 diabetes was established based on the American Diabetes Association19 and Japan Diabetes Society20 criteria for diabetes as well as on the absence of pancreatic autoimmune markers, including glutamic acid decarboxylase antibodies and insulinoma-associated-2 antibodies. Patients with renal failure or severe liver disease were excluded. A total of 21 age-, sex- and BMI-matched patients with type 2 diabetes served as a control group (Table1). We analyzed the changes of metabolic parameters during the second week of admission. Although this was not a randomized study, there was no significant difference between the ipragliflozin group and the control group in metabolic parameters or pharmacological treatment. The patients of both groups ate a standardized low-fat meal at 08.00, 12.00 and 18.00 h, and carried out only mild exercise, such as walking, during the study period. The maximum dose of glimepiride was 2 mg/day at baseline. The doses of the hypoglycemic agents were unchanged during the study period.
Table 1.
Clinical features of participants
| Characteristic | Ipragliflozin group | Control group |
|---|---|---|
| Age (years) | 57 ± 10 | 56 ± 11 |
| Sex (male/female) | 10/11 | 0/11 |
| Body mass index (kg/m2) | 28.9 ± 4.3 | 28.5 ± 4.2 |
| AST (IU/L) | 41 ± 29 | 39 ± 35 |
| ALT (IU/L) | 52 ± 41 | 44 ± 44 |
| Creatinine (mg/dL) | 0.66 ± 0.18 | 0.66 ± 0.22 |
| eGFR (mL/min/1.73 m2) | 88.2 ± 22.0 | 90.9 ± 26.1 |
| Total cholesterol (mg/dL) | 183 ± 46 | 183 ± 37 |
| HDL cholesterol (mg/dL) | 47.8 ± 8.5 | 46.2 ± 9.9 |
| LDL cholesterol (mg/dL) | 114.8 ± 32.6 | 116.2 ± 31.4 |
| Triglyceride (mg/dL) | 161 ± 103 | 163 ± 94 |
| Fasting plasma glucose (mg/dL) | 181 ± 48 | 161 ± 36 |
| HbA1c (%) | 10.2 ± 2.2 | 9.3 ± 1.6 |
| Fasting serum CPR (ng/mL) | 2.3 ± 1.0 | 2.5 ± 1.1 |
| Pharmacological treatment (n) | ||
| Insulin | 0 | 2 |
| Metformin | 12 | 15 |
| Glimepiride | 7 | 8 |
| DPP4 inhibitors | 6 | 5 |
| Pioglitazone | 1 | 0 |
| Exenatide | 1 | 0 |
ALT, alanine transaminase; AST, aspartate transaminase; CPR, C-peptide immunoreactivity; DPP4, dipeptidyl peptidase-4; eGFR, estimated glomerular filtration rate; HbA1c, glycated hemoglobin; HDL, high-density lipoprotein; LDL, low-density lipoprotein.
After an approximately 7-day stabilizing period in a diabetes/endocrinology ward, 50 mg of ipragliflozin was given to each patient of the ipragliflozin group after breakfast for 7 days. In our clinical experience, plasma glucose concentration declined on the second day of ipragliflozin treatment and appeared to reach stable levels within a week. Blood samples were obtained on the day before the initiation of ipragliflozin (day 0) and on the 7th day of the ipragliflozin treatment (day 7). We measured the pre- and postprandial levels of plasma glucose, 3HB and free fatty acid (FFA). The 3HB and FFA values were measured by enzymatic methods using an auto analyzer (Hitachi High-Tech, Tokyo, Japan). The iPro™ 2 (Medtronic, Northridge, CA, USA) CGM devices were used to monitor subcutaneous glucose levels at 5-min intervals to determine glycemic control on day 0 and day 7. The CGM device was applied to each patient no later than noon of the preceding day, and glucose levels were measured for at least 48 h including day 0 or day 7 during hospitalization. CGM data on day 0 and day 7 were used to calculate mean amplitude of glycemic excursions, mean postprandial glucose excursion, constant variation, percentage of time ≥140 mg/dL or <70 mg/dL, area under the curve ≥180 mg/dL and area over the curve <70 mg/dL. Insulin resistance and insulin secretory capacity were assessed by the homeostasis model assessment of estimated insulin resistance (HOMA-IR) and HOMA of β-cell function (HOMA-β), respectively. Bodyweight and blood pressure were measured before breakfast every day. We also measured urinary glucose excretion and urine volume per day. The primary end-point was the improvement of diurnal glucose profile. Secondary end-points included changes in plasma 3HB, bodyweight, blood pressure, hematocrit, uric acid, electrolytes, HOMA-IR, HOMA-β and adverse events including hypoglycemia.
The study was approved by the ethical committee of Kurume University, and was carried out in accordance with the ethical standards laid down in the 1964 Declaration of Helsinki and its later amendments. The procedure was explained, and written informed consent was obtained from all patients.
Statistical Analysis
The data are expressed as the mean ± standard deviation (SD). Statistical analysis was carried out using SAS v.9.3 (SAS Institute, Cary, NC, USA). Pearson's correlations were used to evaluate the factors associated with the pre-breakfast and pre-dinner 3HB levels. The paired Student's t-test was used to test the difference in the means between baseline and post-treatment data. The serum levels of aspartate transaminase, alanine transaminase, triglyceride, immunoreactive insulin and 3HB were transformed into logarithms to improve the skewed distribution. The results with a P < 0.05 were considered statistically significant.
Results
Urinary glucose excretion and urine volume were increased on the first day of the ipragliflozin treatment, and remained elevated throughout the study period (Figure1). The average increases in urine glucose and urine volume were 55.4 ± 21.7 g/day and 468 ± 552 mL/day, respectively. The patients lost 1.4 ± 0.5 kg of bodyweight during the 7-day ipragliflozin treatment (Figure2a). The reduction of bodyweight was significantly greater than that of the control group (0.5 ± 0.6 kg, P < 0.0001). Preprandial glucose levels were approximately stable during the 3-day period preceding the initiation of ipragliflozin (Figure2b). When the ipragliflozin administration began, its hypoglycemic effect appeared quickly; pre-lunch and pre-dinner glucose levels fell on the first day, and pre-breakfast glucose values were reduced on the second day. The 7-day ipragliflozin treatment resulted in significantly lower plasma glucose levels compared with baseline levels at each time-point of blood sampling (Figure3a).
Figure 1.

(a) Urinary glucose excretion and (b) urine volume during the ipragliflozin treatment. Mean and standard deviation.
Figure 2.
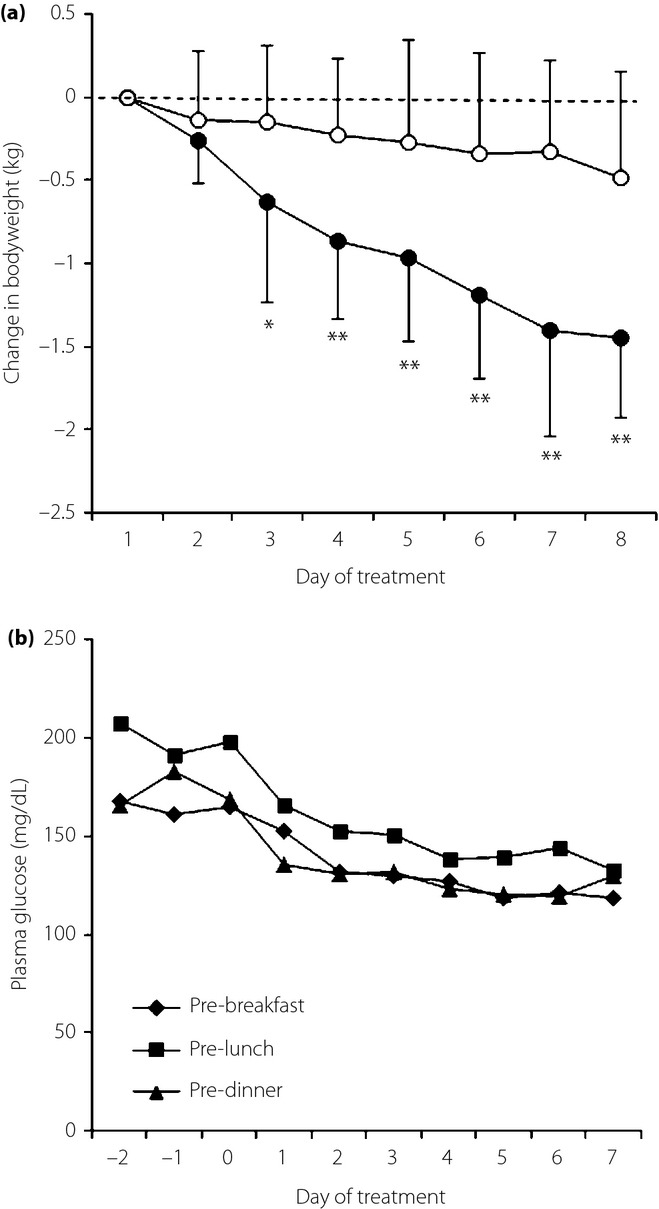
(a) Changes in bodyweight in the ipragliflozin group (closed circle) and the control group (open circle). Mean and standard deviation. *P < 0.01, **P < 0.001 vs control group. (b) Preprandial plasma glucose levels during the 3 days preceding the initiation of ipragliflozin and during the 7-day ipragliflozin treatment.
Figure 3.
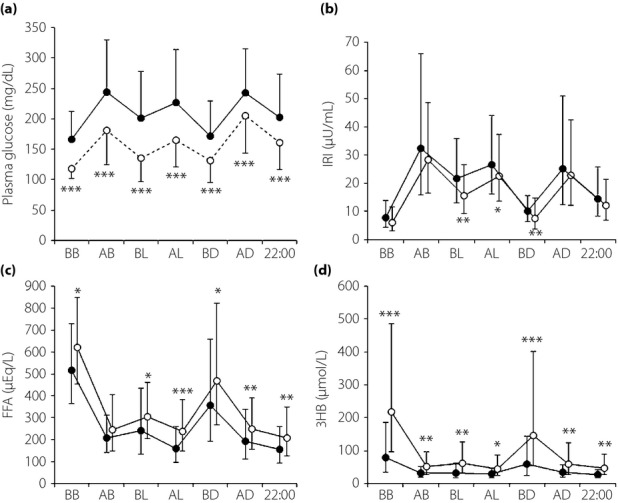
The diurnal variations of (a) plasma glucose, (b) immunoreactive insulin (IRI), (c) free fatty acid (FFA) and (d) 3-hydroxybutyrate (3HB) on day 0 (closed circle) and on day 7 (open circle) of the ipragliflozin treatment. Mean and standard deviation. Means and standard deviations of the IRI, FFA, and 3HB levels were calculated after log transformation of the data. *P < 0.05, **P < 0.01, ***P < 0.001. AB, after breakfast; AD, after dinner; AL, after lunch; BB, before breakfast; BD, before dinner; BL, before lunch.
The CGM showed a significant reduction in glucose levels throughout the day (Figure4a,b). The 24-h average glucose level decreased from 182 ± 54 mg/dL to 141 ± 33 mg/dL (P < 0.0001). No hypoglycemia was detected during the study period. There was no significant difference between patients receiving sulfonylurea and those without sulfonylurea in glucose levels at any time-point. Glucose levels below 70 mg/dL were recorded by CGM only in three patients without sulfonylurea treatment. The lowest glucose value was 75 mg/dL in the patients receiving sulfonylurea. The proportion of time spent in the 70–139 mg/dL blood glucose range increased from 29.2 ± 30.9% to 57.3 ± 26.5% (P < 0.0001; Figure4c,d). Mean postprandial glucose excursion and area under the curve >180 mg/dL were significantly reduced after the 7-day ipragliflozin treatment (Table2). The magnitude of reduction in the 24-h average glucose concentration after the ipragliflozin treatment was highly correlated with the average glucose level on day 0 (Figure5a). Urinary glucose excretion was correlated with the average glucose level on both day 0 and day 7, although the regression line was steeper and shifted leftward on day 7 of the ipragliflozin treatment (Figure5b).
Figure 4.
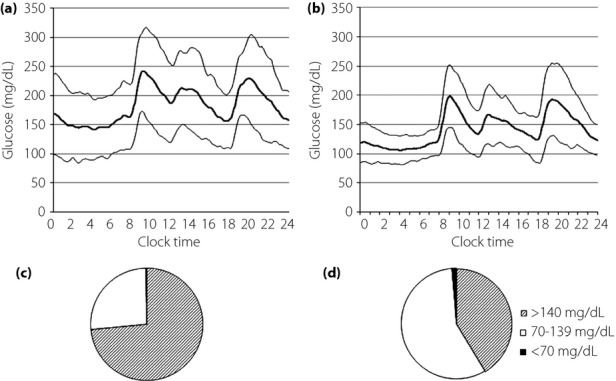
Average glucose levels of the 21 participants as measured by continuous glucose monitoring on (a) day 0 and (b) day 7. Mean, mean + standard deviation, and mean – standard deviation. The difference was statistically significant at all time-points. The proportion of time spent at glucose level <70 mg/dL, 70–139 mg/dL and ≥140 mg/dL on (c) day 0 and (d) day 7.
Table 2.
Parameters obtained from continuous glucose monitoring data of 21 participants treated with ipragliflozin
| Day 0 | Day 7 | P-value | |
|---|---|---|---|
| MAGE (mg/dL) | 94.3 ± 64.9 | 82.0 ± 32.2 | NS |
| MPPGE (mg/dL) | 44.7 ± 29.3 | 30.9 ± 20.1 | 0.008 |
| CV | 0.222 ± 0.068 | 0.222 ± 0.064 | NS |
| AUC >180 mg/dL (mg min/dL) | 644 ± 472 | 230 ± 269 | <0.0001 |
| AOC <70 mg/dL (mg min/dL) | 3 ± 12 | 19 ± 57 | NS |
AOC, area over the curve; AUC, area under the curve; CV, constant variation; MAGE, mean amplitude of glycemic excursion; MPPGE, mean of postprandial glucose excursion; NS, not significant.
Figure 5.
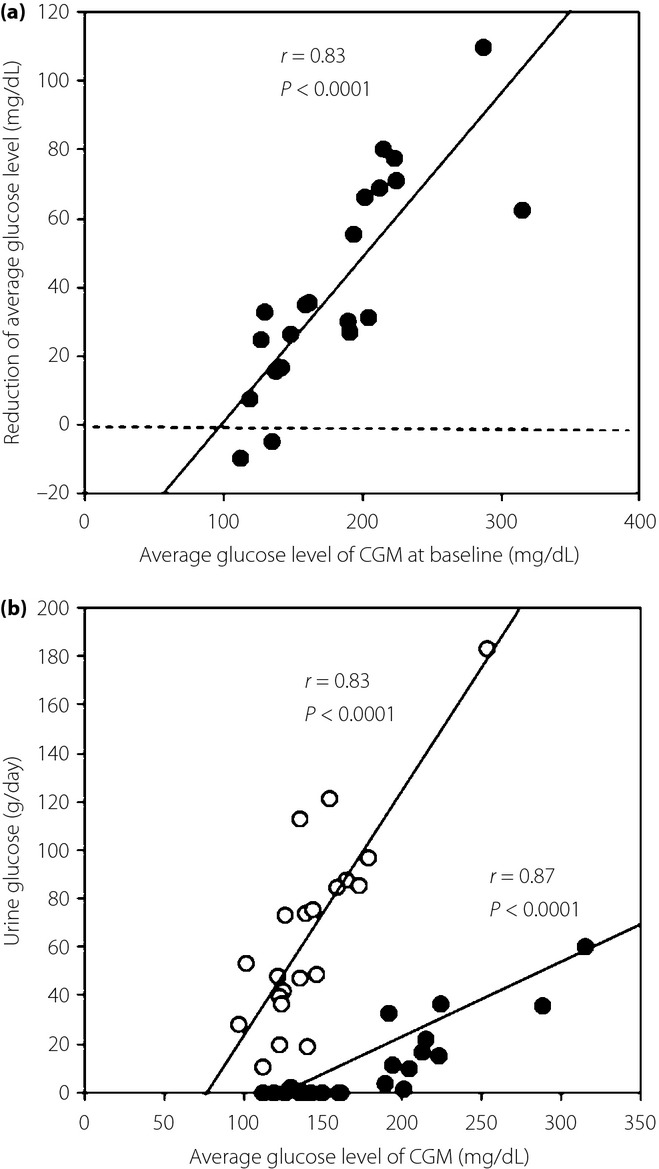
(a) Association between the average glucose level by continuous glucose monitoring (CGM) at baseline and the reduction in the average daily glucose concentration during the 7-day ipragliflozin treatment. (b) Association between the average glucose level of the CGM and 24-h urine glucose excretion on day 0 (closed circle) and on day 7 (open circle) of the ipragliflozin treatment.
The pre- and postprandial plasma IRI levels were almost comparable between day 0 and day 7, although IRI levels were slightly but significantly lower before lunch, after lunch and before dinner on day 7 (Figure3b). Consequently, HOMA-IR was decreased from 3.55 ± 1.84 to 2.11 ± 1.26 (P = 0.001), and HOMA-β was increased from 38.6 ± 28.6 to 51.6 ± 32.4 (P = 0.015). In contrast, plasma FFA levels were significantly higher except after breakfast on day 7 than on day 0 (Figure3c). Similarly, plasma levels of 3HB were significantly elevated at each time-point on day 7, with peaks before breakfast and before dinner (Figure3d). There were significant correlations between plasma FFA and 3HB levels (P < 0.05) at each point of blood collection on day 7. Pearson's correlation analysis showed that the patient age and bodyweight loss were negatively and positively correlated, respectively, with the pre-breakfast and pre-dinner 3HB levels after the 7-day ipragliflozin treatment (Table3). No significant changes were observed in blood pressure, hematocrit, uric acid or electrolytes except phosphate (Table4).
Table 3.
Pearson's correlation analysis of the factors associated with the pre-breakfast and pre-dinner 3-hydroxybutyrate levels on the 7th day of the ipragliflozin treatment
| Pre-breakfast 3HB | Pre-dinner 3HB | |||
|---|---|---|---|---|
| Correlation coefficient | P-value | Correlation coefficient | P-value | |
| Age | −0.70833 | 0.0003 | −0.53635 | 0.0122 |
| Sex (male) | −0.20889 | NS | −0.17064 | NS |
| BMI | −0.02143 | NS | 0.03072 | NS |
| Reduction in bodyweight | 0.66052 | 0.0011 | 0.64799 | 0.0015 |
| AST | 0.33098 | NS | 0.38878 | NS |
| ALT | 0.27228 | NS | 0.39473 | NS |
| Total cholesterol | 0.28012 | NS | 0.17225 | NS |
| HDL cholesterol | 0.03182 | NS | −0.07591 | NS |
| LDL cholesterol | 0.22337 | NS | 0.09282 | NS |
| Triglyceride | 0.29377 | NS | 0.21491 | NS |
| eGFR | 0.37494 | NS | 0.31113 | NS |
| Systolic blood pressure | −0.31088 | NS | −0.05392 | NS |
| Diastolic blood pressure | 0.25361 | NS | 0.29684 | NS |
| Pre-breakfast plasma glucose | 0.15811 | NS | −0.17735 | NS |
| Pre-dinner plasma glucose | 0.26006 | NS | −0.27157 | NS |
| Pre-breakfast IRI | 0.19529 | NS | 0.21952 | NS |
| Pre-dinner IRI | 0.11574 | NS | −0.11036 | NS |
| Use of metformin | −0.41113 | NS | −0.04505 | NS |
| Use of sulfonylurea | −0.22499 | NS | −0.01297 | NS |
| Use of DPP4 inhibitors | −0.27087 | NS | 0.02257 | NS |
Aspartate transaminase (AST), alanine transaminase (ALT), triglyceride, immunoreactive insulin (IRI) and 3-hydroxybutyrate (3HB) levels were transformed into logarithms to improve the skewed distribution. BMI, body mass index; DPP4, dipeptidyl peptidase-4; eGFR, estimated glomerular filtration rate; HDL, high-density lipoprotein; LDL, low-density lipoprotein; NS, not significant.
Table 4.
Changes in blood pressure, hematocrit, uric acid and electrolytes
| Ipragliflozin group | Control group | |||
|---|---|---|---|---|
| Day 0 | Day 7 | Day 0 | Day 7 | |
| Systolic blood pressure (mmHg) | 117 ± 16 | 116 ± 13 | 122 ± 11 | 123 ± 15 |
| Diastolic blood pressure (mmHg) | 78 ± 8 | 73 ± 11 | 73 ± 12 | 71 ± 10 |
| Hematocrit (%) | 41.1 ± 3.9 | 40.8 ± 4.1 | 39.2 ± 5.1 | 39.3 ± 4.9 |
| Uric acid (mg/dL) | 5.28 ± 1.94 | 4.87 ± 1.46 | 6.06 ± 1.51 | 6.34 ± 1.68 |
| Na (mEq/L) | 141 ± 2 | 141 ± 2 | 141 ± 2 | 141 ± 2 |
| K (mEq/L) | 4.0 ± 0.3 | 4.1 ± 0.3 | 4.0 ± 0.4 | 4.1 ± 0.4 |
| Cl (mEq/L) | 104 ± 2 | 105 ± 2 | 104 ± 2 | 104 ± 2 |
| Ca (mg/dL) | 9.11 ± 0.29 | 9.19 ± 0.31 | 9.13 ± 0.23 | 9.04 ± 0.32 |
| Pi (mg/dL) | 3.62 ± 0.43 | 3.93 ± 0.35* | 3.79 ± 0.70 | 3.80 ± 0.57 |
P = 0.002 vs day 0.
Discussion
We showed, using venous blood sampling and CGM, that the 7-day administration of ipragliflozin shifted the 24-h glucose profile downward without hypoglycemia. Although a number of clinical trials12,14–17,21,22 have reported that SGLT2 inhibitors reduced both fasting and postprandial glucose levels, the effect of SGLT2 inhibitor administration on the nocturnal glucose profile remains to be elucidated. In the present study, the stable nocturnal glucose profile shown by CGM after the ipragliflozin treatment was most impressive. It is also noteworthy that no hypoglycemia was observed despite the reduction in preprandial glucose levels, although the number of the participants was not large. The decrease of mean postprandial glucose excursion shows that postprandial glucose excursion was reduced by the ipragliflozin treatment.
The steady control of nocturnal glucose levels and the absence of hypoglycemia were associated with the observation that the magnitude of the hypoglycemic action was closely correlated with the 24-h average plasma glucose level on day 0. This finding is consistent with previous reports in which glycated hemoglobin reductions with SGLT2 inhibitors were greater in the subgroup with higher baseline glycated hemoglobin13,18,22.
A pharmacodynamic study of dapagliflozin reported that treatment with the SGLT2 inhibitor markedly reduced the renal threshold of plasma glucose23. Although the calculated threshold was extremely low (21 ± 46 mg/dL) in the dapagliflozin study, the urinary glucose excretion fell as plasma glucose decreased. Here, we show that ipragliflozin-induced urinary glucose excretion was correlated with the average glucose concentration obtained by the CGM, although the regression line was steeper and left-shifted compared with that before the treatment. It is unknown whether there is some difference between dapagliflozin and ipragliflozin with respect to their pharmacodynamic profiles. However, the correlation between the reduction in plasma glucose and the baseline glucose levels can be attributed to the association between urinary glucose excretion and plasma glucose concentration. Thus, the hypoglycemic risk of ipragliflozin seems to be low, except when it is combined with insulin or large-dose sulfonylureas.
Despite the marked reduction in plasma glucose levels, the 7-day treatment with ipragliflozin had only small effects on pre- and postprandial IRI levels. The pre-breakfast IRI value did not significantly change; therefore, HOMA-IR and HOMA-β was decreased and increased, respectively, after the treatment, likely reflecting reversal of glucose toxicity. Although the validity of the HOMA model is limited in hyperglycemic conditions and the adequacy of HOMA indices has not been established in patients receiving SGLT2 inhibitors, these observations suggest that ipragliflozin treatment ameliorates insulin resistance and insulin secretory capacity in diabetic patients. Thus far, the beneficial effects of SGLT2 inhibitors on insulin secretory capacity and insulin sensitivity have been shown in longer-term administration24–27. Our findings indicate that the improvements in β-cell function and insulin sensitivity occurred within a week of initiating SGLT2 inhibitor treatment.
Recently, we have reported that the plasma levels of 3HB and FFA show marked diurnal fluctuation in patients with type 2 diabetes, with two obvious peaks before breakfast and before dinner. Furthermore, the peak levels were inversely correlated with age28. The administration of sulfonylureas or DPP-4 inhibitors was shown to suppress the plasma 3HB levels, likely through their insulinotropic and/or glucagonstatic action. In contrast, the renal glucose loss induced by ipragliflozin might result in increased lipolysis and accelerated ketogenesis. In the present study, the plasma levels of both 3HB and FFA were increased after 7-day ipragliflozin administration, with the most obvious elevations in the pre-breakfast and pre-dinner 3HB levels. The positive correlation between plasma FFA and 3HB levels suggest that the enhanced ketogenesis could be partly attributable to the elevation of plasma FFA as a result of accelerated lipolysis. As expected, the 3HB levels before breakfast and before dinner were correlated with the reduction of bodyweight during the treatment. Interestingly, the plasma levels of 3HB were inversely correlated with age, suggesting that younger individuals, rather than elderly persons, are susceptible to hyperketonemia when a SGLT2 inhibitor is administered. Although mild to moderate increases in plasma ketone body levels during SGLT2 inhibitor therapy might be physiological and harmless, as in calorie restriction, marked hyperketonemia with a risk of ketoacidosis should be avoided.
The participants in the ipragliflozin group lost 1.4 ± 0.5 kg of bodyweight during the treatment. When compared with the control participants, the ipragliflozin-induced bodyweight loss was estimated to be approximately 1 kg. Although the elevation of plasma FFA and 3HB, and the correlation between 3HB levels and bodyweight loss show that lipolysis was largely involved in the reduction of bodyweight, it is likely that water loss partly contributed to the decrease of bodyweight.
SGLT-2 inhibitors have been shown to increase hematocrit18,21,24, and lower blood pressure12,13,15,17,24 and serum uric acid12,15,24 in clinical trials. However, no significant change was observed in blood pressure, hematocrit or serum uric acid in the present short-term study. Serum phosphate concentration was slightly but significantly increased after the ipragliflozin treatment, although the mechanism and physiological significance of the elevation are not known.
In conclusion, the SGLT2 inhibitor, ipragliflozin, showed a notable hypoglycemic effect in both the preprandial and postprandial states, and improved the 24-h glucose curve without hypoglycemia. The beneficial effects on β-cell function and insulin resistance became apparent within 1 week of the treatment. The magnitude of glucose-lowering action was correlated with plasma glucose concentrations; therefore, the hypoglycemic risk is likely low. When ipragliflozin is added to insulin or large-dose sulfonylureas, the careful prevention of hypoglycemia could be required soon after the initiation, because the hypoglycemic effect appeared quickly. It might be prudent to monitor plasma or urine ketone body levels in younger patients and in patients with rapid weight loss.
Acknowledgments
The authors received no specific financial support for this article.
Disclosure
KY received research funds from Astellas Pharma.
References
- Mather A, Pollock C. Glucose handling by the kidney. Kidney Int. 2011;79(Suppl. 120):S1–S6. doi: 10.1038/ki.2010.509. [DOI] [PubMed] [Google Scholar]
- DeFronzo RA, Davidson JA, Del Prato S. The role of the kidneys in glucose homeostasis: a new path towards normalizing glycaemia. Diabetes Obes Metab. 2012;14:5–14. doi: 10.1111/j.1463-1326.2011.01511.x. [DOI] [PubMed] [Google Scholar]
- Rave K, Nosek L, Posner J, et al. Renal glucose excretion as a function of blood glucose concentration in subjects with type 2 diabetes–results of a hyperglycaemic glucose clamp study. Nephrol Dial Transplant. 2006;21:2166–2171. doi: 10.1093/ndt/gfl175. [DOI] [PubMed] [Google Scholar]
- Turner RJ, Moran A. Heterogeneity of sodium-dependent D-glucose transport sites along the proximal tubule: evidence from vesicle studies. Am J Physiol. 1982;242:F406–F414. doi: 10.1152/ajprenal.1982.242.4.F406. [DOI] [PubMed] [Google Scholar]
- Quamme GA, Freeman HJ. Evidence for a high-affinity sodium-dependent D-glucose transport system in the kidney. Am J Physiol. 1987;253:F151–F157. doi: 10.1152/ajprenal.1987.253.1.F151. [DOI] [PubMed] [Google Scholar]
- Hediger MA, Coady MJ, Ikeda TS, et al. Expression cloning and cDNA sequencing of the Na+/glucose co-transporter. Nature. 1987;330:379–381. doi: 10.1038/330379a0. [DOI] [PubMed] [Google Scholar]
- Farber SJ, Berger EY, Earle DP. Effect of diabetes and insulin of the maximum capacity of the renal tubules to reabsorb glucose. J Clin Invest. 1951;30:125–129. doi: 10.1172/JCI102424. [DOI] [PMC free article] [PubMed] [Google Scholar]
- Mogensen CE. Maximum tubular reabsorption capacity for glucose and renal hemodynamcis during rapid hypertonic glucose infusion in normal and diabetic subjects. Scand J Clin Lab Invest. 1971;28:101–109. doi: 10.3109/00365517109090668. [DOI] [PubMed] [Google Scholar]
- Bakris GL, Fonseca VA, Sharma K, et al. Renal sodium-glucose transport: role in diabetes mellitus and potential clinical implications. Kidney Int. 2009;75:1272–1277. doi: 10.1038/ki.2009.87. [DOI] [PubMed] [Google Scholar]
- Rahmoune H, Thompson PW, Ward JM, et al. Glucose transporters in human renal proximal tubular cells isolated from the urine of patients with non-insulin-dependent diabetes. Diabetes. 2005;54:3427–3434. doi: 10.2337/diabetes.54.12.3427. [DOI] [PubMed] [Google Scholar]
- Tabatabai NM, Sharma M, Blumenthal SS, et al. Enhanced expressions of sodium-glucose cotransporters in the kidneys of diabetic Zucker rats. Diabetes Res Clin Pract. 2009;83:e27–e30. doi: 10.1016/j.diabres.2008.11.003. [DOI] [PMC free article] [PubMed] [Google Scholar]
- Ferrannini E, Ramos SJ, Salsali A, et al. Dapagliflozin monotherapy in type 2 diabetic patients with inadequate glycemic control by diet and exercise: a randomized, double-blind, placebo-controlled, phase 3 trial. Diabetes Care. 2010;33:2217–2224. doi: 10.2337/dc10-0612. [DOI] [PMC free article] [PubMed] [Google Scholar]
- Stenlof K, Cefalu WT, Kim KA, et al. Efficacy and safety of canagliflozin monotherapy in subjects with type 2 diabetes mellitus inadequately controlled with diet and exercise. Diabetes Obes Metab. 2013;15:372–382. doi: 10.1111/dom.12054. [DOI] [PMC free article] [PubMed] [Google Scholar]
- Kadokura T, Akiyama N, Kashiwagi A, et al. Pharmacokinetic and pharmacodynamic study of ipragliflozin in Japanese patients with type 2 diabetes mellitus: a randomized, double-blind, placebo-controlled study. Diabetes Res Clin Pract. 2014;106:50–56. doi: 10.1016/j.diabres.2014.07.020. [DOI] [PubMed] [Google Scholar]
- Kaku K, Watada H, Iwamoto Y, et al. Efficacy and safety of monotherapy with the novel sodium/glucose cotransporter-2 inhibitor tofogliflozin in Japanese patients with type 2 diabetes mellitus: a combined Phase 2 and 3 randomized, placebo-controlled, double-blind, parallel-group comparative study. Cardiovasc Diabetol. 2014;13:65. doi: 10.1186/1475-2840-13-65. [DOI] [PMC free article] [PubMed] [Google Scholar]
- Seino Y, Sasaki T, Fukatsu A, et al. Dose-finding study of luseogliflozin in Japanese patients with type 2 diabetes mellitus: a 12-week, randomized, double-blind, placebo-controlled, phase II study. Curr Med Res Opin. 2014;30:1231–1244. doi: 10.1185/03007995.2014.909390. [DOI] [PubMed] [Google Scholar]
- Inagaki N, Kondo K, Yoshinari T, et al. Efficacy and safety of canagliflozin in Japanese patients with type 2 diabetes: a randomized, double-blind, placebo-controlled, 12-week study. Diabetes Obes Metab. 2013;15:1136–1145. doi: 10.1111/dom.12149. [DOI] [PMC free article] [PubMed] [Google Scholar]
- Kashiwagi A, Kazuta K, Yoshida S, et al. Randomized, placebo-controlled, double-blind glycemic control trial of novel sodium-dependent glucose cotransporter 2 inhibitor ipragliflozin in Japanese patients with type 2 diabetes mellitus. J Diabetes Investig. 2014;5:382–391. doi: 10.1111/jdi.12156. [DOI] [PMC free article] [PubMed] [Google Scholar]
- American Diabetes Association. Standards of Medical Care in Diabetes - 2010. Diabetes Care. 2010;33:S11–S61. doi: 10.2337/dc10-S011. [DOI] [PMC free article] [PubMed] [Google Scholar]
- Committee of the Japan Diabetes Society on the Diagnostic Criteria of Diabetes Mellitus. Seino Y, Nanjo K, et al. Report of the committee on the classification and diagnostic criteria of diabetes mellitus. J Diabetes Investig. 2010;1:212–228. doi: 10.1111/j.2040-1124.2010.00074.x. [DOI] [PMC free article] [PubMed] [Google Scholar]
- Ji L, Ma J, Li H, et al. Dapagliflozin as monotherapy in drug-naive Asian patients with type 2 diabetes mellitus: a randomized, blinded, prospective phase III study. Clin Ther. 2014;36:84–100. doi: 10.1016/j.clinthera.2013.11.002. [DOI] [PubMed] [Google Scholar]
- List JF, Whaley JM. Glucose dynamics and mechanistic implications of SGLT2 inhibitors in animals and humans. Kidney Int. 2011;120:S20–S27. doi: 10.1038/ki.2010.512. [DOI] [PubMed] [Google Scholar]
- DeFronzo RA, Hompesch M, Kasichayanula S, et al. Characterization of renal glucose reabsorption in response to dapagliflozin in healthy subjects and subjects with type 2 diabetes. Diabetes Care. 2013;36:3169–3176. doi: 10.2337/dc13-0387. [DOI] [PMC free article] [PubMed] [Google Scholar]
- Rosenstock J, Aggarwal N, Polidori D, et al. Dose-ranging effects of canagliflozin, a sodium-glucose cotransporter 2 inhibitor, as add-on to metformin in subjects with type 2 diabetes. Diabetes Care. 2012;35:1232–1238. doi: 10.2337/dc11-1926. [DOI] [PMC free article] [PubMed] [Google Scholar]
- Polidori D, Mari A, Ferrannini E. Canagliflozin, a sodium glucose co-transporter 2 inhibitor, improves model-based indices of beta cell function in patients with type 2 diabetes. Diabetologia. 2014;57:891–901. doi: 10.1007/s00125-014-3196-x. [DOI] [PMC free article] [PubMed] [Google Scholar]
- Mudaliar S, Henry RR, Boden G, et al. Changes in insulin sensitivity and insulin secretion with the sodium glucose cotransporter 2 inhibitor dapagliflozin. Diabetes Technol Ther. 2014;16:137–144. doi: 10.1089/dia.2013.0167. [DOI] [PubMed] [Google Scholar]
- Merovci A, Solis-Herrera C, Daniele G, et al. Dapagliflozin improves muscle insulin sensitivity but enhances endogenous glucose production. J Clin Invest. 2014;124:509–514. doi: 10.1172/JCI70704. [DOI] [PMC free article] [PubMed] [Google Scholar]
- Nakayama H, Tokubuchi I, Wada N, et al. Age-related changes in the diurnal variation of ketogenesis in patients with type 2 diabetes and relevance to hypoglycemic medications. Endocr J. 2015;62:235–241. doi: 10.1507/endocrj.EJ14-0431. [DOI] [PubMed] [Google Scholar]