

Abstract
Estrogen receptor (ER)α-positive tumors are commonly treated with ERα antagonists or inhibitors of estrogen synthesis, but most tumors develop resistance, and we need to better understand the pathways that underlie the proliferative and tumorigenic role of this estrogen-activated transcription factor. We here present the first single-molecule sequencing of the estradiol-induced ERα transcriptome in the luminal A-type human breast cancer cell lines MCF7 and T47D. Sequencing libraries were prepared from the polyadenylated RNA fraction after 8 hours of estrogen or vehicle treatment. Single-molecule sequencing was carried out in biological and technical replicates and differentially expressed genes were defined and analyzed for enriched processes. Correlation analysis with clinical expression and survival were performed, and follow-up experiments carried out using time series, chromatin immunoprecipitation and quantitative real-time PCR. We uncovered that ERα in addition to regulating approximately 2000 protein-coding genes, also regulated up to 1000 long noncoding RNAs (lncRNAs). Most of these were up-regulated, and 178 lncRNAs were regulated in both cell lines. We demonstrate that Long Intergenic Non-protein Coding RNA 1016 (LINC01016) and LINC00160 are direct transcriptional targets of ERα, correlate with ERα expression in clinical samples, and show prognostic significance in relation to breast cancer survival. We show that silencing of LINC00160 results in reduced proliferation, demonstrating that lncRNA expression have functional consequences. Our findings suggest that ERα regulation of lncRNAs is clinically relevant and that their functions and potential use as biomarkers for endocrine response are important to explore.
Endocrine therapy is an integral adjuvant treatment for patients with hormone-dependent breast cancer (BC) and estrogen receptor (ER)α (ERα/ESR1) serves as a prognostic marker for responsiveness. A significant number of patients with ERα-positive tumors, however, fail to respond to therapy or develop resistance over time. Mechanistic insights into the molecular basis that underlies failure to respond or acquired resistance will enable the development of better predictive markers and more effective targeting mechanisms and ultimately facilitate improvements in disease outcomes and patient survival (1). ERα is a ligand-regulated transcription factor and therefore the effort to characterize its role in the cellular biology of BC is mainly concerned with understanding its gene-regulatory actions. In previous studies we have studied ERα-mediated regulation of the coding transcriptome and microRNAs (miRNAs) using microarray technology (2–4). The arrival of next-generation sequencing (NGS) has transformed these efforts, by allowing for unbiased assessment of ERα DNA binding and regulation of any genomic element on a genomic scale to uncover known and novel sites of ERα regulation. A wide number of studies have dissected the genomic binding of ERα (5–7), revealing that the receptor can bind from 1000 to 15 000 different loci. Not as many studies have been done to study the receptor's effect on gene regulation using NGS technology, although 1 report showed that ERα can regulate the steady-state levels of 3386 protein-coding genes (8). Another study, assessing nascent transcripts upon stimulation with 17β-estradiol (E2) using global run-on sequencing (GRO-seq), found approximately 6000 transcripts, coding and noncoding, whose transcription was regulated by ERα (9).
Although the existence of noncoding RNAs (ncRNAs) has been known for decades, the role of long ncRNAs (lncRNAs) in development and disease has only recently started to be investigated. Initially believed to be transcriptional “noise,” the extensive transcription across the whole genome is now, by most, considered to be of biological relevance. Aside from components of the splicing and translational machinery, the class of ncRNAs comprises pseudogenes, small ncRNAs (eg, miRNAs), and lncRNAs, the latter being defined as RNAs larger than 200 nucleotides. Like mRNAs, lncRNAs have exons and introns, are largely polyadenylated (polyA), and exist in splice variants, yet lack the potential to code for protein (10, 11). They are generally expressed at lower levels than mRNAs (12). Although still scarce, the data characterizing the functional roles of lncRNAs are increasing. Their demonstrated functions are diverse, ranging from chromatin modification, regulation of transcription and translation, to modulation of protein function through direct RNA-protein interactions (13). Importantly, it has been shown that lncRNAs exhibit higher tissue-specific expression than protein-coding genes and are expressed at specific stages of development (10, 13–15). The latest annotation of known and predicted genes from the Gencode project contains 20 345 protein-coding genes, 13 870 lncRNAs, and 14 206 pseudogenes (16).
Most cancer risk-associated loci lie outside of protein-coding regions of the genome and an increasing number of cancer-regulatory roles have been uncovered for individual lncRNAs (17, 18). This, together with their aforementioned tissue-specific expression, emphasizes the potential of lncRNAs as markers or targets in cancer prevention and treatment. As an example, the lncRNA HOX transcript antisense RNA (HOTAIR), aside from its implied roles in other cancers, is associated with metastasis in ERα-positive BC and has been reported to be induced by estrogen (19, 20). One demonstrated function of HOTAIR is the binding to polycomb repressive complex 2, by which BC cells turn on a metastasis-promoting set of genes (21). In addition, the lncRNA GAS5 has been demonstrated to be involved in regulation of apoptosis in BC cells (22), and a large number of very long, abundantly transcribed regions (hundreds of kb) in intergenic space has been associated with neoplastic transformation (23).
In this study, we aimed to utilize novel sequencing technologies in order to uncover new aspects of the ERα-regulated transcriptome. Using single-molecule sequencing technology developed by Helicos to circumvent amplification-induced biases, we analyzed the polyA RNA fraction, to generate a precise map of the estrogen-induced ERα transcriptome, including strand-specific transcript alignment. This approach has the advantage of defining both protein-coding and ncRNA targets in an unbiased manner (24, 25). We also explored our findings for clinical relevance and demonstrated direct binding of ERα to lncRNA sites.
Materials and Methods
Cell culture and treatment
Luminal A-type and ERα-positive MCF7 and T47D BC cell lines, from female patients, were acquired from ATCC. The cells were routinely cultured in DMEM and DMEM/F12 media (Life Technologies), respectively, supplied with fetal bovine serum and estrogen depleted, as previously described, before treatment (26). For high-throughput RNA sequencing (RNA-seq) experiments, estrogen-depleted cells were treated 8 hours with 10nM E2 or vehicle control, in replicate experiments. For time series, estrogen-depleted cells were treated for the indicated times with 10nM E2.
RNA extraction, cDNA synthesis, and quantitative real-time PCR (qPCR)
Total RNA was extracted from cultured cells using QIAzol and purified using the RNeasy kit (both QIAGEN) according to manufacturer's protocol. A total of 1 μg of total RNA was used for cDNA synthesis with random-hexamer primers, as previously described (26). qPCR experiments were run in technical triplicates using Fast SYBR Green for detection of amplification. Analysis of relative transcript levels using the delta delta threshold cycle (ΔΔCT) method were performed as previously described (26). Primers used for detection of amplification of coding and noncoding transcripts are provided upon request.
Chromatin immunoprecipitation (ChIP)
Immunoprecipitation of ERα-bound chromatin was carried out as previously described (27). Primers for amplified genomic regions are available upon request.
Library preparation and sequencing
Total RNA was extracted as described above, and thereafter twice enriched for the polyA fraction by separation with oligo(dT) magnetic beads. Enrichment was ensured by use of the mRNA Nano kit for Agilent Bioanalyzer 2100. Sample libraries were prepared and subjected to direct RNA-seq by Helicos Biosciences, whose technology has been described previously (23, 24, 28, 29). In short, this included heat fragmentation of RNA, cDNA synthesis using random-hexamer primers from 200-ng RNA, removal of residual RNA using Ribonuclease H, and the addition of a polyA tail to cDNA and 3′ blocking, before poly(dT) capture on the sequencing flow-cell, and sequencing by synthesis using fluorescently labeled nucleotides. Biological as well as technological duplicates from both cell lines were analyzed, thus constituting 8 samples that were sequenced in duplicates. Sequencing data are deposited at National Center for Biotechnology Information's Sequence Read Archive under accession SRP045437.
Data analysis and bioinformatics
Raw reads were filtered according to length and base composition, as previously described (29). Remaining reads were aligned to the human transcriptome (assembly hg19 with Gencode 19 annotation) using the Genomic Short-read Nucleotide Alignment Program (GSNAP) and Spliced Transcripts Alignment to a Reference (STAR) short-read aligners. GSNAP was run with parameters allowing for 3 mismatches and detection of novel splice sites, with all other alignment parameters at default value. STAR was run with parameters allowing for 3 mismatches, no multimapped reads, with all other parameters at default value. Remaining bioinformatics analyses were carried out in R, using packages edgeR and DESeq2 for normalization of count data, and to test for differential expression (DE). A cut-off value for expressed transcripts was set at 1 read per million (RPM) per sequenced sample. For DE, the union of transcripts from analysis with both programs, with absolute fold change ≥ 1.5 at false discovery rate (FDR) 5%, was used.
Analysis of gene expression in clinical samples and patient survival
Data from The Cancer Genome Atlas (TCGA) cohort of samples from patients with invasive breast carcinoma (BRCA) were used to assess clinical gene expression and perform stratified survival analyses. RNA-seq profiles for the BRCA samples were downloaded via Univeristy of California, Santa Cruz (UCSC) Cancer Genomics Hub as BAM files aligned to the human genome build UCSC hg19, and transcript levels were evaluated based on the Gencode transcript definition and using the Cufflinks software suite. Difference in overall survival (OS) was determined by stratification at indicated cut-offs and tested for significance determined by log-rank test (P < .05), using the survival R package. Coefficients for correlation between expression of genes was calculated as Pearson product-moment correlation and significance determined by a 2-sided Student's t test, using the R statistical environment.
Proliferation assay
We used 3-(4,5-dimethylthiazol-2-yl)-5-(3-carboxymethoxyphenyl)-2-(4-sulfophenyl)-2H-tetrazolium) PES: phenazine ethosulfate (MTS) assay to test whether LINC00160 affects the proliferation of MCF7 cells. Briefly, 3000 MCF7 cells/well were seeded in 96-well plate using DMEM with 10% fetal bovine serum, and after 24 hours, cells were transfected with siLINC00160, scramble small interfering RNA (siRNA), or DharmaFECT (transfection agent). siRNA concentration was optimized and efficacy controlled for, using qPCR, and 10nM scramble siRNA and siLINC00160 was selected for further experiments. Experiments were performed using 2 transfections (a second transfection repeated 48 h after the first), and cell proliferation was measured using MTS reagent 48 and 72 hours after single transfection and 96 hours after double transfection treatments. To measure cell proliferation, 20 μL of tetrazolium reagent were added to 100 μL of culture medium, and cells were incubated for 2 hours at 36°C, 5% CO2. The absorbance was measured at 490 nm using SpectraMax spectrophotometer. Significance was determined by a 2-sided Student's t test.
Results
Luminal A is the classical ERα-positive subtype of breast tumors, comprising those expressing both ERα and the progesterone receptor. To define ERα-mediated transcription, we choose to use 2 different luminal-A-like cell lines, MCF7 and T47D. Further, in order to minimize NGS errors (30) and ensure the robustness of analyses, the treatments of each cell line were replicated at a second occasion. In order to detect steady-state levels of genes affected by ERα, we used 8-hour treatments. We and others have previously found that steady-state mRNA levels of many directly enhanced and repressed targets are detectable at this time point, whereas levels of secondary targets are generally more pronounced later (27, 31).
High-throughput single-molecule RNA-seq showed high concordance between replicated samples and treatments
The polyA fraction of RNA was verified to show typical E2 induction of the classical ERα target gene TFF1 (data not shown) before being subjected to library preparation and sequencing, in technical and biological duplicates. The resulting sequencing reads were filtered for technical artifacts (read length, base composition, and occurrence of bases in order of addition to sequencing reaction) and the resulting number of reads per sample amounted to between 39 and 50 million, as shown in Table 1. Subsequently, the reads were aligned to the annotated human transcriptome with alignment software allowing for spliced alignment, ie, reads spanning splicing sites. The resulting number of aligned reads was between 17 and 26 million per sample (Table 1). The distribution of read lengths was comparable for all samples and our analysis showed that the distribution of mapped reads across the genome was similar across sample replicates and cell lines, although differences between the 2 cell lines were noted for chromosomes 5, 11, 17, 19, and X (Supplemental Figure 1, A and B). To assess the variation between treatments and sample preparations, we analyzed the correlation between replicated treatments (Figure 1A). For all but 1 treatment, the correlation coefficient was 0.93 or larger. For the remainder of the analyses, we set an expression cut-off at 1 RPM, as previously described (24). At that cut-off, we found 18 402 and 17 138 transcripts to be expressed in MCF7 and T47D, respectively. The expressed unique genes were highly similar (99%) in both replicates of each treatment, with one T47D vehicle sample slightly deviating (95% overlap) (Table 1). This apparent technical variation in one replicate for the vehicle-treated T47D led us to omit this replicate from the remaining analyses.
Table 1.
Summary Statistics for RNA-seq
| MCF7 |
T47D |
|||||||
|---|---|---|---|---|---|---|---|---|
| Vehicle | E2 | Vehicle | E2 | |||||
| Alignment | ||||||||
| Total | 50M | 50M | 42M | 45M | 59M | 52M | 50M | 39M |
| GSNAP | 19M | 19M | 20M | 19M | 26M | 19M | 20M | 21M |
| STAR | 17M | 18M | 17M | 17M | 24M | 17M | 17M | 17M |
| Expressed transcripts | 20 418 | 20 294 | 19 989 | 19 926 | 19 305 | 19 335 | 19 219 | 18 297 |
| Common | 19 158 | 18 902 | 17 592 | 17 775 | ||||
| 18 130 | 16 903 | |||||||
| 15 899 | ||||||||
Number of sequencing reads from each sample and the number of reads that were aligned to the genome with splice-aware short-read alignment programs GSNAP and STAR, respectively. Also shown, numbers of transcripts per replicate expressed at cut-off RPM ≥ 1.
Figure 1.
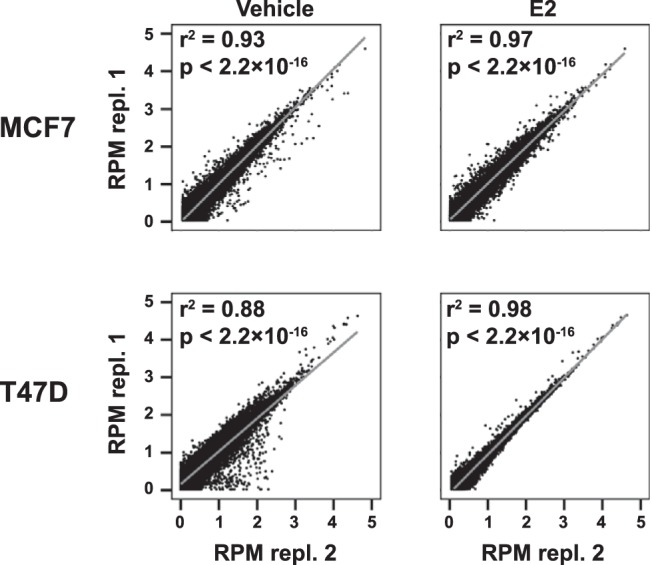
Summary of RNA-seq data for replicated MCF7 and T47D samples. Correlation between the RNA-seq data for annotated transcripts for biological replicates 1 and 2 for each condition (cell line, vehicle and E2 treatment). Shown are scatterplots for transcripts with RPM ≥ 1, Pearson product-moment correlation coefficients and corresponding P values.
Most the detected transcripts were protein-coding genes (13 491 and 13 060 for MCF7 and T47D, respectively), followed by lncRNAs (3114 and 2663) and pseudogenes (1497 and 1157) (Figure 2A, top panel). A small number of small ncRNAs (19 and 14, including, eg, miRNAs and small nuclear RNAs) were also detected. Ribosomal and mitochondrial reads were discarded for all analyses. Most expressed transcripts were found at RPM values less than 100 (Supplemental Figure 1B), and in accordance with previous studies, the protein-coding genes were in general expressed at levels higher than ncRNAs (Figure 2B). We conclude that there was a high correlation between expressed transcripts within the replicated experiments, and that approximately 26% (4611 out of 18 102, for MCF7) of the expressed polyA transcriptome in these Luminal A-type BC cells consist of lncRNAs and pseudogenes.
Figure 2.

E2 treatment induces changes in both the coding and noncoding transcriptome of MCF7 and T47D cells. A, Most detected RNAs are protein coding. Distribution of all expressed transcripts (RPM ≥ 1 in all replicates of both treatments), in either cell line among protein-coding mRNAs, lncRNA, pseudogenes, and small ncRNAs. Transcript type and status as defined by Gencode 19. B, A relatively large proportion of estrogen-regulated transcripts are lncRNAs. As in A but for all differentially expressed transcripts in either cell line. C, lncRNAs and pseudogenes are poorly expressed. Graphs showing expression levels of the different transcript types as cumulative frequency distribution, representative plot from analysis of 1 biological replicate shown. RPM values are on log scale. D, Most protein-coding, lncRNAs, and pseudogenes are up-regulated. Fraction of up- and down-regulated genes, respectively, by transcript type in differentially expressed genes common for both cell lines, or for the set of differentially expressed gens for either cell line. E, Hundreds of protein-coding and lncRNAs are regulated by E2 in both MCF7 and T47D. Venn diagrams showing overlap of differentially expressed genes for the total sets from both cell lines, as well as for only protein- and noncoding transcripts. F, qPCR data confirm RNA-seq data on E2 regulation of select genes for both cell lines. The 2 bars represent detected fold change values for E2 treatment vs vehicle, as measured by qPCR (n = 3) and RNA-seq, respectively. Error bars show SD, and significance calculated by Student's t test is indicated by *, P < .05; **, P < .01; ***, P < .001.
Detection of massive estrogen-mediated regulation of lncRNAs
Next, we conducted analysis of DE between E2- and vehicle-treated cells. For MCF7 and T47D, we observed 2462 and 3369 DE transcripts, respectively (Figure 2B). The higher number in T47D likely reflects the omitted vehicle replicate, ie, a higher likelihood of false positives. The distribution of transcript types largely reflected that of the total expressed transcriptome, ie, consisting predominantly in protein-coding RNAs but also other RNA species. However, relative to all expressed transcripts there was possibly an overrepresentation of DE lncRNAs in T47D. Over 39% of expressed lncRNAs compared with 16% of expressed protein-coding RNAs were regulated by estrogen. We found that 472 protein-coding transcripts and 178 lncRNAs were regulated by estrogen in both MCF7 and T47D cell lines (Figure 2E). Out of the DE genes detected in MCF7, 23% of the protein-coding genes were also regulated in T47D, whereas as much as 50% of the lncRNAs were commonly regulated in both cell lines. We found most E2-regulated genes to be induced, rather than suppressed, by E2 (Figure 2D). We confirmed the RNA-seq data using qPCR for select genes, verifying both common and cell-specific response to E2 (Figure 2F).
In summary, using single-molecule sequencing we define 472 protein-coding genes whose steady-state levels are regulated by ERα in both cell lines. Most estrogen-regulated protein-coding genes were unique to MCF7 or T47D line. By sharp contrast, the relative overlap of regulated lncRNAs was much higher, and as many as 178 lncRNAs were regulated in both MCF7 and T47D cells.
Sequencing uncovered novel clinically relevant protein-coding targets of ERα
The biological function of the DE transcripts was assessed by enrichment analysis of gene ontology (GO) biological processes among the common protein-coding genes, as well as among the whole sets of DE transcripts for MCF7 and T47D (Table 2). As expected, there was a significant overrepresentation of terms associated with cellular division and proliferation, indicative of the mitogenic role of E2 and ERα. Also, apoptosis-related GO terms were enriched for, concordant with the fact that ERα is capable of stimulating both proliferation and cell death (32, 33). The enriched GO terms mirrored observations reported in a study of ERα transcriptional targets using GRO-seq. Categories relating to metabolism of nucleic acids and transcription were significantly enriched for in both studies (data not shown) (9).
Table 2.
Transcriptome Response to E2 Treatment
| GO Term | Description | n | P Value | |
|---|---|---|---|---|
| Common | GO:0006412 | Translation | 50 | 9.1E-14 |
| GO:0022411 | Cellular component disassembly | 47 | 1.6E-13 | |
| GO:0010467 | Gene expression | 209 | 1.9E-10 | |
| GO:0019438 | Aromatic compound biosynthetic process | 177 | 2.2E-09 | |
| GO:0019222 | Regulation of metabolic process | 192 | 4.6E-03 | |
| MCF7 | GO:0007049 | Cell cycle | 271 | 1.8E-40 |
| GO:0034660 | ncRNA metabolic process | 97 | 1.1E-35 | |
| GO:0050896 | Response to stimulus | 6819 | 4.2E-35 | |
| GO:0006915 | Apoptotic process | 220 | 1.2E-18 | |
| GO:0008283 | Cell proliferation | 225 | 3.4E-18 | |
| T47D | GO:0022904 | Respiratory electron transport chain | 28 | 3.7E-07 |
| GO:0045216 | Cell-cell junction organization | 46 | 5.7E-05 | |
| GO:0050896 | Response to stimulus | 837 | 8.2E-04 | |
| GO:0008219 | Cell death | 243 | 1.2E-03 | |
| GO:0007049 | Cell cycle | 207 | 7.7E-03 |
GO enrichment analysis for differentially expressed protein-coding genes, including number of genes that were regulated within each overrepresented group (n) and P value. A group was considered enriched if P < .05. Analysis performed for the common set as well as the cell line-specific sets of DE.
In order to explore the set of DE transcripts in terms of ERα regulation and clinical relevance, we integrated previous data into our dataset. We analyzed TCGA data of gene expression in breast tumors (34) for correlation of our DE transcripts to the expression of ERα (Figure 3A). We carried out this analysis for all 1053 tumors, revealing 161 protein-coding genes, out of the common set of 472 genes, to be significantly correlated with ERα mRNA levels in clinical BC tumors, in a direction concordant with their regulation in the cell lines. Of the aforementioned 161 genes, 102 (Supplemental Table 1) were not identified in 2 previous large-scale studies aimed to define ERα-regulated genes in BC cells, suggesting that elimination of PCR bias through single-molecule sequencing can uncover novel candidates that are under the regulation of ERα (7, 9). New ERα-regulated genes discovered here include the uncharacterized proteins C19orf44, C17orf49 (a member of chromatin complexes) (35), KIAA1549 (part of fusion gene in glioma) (36), ZNF771, ZNF229, ZNF23 (down-regulated in human cancers and inhibits cell cycle progression) (37), ZNF8, ZNF93, TMEM229B (increases in breast and other cancers), along with RNA-binding proteins RBM34, RBMXL1 (possibly involved in X-chromosome silencing), and previously disease-associated CAGE1, CT62, DSCAM, ORAOV1, HPS5, SSSCA1, and PMEPA1. For the separate MCF7 and T47D gene sets, 576 and 704 genes, respectively, were correlated with ERα expression in human clinical tumors. Together, these numbers support that many of our identified DE transcripts are affected by ERα in human breast tumors in vivo.
Figure 3.

E2-regulated genes correlate with clinical ERα expression and have genomic ERα-binding sites. A, Plot showing the correlation coefficient for the differentially expressed protein-coding genes and ERα mRNA in clinical tumors from TCGA's BC RNA-seq data. Nonsignificant correlations illustrated in black, positively correlated and E2-induced genes in red, and negatively correlated and E2-repressed genes in green. B, Graphs showing the number of transcripts, by type, that possess an ERα-binding site within 200 or 50 kb of the TSS. Cell line-specific sets of differentially expressed transcripts were analyzed against ERα-binding data from respective cell line, whereas the common set incorporates data from both cell lines (40, 41). C, OS for TCGA's BRCA cohort, according to expression of indicated genes. The patient cohort was stratified at the median expression value of the genes, and the P values indicate log-rank test P values.
Comparing our genes whose steady-state levels where modified up or down by E2, with those identified as direct transcriptional targets using GRO-seq technology, we found some overlap and 663 (27%) out of the 2462 transcripts detected in MCF7, 447 (13%) out of the 3369 transcripts detected in T47D, and 181 out of the 650 detected (28%) as commonly regulated in both MCF7 and T47D. Examples of results that disagreed between the studies include some previously defined direct target genes, which we identified as up-regulated but GRO-seq noted as repressed, such as KCNK5 and GREB1 (27, 38).
Additionally, we assessed how many of the common DE genes showed prognostic significance in relation to patients' OS. Using the whole patient cohort, 152 of the estrogen-regulated protein-coding genes were found to significantly associate with a difference in OS (P < .05). Only incorporating ERα-positive tumors in this analysis, the number was comparable, at 157 genes (Supplemental Table 2). For example, many intracellular signaling genes (BLNK, NKIRAS1, PARK7, RAPGEFL1, ROCK2, ADCY6, CNIH2, CISH, EFNA1, MED13, NCOA3, PLCB4, P2RY11, SIAH2, SPSB3, and THBS1), and nuclear hormone receptor binding genes (MED13, NCOA3 [SRC3], PFDN6, and TRIP12), were correlated with OS.
Next, we examined which transcripts have cis-regulatory DNA occupied by ERα in order to postulate direct transcriptional activation or repression. We integrated our set of DE genes with known genomic binding sites for ERα, as assessed by ChIP followed by sequencing in both cell lines from previous publications (39, 40). Of the common DE protein-coding genes, a majority (75%) had ERα-binding sites within 50 kb of their transcription start sites (TSSs), according to at least one of the 2 datasets used. This was also the case for most protein-coding genes regulated by ERα that were unique to MCF7 (75%). By contrast, only 36% of ERα-regulated protein-coding genes unique to T47D had ERα-binding sites within 50 kb of their TSSs (Figure 3B). The lower fraction of genes with binding sites in T47D likely reflects the lower likelihood of detecting ERα-binding sites in this cell line, which expresses less ERα, as well as a higher incidence of false positives due to one missing replicate. However, the fact that T47D cells are less studied in this respect than MCF-7 cells, may also contribute. Of the DE genes that also correlated with ERα expression in clinical tumors, 47% had ERα-binding sites within 50 kb of their TSS. E2-regulated protein-coding genes that correlate with ERα expression clinically and/or associated with a difference in survival are listed in Supplemental Tables 1 and 2. Of these, 27 genes were not previously defined as estrogen-regulated in BC (7, 9) and correlated with both OS and with ERα expression in clinical tumors. These include the E2-up-regulated CISH, ZNF771, and UQCRQ (OS illustrated in Figure 3C).
lncRNAs are direct targets of ERα
Our study found the DE of 178 lncRNAs upon E2 stimulation in both cell lines. Integration of the ERα-binding data revealed that 70% of these lncRNAs had binding sites within 50 kb of the TSS, making them potential direct targets of ERα. Of these, 2 long intergenic RNAs (lincRNAs) (a lncRNA subclass), namely Long Intergenic Non-protein Coding RNA 1016 (LINC00160) and LINC01016, were confirmed by qPCR to be up-regulated by E2 in both MCF7 and T47D. An E2 time series revealed that both lincRNAs were significantly up-regulated already within 30 minutes, and notably, the induction of LINC01016 reached a substantial 50-fold up-regulation, compared with vehicle treatment, in both cell lines (Figure 4A). Both lincRNAs also have ERα-binding sites, intragenic and in their promoter regions (Figure 4B) (39, 40), and these binding sites overlapped with deoxyribonuclease I-hypersensitivity regions (UCSC genome browser) (data not shown), which are typically associated with open chromatin. Indeed, ChIP-qPCR confirmed ERα binding at 3 out of 4 assessed sites. The confirmed ERα binding to their cis-regulatory regions along with their rapid induction upon E2-treatment demonstrate that these lncRNAs are indeed direct targets of ERα.
Figure 4.

ERα regulates lncRNAs directly through genomic binding. A, qPCR data showing the E2 induced mRNA levels of the lncRNAs LNC01016 and LNC00160 over 72 hours of treatment. Line graphs fold change over vehicle treatment in MCF7 and T47D cells. The rapid regulation at 30 minutes indicates direct regulation. Error bars show SD, and significance compared with vehicle treatment at 0 hours calculated by Student's t test P = .05 indicated by a and b for MCF7 and T47D, respectively. B, ChIP-qPCR verifying the binding of ERα at genomic binding sites illustrated below, as previously indicated by published ChIP followed by sequencing (ChIP-seq) data. Experiments carried out in triplicate in MCF7, indicating fold enrichment over respective IgG control ChIP. Error bars show SD, and significance calculated by Student's t test indicated by *, P < .05; **, P < .01; ***, P < .001. C, Expression levels of LINC01016 and LINC00160 in normal tissue and ER-positive and ER-negative breast tumors in TCGA's BC cohort. Error bars show SEM. D, Kaplan-Meier curves showing association of expression of LINC01016 and LINC00160 with survival in luminal-A subtype BC patients in TCGA's BC cohort. Expression cut-offs and P values from log-rank test indicated in figure.
lncRNAs correlate with ERα expression and show prognostic significance as biomarkers in the TCGA BC patient cohort
In order to assess the clinical relevance of the ERα-regulated lncRNAs, we further analyzed the expression of the DE lncRNAs in clinical samples, using TCGA data. We found 38 of them (21%) to be significantly correlated with the expression of ERα, at P = .05 (Supplemental Table 3). The lincRNAs LINC01016 and LINC00160 were both expressed at higher levels in ERα-positive tumors, compared with both ERα-negative tumors and normal tissue (Figure 4C and Supplemental Figure 2, D and E), supporting that they are directly regulated by ERα in BCs in vivo. Of the 38 lncRNAs correlating with ERα expression, 26 were significantly associated with OS in BCs of the luminal A subtype (Supplemental Table 3). Thus, we propose that these lncRNAs are potential candidates for further studies as novel biomarkers and mediators of estrogenic effects.
Silencing of LINC00160 reduces proliferation
ERα is well known to enhance proliferation of ERα-positive BC cells, and many of its regulated downstream protein-coding genes are directly involved in the cell cycle. Whether any of its regulated lncRNAs take parts in this is, however, unknown. To explore this, we silenced one of the highly E2-regulated lncRNAs that we identified as a direct target, LINC00160, and measured resulting effects on proliferation after 24, 48, and 72 hours (Figure 5). We found that its silencing significantly reduced the proliferative ability of the BC cells. Thus, we propose that ERα-regulated lncRNAs can have functional roles in BC.
Figure 5.

Silencing of ERα-regulated lncRNA LINC00160 reduces proliferation of MCF7 BC cells. siRNA against LINC00160 and a scrambled control sequence was used at 10nM concentrations. Proliferation was determined 24, 48, and 96 hours after transfection using MTS assay. For the 96-hour time point, a second transfection was performed 48 hours after the first. Error bars show SD, and significance calculated by Student's t test indicated by *, P < .05
Discussion
We here describe out effort to characterize the E2-ERα transcriptome in 2 human BC cell lines using single-molecule RNA-seq. Amplification-based sequencing methods (including major methods such as Illumina and SOLiD) have a bias towards high-abundance transcripts, such as those associated with translational processes and housekeeping genes, resulting in relatively lower coverage of genes at low and midlevel abundance (26). Because single-molecule RNA-seq does not require PCR amplification of the libraries, it reduces primer bias, uneven coverage due to certain amplicons being preferentially amplified, PCR-introduced artifacts, and the selective exclusion of significant amounts of RNA during library preparation (23, 30). We were therefore able of uncover new targets of ERα. In our study, we treated MCF7 and T47D cancer cell lines for 8 hours with E2 and assessed the ensuing effects on the polyA fraction of the transcriptome, including both protein- and noncoding transcripts. At this time point, we will see both direct and indirect effects. Although analyzing just one time point will not necessarily capture all regulated genes, our previous studies show that this time point allow for accumulation of detectable levels of transcripts of primary targets and also ascertains detection of repressed genes, without inducing extensive downstream effects (2, 3, 27, 41). Although indirect targets will also be detected, our comparison with ERα chromatin-binding studies demonstrated that a large fraction of the regulated genes identified is inferred to be primary targets.
A significant advantage with the single-molecule RNA-seq technology is the potential for precise detection of low-abundance transcripts in an unbiased manner, hence the possibility to identify regulation of lncRNAs.
In addition to the above sources of error, sequencing errors and experimental variation are issues that can also affect the outcome (30). Although the use of replicates in NGS has commonly been replaced by sequence read depth and quality filters, this is insufficient in order to mitigate errors (30). Here, we used biological replicates for each treatment condition, as well as 2 different cell lines, each separately analyzed by RNA-seq and thus, despite the omission of one technological replicate, we present an exceptionally thorough transcriptome analysis of the luminal A BC cell ERα-E2 transcriptome.
Using Helicos single-molecule sequencing technology we generated between 17 and 26 million aligned reads per sample (Table 1). This sequencing depth is sufficient for detection of low-abundance genes. Additionally, some nonaligned sequences are likely unannotated RNA, as suggested by previous studies (23). The use of polyA RNA excludes non-polyA transcripts, and ribosomal-depleted RNA has been shown to provide a more cost-effective method for generating complete transcriptome coverage (24). However, as ERα is a regulator of RNA polymerase II, which generates polyA-tailed RNAs, we deemed analysis of polyA RNA as an appropriate approach. Although we selected for polyA transcript, some non-polyA RNAs were detected in our analysis. This can arise in a number of ways: many non-polyA RNAs have enough oligoA stretches in them to bind to oligo-dT beads and RNAs including small RNAs, tend to be accessible for binding other RNAs and piggy back through the enrichment process.
We found that the Helicos single-molecule sequencing technology generated highly concordant data between the replicates (Figure 1), and could identify differentially expressed genes with high precision (Figure 2). We discovered many novel estrogen-regulated low-abundant genes, including lncRNAs and pseudogenes, through the use of this technology. Our findings include a large set of E2-regulated protein-coding genes, unique to either cell line, as well as a set of common genes. The latter group of genes includes both known ERα-target genes, but also targets that have previously not been defined as estrogen regulated. However, although we could confirm many of the noted regulations using qPCR, this was not the case for all. Especially, antisense mRNAs were difficult to confirm using qPCR. We believe this might be due to technical issues, related to detecting difference in low abundance RNAs and sense/antisense transcription. For example, in cases where both strands of DNA are transcribed, the qPCR analysis would not be able to differentiate between the strands and will not correctly determine differential regulation of each, whereas single-molecule sequencing can. Also, because this sequencing method can detect genes that are be difficult to amplify with other sequencing protocols, it avoids such biases.
We found most regulated genes to be induced, rather than suppressed, by E2 (Figure 2D). This deviates from our previous studies, where we found significant repressive effects (4) and from the GRO-seq study by Hah et al which found a higher fraction of repressed genes (9). This is likely a result of the chosen time point (8 h), as repressed genes are commonly found in larger numbers at later time points (31), and the assay technology as Hah et al measured nascent transcripts, as opposed to processed ones (9). GRO-seq has, for example, the advantage of measuring only nascent RNAs. This is a different measurement, which does not identify mRNA at its steady-state levels but can more readily identify direct transcriptional targets. However, this technique generally employs an amplification-based sequencing technology and thus is subject to the biases endemic to amplification. The different analyses contribute to complementary aspects of the overall picture. Overall, however, we found overlap between the 2 technologies, with many transcripts being detected by both approaches.
We integrated public data on gene expression from tumor samples, revealing 102 putative novel protein-coding targets of ERα, a set derived from the set of commonly regulated genes in both cell lines that also were significantly correlated with the expression of ERα in patient samples (Figure 3). Additionally, from the group of common genes we found that 152 of these were significantly associated with the outcome of BC patients, suggesting potential roles relevant for the ERα-driven tumorigenesis.
Moreover, the analysis revealed massive estrogen-mediated regulation of lncRNAs (Figure 2). This was a surprising finding, as previous studies have found that estrogen regulation of another group of ncRNAs, miRNAs, is small or negligible (2). miRNAs were not analyzed here, as they lack polyadenylation and our analysis was focused on polyA RNA. We found that the proportion of expressed lncRNAs that were regulated by E2 was similar or higher than the proportion of protein-coding genes. This indicates that their regulation may be a critical aspect of ERα-mediated transcriptome regulation. Although the lncRNA HOTAIR has been reported to be E2 regulated, we could not confirm that finding in our experiments, neither by RNA-seq nor qPCR.
Because most lncRNAs regulated at this 8-hour time point and, similar to the protein-coding genes, have known ERα-binding site within 50 or 200 kb of their TSS (Figure 3), multiple lncRNAs are potential direct targets of ERα. We confirmed that 2 of these lncRNAs, LINC01016 and LINC00160, are significantly regulated within 30 minutes of estrogen treatment and that ERα binds their promoter/gene regions (Figure 4). We thereby demonstrate that lncRNAs are direct targets of ERα.
Similarly to the protein-coding genes, we found a number of the lncRNAs to be significantly correlated with levels of ERα in breast tumors, supporting the notion that they are regulated by ERα in vivo. We also identified a number of lncRNAs that in a stratified analysis could differentiate patients according to OS. Further studies need to be undertaken in order to validate the regulatory role of ERα for the expression of these lncRNAs, as well as assessing possible mechanisms underlying their association with patient outcome, because our analysis revealed several lncRNAs to correlate with difference in survival. For example, we found that patients presenting with higher expression of the 2 lncRNAs LINC01016 and LINC00160 in their breast tumors showed positive clinical outcomes (Figure 4D). Thus, our data show that these lncRNAs may predict survival. We speculate these lncRNAs may identify those that respond to endocrine therapy better than corresponding protein-coding genes do, such as the well-characterized ERα direct target pS2 (TFF1) or progesterone receptor, or ERα itself (Supplemental Figure 2, A–C). lncRNAs are suggested to show a higher specificity in tissue expression than protein-coding genes. Accordingly, we found that the overlap of regulated lncRNAs between the 2 different cell lines were higher than that of protein-coding genes. We believe it is possible that lncRNAs are more stably regulated by ERα in the breast compared with other targets and that lncRNAs may be better and more robust biomarkers for ERα activity than commonly used protein-coding genes. Ultimately, this can aid in the characterization of ERα regulation of ncRNAs, beyond protein-coding genes and miRNAs. Incidentally, during the revision phase of our study, the same group that published the GRO-seq analysis discussed above (9), performed an RNA-seq analysis exploring E2 regulation of lncRNAs in MCF-7 cells using Illumina HiSeq2000 technology. Similarly to us, these authors concluded that estrogen regulates hundreds of lncRNAs in MCF7 cells and that, upon silencing 2 selected ones, the proliferation of MCF-7 cells were reduced (42). Our study, in addition, explores the general estrogen regulation of lncRNAs by comparing 2 different ERα-positive BC cell lines, as well as correlates the regulation to clinical samples and survival. Our initial studies do demonstrate that silencing of the ERα-regulated LINC00160 significantly reduces the proliferative potential of BC cells and is indicative of survival. Thus, we propose that this and other estrogen-regulated lncRNAs have functional roles. Due to the potential wide-ranging regulatory ability of lncRNAs, these are of interest to further understand ERα's role in regular biology as well as in disease. Additional studies to explore the impact of estrogen-regulated lncRNAs on cancer-related behaviors, such as cell growth and survival, apoptosis, migration, and invasion, are needed.
In conclusion, Helicos single-molecule technology generated RNA-seq data that exhibited high correlation between replicates. The analysis detected massive estrogen-dependent lncRNA regulations in luminal A-type BC cells, and detected hundreds of novel protein-coding transcriptional targets. We find that lncRNAs can be direct targets of ERα and we show, for the first time, that estrogen-regulated lncRNAs can have predictive value as biomarkers for BC. We propose that regulation of lncRNAs contribute to the mechanism whereby ERα is tumorigenic in BC and that their expression levels can function as biomarkers and targets of therapeutic intervention in the luminal A subtype of BC.
Acknowledgments
We thank Dr Chin-Yo Lin (University of Houston) for valuable discussions relating to ERα and lncRNAs and Srijita Mukhopadhyay (University of Houston) for assistance with qPCR analysis.
Present address for P.J.: Department of Epidemiology and Biostatistics, and Center for Molecular Oncology, Memorial Sloan Kettering Cancer Center, New York, NY 10022.
Present address for T.R.: Molecular Biology, Bio-Rad Laboratories, Inc, Cambridge, MA 02139.
Present address for J.F.T.: Research and Development, Claritas Genomics, Cambridge, MA 02139.
This work was supported by the National Institutes of Health Grant R01CA172437, the Marie Curie Actions Grant FP7-PEOPLE-2011-COFUND (GROWTH 291795) via the VINNOVA program Mobility for Growth, and faculty start-up funds from the University of Houston (to C.W.); by The Texas Emerging Technology Fund Grant 300-9-1958 to the Center; and by the McNair Foundation (P.H.G.).
Disclosure Summary: J.F.T. and T.R. were formerly employed by Helicos Biosciences. All other authors have nothing to disclose.
Footnotes
- BC
- breast cancer
- BRCA
- breast carcinoma
- ChIP
- chromatin immunoprecipitation
- DE
- differential expression
- E2
- 17β-estradiol
- ER
- estrogen receptor
- GO
- gene ontology
- GRO-seq
- global run-on sequencing
- GSNAP
- Genomic Short-read Nucleotide Alignment Program
- HOTAIR
- HOX transcript antisense RNA
- LINC01016
- Long Intergenic Non-protein Coding RNA 1016
- lincRNA
- long intergenic RNA
- lncRNA
- long ncRNA
- miRNA
- microRNA
- MTS
- 3-(4,5-dimethylthiazol-2-yl)-5-(3-carboxymethoxyphenyl)-2-(4-sulfophenyl)-2H-tetrazolium) PES: phenazine ethosulfate
- ncRNA
- noncoding RNA
- NGS
- next-generation sequencing
- OS
- overall survival
- polyA
- polyadenylated
- qPCR
- quantitative real-time polymerase chain reaction PCR
- RNA-seq
- RNA sequencing
- RPM
- read per million
- siRNA
- small interfering RNA
- STAR
- Spliced Transcripts Alignment to a Reference
- TCGA
- The Cancer Genome Atlas
- UCSC
- Univeristy of California, Santa Cruz.
References
- 1. Williams C, Lin C-Y. Oestrogen receptors in breast cancer: basic mechanisms and clinical implications. Ecancermedicalscience. 2013;7:370. [DOI] [PMC free article] [PubMed] [Google Scholar]
- 2. Katchy A, Edvardsson K, Aydogdu E, Williams C. Estradiol-activated estrogen receptor α does not regulate mature microRNAs in T47D breast cancer cells. J Steroid Biochem Mol Biol. 2012;128:145–153. [DOI] [PubMed] [Google Scholar]
- 3. Katchy A, Pinto C, Jonsson P, et al. Coexposure to phytoestrogens and bisphenol A mimics estrogenic effects in an additive manner. Toxicol Sci. 2014;138(1):21–35. [DOI] [PMC free article] [PubMed] [Google Scholar]
- 4. Williams C, Edvardsson K, Lewandowski SA, Ström A, Gustafsson JA. A genome-wide study of the repressive effects of estrogen receptor β on estrogen receptor α signaling in breast cancer cells. Oncogene. 2008;27(7):1019–1032. [DOI] [PubMed] [Google Scholar]
- 5. Welboren WJ, van Driel MA, Janssen-Megens EM, et al. ChIP-Seq of ERα and RNA polymerase II defines genes differentially responding to ligands. EMBO J. 2009;28(10):1418–1428. [DOI] [PMC free article] [PubMed] [Google Scholar]
- 6. Carroll JS, Liu XS, Brodsky AS, et al. Chromosome-wide mapping of estrogen receptor binding reveals long-range regulation requiring the forkhead protein FoxA1. Cell. 2005;122(1):33–43. [DOI] [PubMed] [Google Scholar]
- 7. Lin C-Y, Vega VB, Thomsen JS, et al. Whole-genome cartography of estrogen receptor α binding sites. PLoS Genet. 2007;3(6):e87. [DOI] [PMC free article] [PubMed] [Google Scholar]
- 8. Yamaga R, Ikeda K, Horie-Inoue K, Ouchi Y, Suzuki Y, Inoue S. RNA sequencing of MCF-7 breast cancer cells identifies novel estrogen-responsive genes with functional estrogen receptor-binding sites in the vicinity of their transcription start sites. Horm Cancer. 2013;4:222–232. [DOI] [PMC free article] [PubMed] [Google Scholar]
- 9. Hah N, Danko CG, Core L, et al. A rapid, extensive, and transient transcriptional response to estrogen signaling in breast cancer cells. Cell. 2011;145(4):622–634. [DOI] [PMC free article] [PubMed] [Google Scholar]
- 10. Derrien T, Johnson R, Bussotti G, et al. The GENCODE v7 catalog of human long noncoding RNAs: analysis of their gene structure, evolution, and expression. Genome Res. 2012;22(9):1775–1789. [DOI] [PMC free article] [PubMed] [Google Scholar]
- 11. Bánfai B, Jia H, Khatun J, et al. Long noncoding RNAs are rarely translated in two human cell lines. Genome Res. 2012;22(9):1646–1657. [DOI] [PMC free article] [PubMed] [Google Scholar]
- 12. Cabili MN, Trapnell C, Goff L, et al. Integrative annotation of human large intergenic noncoding RNAs reveals global properties and specific subclasses. Genes Dev. 2011;25(18):1915–1927. [DOI] [PMC free article] [PubMed] [Google Scholar]
- 13. Mercer TR, Dinger ME, Mattick JS. Long non-coding RNAs: insights into functions. Nat Rev Genet. 2009;10:155–159. [DOI] [PubMed] [Google Scholar]
- 14. Ravasi T, Suzuki H, Pang KC, et al. Experimental validation of the regulated expression of large numbers of non-coding RNAs from the mouse genome. 2006;16(1):11–19. [DOI] [PMC free article] [PubMed] [Google Scholar]
- 15. Ørom UA, Derrien T, Beringer M, et al. Long noncoding RNAs with enhancer-like function in human cells. Cell. 2010;143:46–58. [DOI] [PMC free article] [PubMed] [Google Scholar]
- 16. Harrow J, Frankish A, Gonzalez JM, et al. GENCODE: the reference human genome annotation for The ENCODE Project. Genome Res. 2012;22:1760–1774. [DOI] [PMC free article] [PubMed] [Google Scholar]
- 17. Cheetham SW, Gruhl F, Mattick JS, Dinger ME. Long noncoding RNAs and the genetics of cancer. Br J Cancer. 2013;108:2419–2425. [DOI] [PMC free article] [PubMed] [Google Scholar]
- 18. Rossi S, Sevignani C, Nnadi SC, Siracusa LD, Calin GA. Cancer-associated genomic regions (CAGRs) and noncoding RNAs: bioinformatics and therapeutic implications. Mamm Genome. 2008;19(7–8):526–540. [DOI] [PubMed] [Google Scholar]
- 19. Sørensen KP, Thomassen M, Tan Q, et al. Long non-coding RNA HOTAIR is an independent prognostic marker of metastasis in estrogen receptor-positive primary breast cancer. Breast Cancer Res Treat. 2013;142(3):529–536. [DOI] [PubMed] [Google Scholar]
- 20. Bhan A, Hussain I, Ansari KI, Kasiri S, Bashyal A, Mandal SS. Antisense transcript long noncoding RNA (lncRNA) HOTAIR is transcriptionally induced by estradiol. J Mol Biol. 2013;425(19):3707–3722. [DOI] [PMC free article] [PubMed] [Google Scholar]
- 21. Gupta RA, Shah N, Wang KC, et al. Long non-coding RNA HOTAIR reprograms chromatin state to promote cancer metastasis. Nature. 2010;464(7291):1071–1076. [DOI] [PMC free article] [PubMed] [Google Scholar]
- 22. Mourtada-Maarabouni M, Pickard MR, Hedge VL, Farzaneh F, Williams GT. GAS5, a non-protein-coding RNA, controls apoptosis and is downregulated in breast cancer. Oncogene. 2009;28:195–208. [DOI] [PubMed] [Google Scholar]
- 23. Kapranov P, St Laurent G, Raz T, et al. The majority of total nuclear-encoded non-ribosomal RNA in a human cell is “dark matter” un-annotated RNA. BMC Biol. 2010;8:149. [DOI] [PMC free article] [PubMed] [Google Scholar]
- 24. Raz T, Kapranov P, Lipson D, Letovsky S, Milos PM, Thompson JF. Protocol dependence of sequencing-based gene expression measurements. PLoS One. 2011; 6(5):e19287. [DOI] [PMC free article] [PubMed] [Google Scholar]
- 25. Sam LT, Lipson D, Raz T, et al. A comparison of single molecule and amplification based sequencing of cancer transcriptomes. PLoS One. 2011;6(3):e17305. [DOI] [PMC free article] [PubMed] [Google Scholar]
- 26. Jonsson P, Katchy A, Williams C. Support of a bi-faceted role of estrogen receptor β (ERβ) in ERα-positive breast cancer cells. Endocr Relat Cancer. 2014;21(2):143–60. [DOI] [PMC free article] [PubMed] [Google Scholar]
- 27. Alvarez-Baron CP, Jonsson P, Thomas C, Dryer SE, Williams C. The two-pore domain potassium channel KCNK5: induction by estrogen receptor α and role in proliferation of breast cancer cells. Mol Endocrinol. 2011;25:1326–1336. [DOI] [PMC free article] [PubMed] [Google Scholar]
- 28. Pushkarev D, Neff NF, Quake SR. Single-molecule sequencing of an individual human genome. Nat Biotechnol. 2009;27:847–850. [DOI] [PMC free article] [PubMed] [Google Scholar]
- 29. Lipson D, Raz T, Kieu A, et al. Quantification of the yeast transcriptome by single-molecule sequencing. Nat Biotechnol. 2009;27:652–658. [DOI] [PubMed] [Google Scholar]
- 30. Robasky K, Lewis NE, Church GM. The role of replicates for error mitigation in next-generation sequencing. Nat Rev Genet. 2014;15:56–62. [DOI] [PMC free article] [PubMed] [Google Scholar]
- 31. Frasor J, Danes JM, Komm B, Chang KC, Lyttle CR, Katzenellenbogen BS. Profiling of estrogen up- and down-regulated gene expression in human breast cancer cells: insights into gene networks and pathways underlying estrogenic control of proliferation and cell phenotype. Endocrinology. 2003;144:4562–4574. [DOI] [PubMed] [Google Scholar]
- 32. Lewis JS, Meeke K, Osipo C, et al. Intrinsic mechanism of estradiol-induced apoptosis in breast cancer cells resistant to estrogen deprivation. J Natl Cancer Inst. 2005;97:1746–1759. [DOI] [PubMed] [Google Scholar]
- 33. Lewis-Wambi JS, Jordan VC. Estrogen regulation of apoptosis: how can one hormone stimulate and inhibit? Breast Cancer Res. 2009;11:206. [DOI] [PMC free article] [PubMed] [Google Scholar]
- 34. Cancer Genome Atlas Network. Comprehensive molecular portraits of human breast tumours. Nature. 2012;490(7418):61–70. [DOI] [PMC free article] [PubMed] [Google Scholar]
- 35. Vermeulen M, Eberl HC, Matarese F, et al. Quantitative interaction proteomics and genome-wide profiling of epigenetic histone marks and their readers. Cell. 2010;142:967–980. [DOI] [PubMed] [Google Scholar]
- 36. Tian Y, Rich BE, Vena N, et al. Detection of KIAA1549-BRAF fusion transcripts in formalin-fixed paraffin-embedded pediatric low-grade gliomas. J Mol Diagn. 2011;13:669–677. [DOI] [PMC free article] [PubMed] [Google Scholar]
- 37. Huang C, Jia Y, Yang S, et al. Characterization of ZNF23, a KRAB-containing protein that is downregulated in human cancers and inhibits cell cycle progression. Exp Cell Res. 2007;313:254–263. [DOI] [PubMed] [Google Scholar]
- 38. Lin C-Y, Ström A, Vega VB, et al. Discovery of estrogen receptor α target genes and response elements in breast tumor cells. Genome Biol. 2004;5:R66. [DOI] [PMC free article] [PubMed] [Google Scholar]
- 39. Joseph R, Orlov YL, Huss M, et al. Integrative model of genomic factors for determining binding site selection by estrogen receptor-α. Mol Syst Biol. 2010;6:456. [DOI] [PMC free article] [PubMed] [Google Scholar]
- 40. Hurtado A, Holmes KA, Ross-Innes CS, Schmidt D, Carroll JS. FOXA1 is a key determinant of estrogen receptor function and endocrine response. Nat Genet. 2011;43:27–33. [DOI] [PMC free article] [PubMed] [Google Scholar]
- 41. Williams C, Edvardsson K, Lewandowski SA, Ström A, Gustafsson JA. A genome-wide study of the repressive effects of estrogen receptor β on estrogen receptor α signaling in breast cancer cells. Oncogene. 2008;27:1019–1032. [DOI] [PubMed] [Google Scholar]
- 42. Sun M, Gadad SS, Kim DS, Kraus WL. Discovery, annotation, and functional analysis of long noncoding RNAs controlling cell-cycle gene expression and proliferation in breast cancer cells. Mol Cell. 2015;59(4):698–711. [DOI] [PMC free article] [PubMed] [Google Scholar]