

Abstract
Background and Aims
Survey-based studies often fail to take into account the predictive value of a test, in other words, the probability of a person having (or not having) the disease when scoring positive (or negative) on the given screening test.
Methods
We re-visited the theory and basic calculations of diagnostic accuracy.
Results
In general, the lower the prevalence the worse the predictive value is. When the disorder is relatively rare, a positive test finding is typically not useful in confirming its presence given the high proportion of false positive cases. For example, using the Compulsive Buying Scale (Faber & O’Guinn, 1992) three in four people classified as having compulsive buying disorder will in fact not have the disorder.
Conclusions
Screening tests are limited to serve as an early detection “gate” and only clinical (interview-based) studies are suitable to claim that a certain behaviour is truly “pathological”.
Keywords: behavioural addiction, severity, diagnosis, assessment, sensitivity, specificity, positive predictive value, negative predictive value, accuracy
Introduction
We welcome the initiative of Billieux, Schimmenti, Khazaal, Maurage and Heeren (2015) in which they question the clinical validity of certain behaviours that are considered addictions. Hereby, we would like to contribute to this discussion by pointing out an important although often ignored statistical phenomenon closely related to the overpathologising of everyday behaviours: the predictive value of screening tests.
Similar to the one carried out by Targhetta, Nalpas and Perney (2013) many studies struggle with the issue of separating “asymptomatic” and “symptomatic” (addicted or disordered) individuals performing a given behaviour. Although inventories are generally developed to provide a close estimate to a clinical test based on self-report, a screening instrument will never have diagnostic validity. But how precise can a screening instrument be compared to a clinical diagnosis?
Specificity, Sensitivity, Positive and Negative Predictive Value
Diagnostic accuracy, originally developed for the evaluation of laboratory screening instruments, is an indicator of the utility of a test (Glaros & Kline, 1988). It is measured by its agreement with a reference or “gold” standard that is the best available indicator of the presence or absence of the condition (Bossuyt et al., 2003). Accuracy is based on four concepts (see Table 1). Sensitivity and specificity provide information about the ability of the test to detect diseased and non-diseased persons correctly. For example, if sensitivity equals 80, it means that out of 100 diseased cases, the test will identify 80 as diseased. A specificity of 80, on the other hand, would mean that out of 100 non-diseased cases the test will identify 80 as negative and 20 as positive (diseased). Sensitivity and specificity are “fixed values” of the test (Streiner, 2003), which means that as long as the test is used in similar samples, these attributes remain the same. Positive and negative predictive value, on the other hand, provide information about the probability of a person having (or not having) the disease when scoring positive (or negative) on the screening test. A positive predictive value (PPV) of 80 means that out of 100 individuals scoring positive on the test, 80 are truly diseased, and 20 are not. A negative predictive value (NPV) of 80 would mean that 80 of 100 will be correctly classified as non-diseased, but 20 diseased individuals will score negative on the screening test. PPV and NPV are not “fixed values” but dependent on the prevalence of the disease in the sample where the screening test is administered (Streiner, 2003).
Table 1.
Calculation of accuracy
| Diseased | Non-diseased | ||
| Screened + | True positive (TP) | False positive (FP) | All positive (AP) |
| Screened − | False negative (FN) | True negative (TN) | All negative (AN) |
| All diseased (AD) | All non-diseased (AnD) |
Ideally, the number of true positive (truly diseased cases scoring positive on the screening test) and true negative cases (non-diseased cases scoring negative on the test) are both high and the number of false positive (cases that score positive although truly non-diseased) and false negative cases (who score negative although truly diseased) are both kept to minimum. This yields the best accuracy of the screening test. When the prevalence is kept constant, then sensitivity, specificity, PPV and NPV values are interdependent. In general, the lower the cut-off value on a given instrument, the higher the number of true positive cases, and the higher the number of false positive cases as well. This leads to higher sensitivity but lower specificity and PPV. Another general tendency is that when the prevalence is high then the proportion of false negatives may also be high, and when the prevalence of the disease is low then the proportion of false positives tends to be high (Streiner, 2003), which is generally the case with behavioural addictions. Thus, in order to calculate the probability of the disease given a positive test result one has to consider the a priori (antecedent) probability which is the prevalence rate (for the Bayesian approach of the calculations see: Meehl & Rosen, 1955).
Note: Sensitivity = TP/AD, Specificity = TN/AnD, Positive Predictive Value = TP/AP, Negative
Predictive Value = TN/AN, Accuracy (or Efficiency) = (TP + TN)/total
Examples
The question arises: given a positive test, what is the probability that the individual truly has the given disorder? A few examples are shown in Figure 1. Note that as the prevalence drops, so does the PPV (whereas the proportion of false positives increases).
Figure 1.
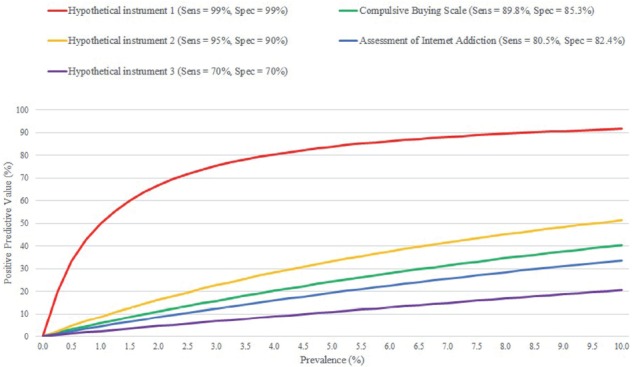
Positive Predictive Value of actual and hypothetical instruments depending on prevalence
Notes: Sens = sensitivity, Spec = specificity. Positive Predictive Value = the probability of a person having the disease when scoring positive on the screening test.
As it appears in Figure 1, even when specificity and sensitivity are both at 99%, given a prevalence of 1%, the individual has a 50% chance of not having the disease when the screening is positive. But screening instruments usually have much lower sensitivity and specificity values than 99%.
One of the most widely used tests to measure compulsive buying behaviour is the Compulsive Buying Scale (CBS) by Faber and O’Guinn (1992). Using a group of self-identified compulsive buyers as the criterion group, the authors reported a sensitivity of 89.8% and specificity of 85.3% for the CBS. According to a recent meta-analysis (Maraz, Griffiths & Demetrovics, 2015) the pooled prevalence of compulsive buying is 4.9%. This means that out of those scoring negative, 99% are probably non-diseased, but of those that score positive for compulsive buying, only 24% would probably be truly diseased. Although the test is unlikely to miss a pathological case, three in four people classified as having compulsive buying disorder will in fact not have the disorder.
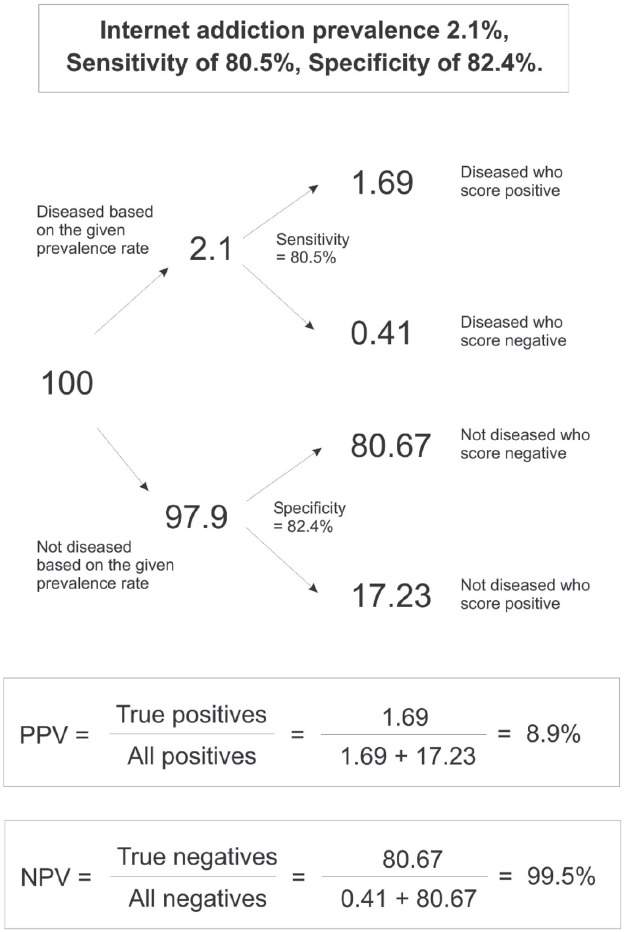
Other instruments have an even lower predictive value. For example, one of the few clinically validated Internet addiction measures is the Scale for the Assessment of Internet (and Computer Game) Addiction by Müller, Beutel and Wölfling (2014). This instrument was validated on a sample of 221 treatment seeking, clinically diagnosed problematic Internet users for which the authors reported a test sensitivity of 80.5% and a specificity of 82.4%. Using the same instrument, the authors conducted a population-based survey and reported a prevalence rate of 2.1% for Internet addiction (Müller, Glaesmer, Brähler, Woelfling & Beutel, 2014). Based on this prevalence rate, NPV is nearly perfect (99%), however, PPV is only 8.9% (for the exact calculations see the Appendix). This means that out of those scoring positive on the test, only 8.9% has the correct classification. Thus out of a 100 individuals screened positive for Internet addiction, only 9 will truly have the disease, and 91 will be misclassified.
Further Challenges
A critical point in the test accuracy is the criteria or “gold standard” that the inventory is assessed against. Technically, if the individual scores positive on the compulsive buying scale, then he or she has 24% chance of being a self-identified compulsive buyer, because this was the “gold standard” against which specificity and sensitivity were tested. Thus it is paramount to test inventories against clinical criteria to provide a sensible estimate of the extent of the given behavioural addiction.
Establishing an “external criteria” for addiction is another challenge. Unlike substance-related disorders, complete abstinence is often impossible and indicators of pathology are difficult to define. This is especially the case with the “innovative yet absurd addictive disorders” – as Billieux et al. (2015) state – such as tango addiction (Targhetta et al., 2013), tanning addiction (Kourosh, Harrington & Adinoff, 2010), study addiction (Atroszko, Andreassen, Griffiths & Pallesen, 2015) or “research addiction” from Billieux et al. (2015). From a statistical point of view, an instrument that has not been tested against a clinically valid (diagnosed) group is unsuitable to assess the disorder.
Conclusions and Future Recommendations
The accuracy model was initially developed for medical purposes where (1) there is usually a clear criteria of what constitutes problematic and (2) the cost of misclassification is relatively low. Classifying 100 individuals as “positive” and referring them to further tests is more reasonable than missing one person who might suffer from serious consequences if the early signs of the disease are missed. But is the same logic true for behavioural “addicts”? Even if the cost of missing a case is the same, the cost of misdiagnosing is certainly higher compared to medical conditions given the scaremongering of the media that often exaggerates the impact of high prevalence estimates by presenting certain behaviours – such as using the Internet – as inherently dangerous. As a consequence, the moral panic may create unnecessary conflicts in families.
Low PPVs contribute to overpathologising everyday behaviours because the proportion of truly diseased people is much lower than the proportion of those scoring positive on a screening test. When the disorder is relatively rare, a positive test finding is typically not useful in confirming its presence given the high proportion of false positive cases. When the prevalence is low, a test is best used to rule out a condition but not to rule it in (Streiner, 2003).
At the same time the low predictive value of a test does not imply that behavioural addictions are non-existing or that they are not pathological. It only means that the use of surveys and screening tests is limited to serve as an early detection “gate”. One must always keep in mind that only clinical (interview-based) studies are suitable to claim that a certain behaviour for a given individual is truly “pathological”.
Authors’ contribution
AM designed, AM and OK wrote the manuscript and DZ revised the text. Each author has read and agrees with the information contained in the current article.
Conflict of interest
ZD is the Editor-in-Chief of the Journal of Behavioral Addictions and AM is Associate Editor of the Journal of Behavioral Addictions. OK has no conflict of interest to report.
Funding Statement
This work was supported by the Hungarian Scientific Research Fund (grant numbers: K83884 and K111938). Zsolt Demetrovics acknowledges financial support of the János Bolyai Research Fellowship awarded by the Hungarian Academy of Sciences.
Appendix
The calculation of positive and negative predictive value on the example of the Scale for the Assessment of Internet and Computer game Addiction.
References
- Atroszko P. A., Andreassen C. S., Griffiths M. D, & Pallesen S. (2015). Study addiction - A new area of psychological study: Conceptualization, assessment, and preliminary empirical findings. Journal of Behavioral Addictions, 4(2), 75–84. [DOI] [PMC free article] [PubMed] [Google Scholar]
- Billieux J., Schimmenti A., Khazaal Y, Maurage P, & Heeren A. (2015). Are we overpathologizing everyday life? A tenable blueprint for behavioral addiction research. Journal of Behavioral Addictionss, 4, 119–123. [DOI] [PMC free article] [PubMed] [Google Scholar]
- Bossuyt P. M., Reitsma J. B., Bruns D. E, Gatsonis C. A., Glasziou P. P., Irwig L. M., Lijmer J. G., Moher D., Rennie D. & de Vet H. C. (2003). Towards complete and accurate reporting of studies of diagnostic accuracy: The STARD initiative. Clinical Chemistry and Laboratory Medicine, 41(1), 68–73. [DOI] [PubMed] [Google Scholar]
- Faber R. J, & O’Guinn T. C. (1992). A clinical screener for compulsive buying. Journal of Consumer Research, 19, 459–469. [Google Scholar]
- Glaros A. G. & Kline R. B. (1988). Understanding the accuracy of tests with cutting scores: The sensitivity, specificity, and predictive value model. Journal of Clinical Psychology, 44(6), 1013–1023. [DOI] [PubMed] [Google Scholar]
- Kourosh A. S., Harrington C. R. & Adinoff B. (2010). Tanning as a behavioral addiction. The American Journal of Drug and Alcohol Abuse, 36(5), 284–290. [DOI] [PubMed] [Google Scholar]
- Maraz A., Griffiths M. D. & Demetrovics Z. (2015). The prevalence of compulsive buying: A systematic review and metaanalysis. Manuscript submitted for publication. [Google Scholar]
- Meehl P. E. & Rosen A. (1955). Antecedent probability and the efficiency of psychometric signs, patterns, or cutting scores. Psychological Bulletin, 52(3), 194. [DOI] [PubMed] [Google Scholar]
- Müller K. W., Beutel M. E. & Wölfling K. (2014). A contribution to the clinical characterization of Internet Addiction in a sample of treatment seekers: Validity of assessment, severity of psychopathology and type of co-morbidity. Comprehensive Psychiatry, 55(4), 770–777. [DOI] [PubMed] [Google Scholar]
- Müller K. W., Glaesmer H., Brähler E., Woelfling K. & Beutel M. E. (2014). Prevalence of Internet addiction in the general population: Results from a German population-based survey. Behaviour & Information Technology, 33(7), 757–766. [Google Scholar]
- Streiner D. L. (2003). Diagnosing tests: Using and misusing diagnostic and screening tests. Journal of Personality Assessment, 81(3), 209–219. [DOI] [PubMed] [Google Scholar]
- Targhetta R., Nalpas B. & Perney P (2013). Argentine tango: Another behavioral addiction? Journal of Behavioral Addictions, 2(3), 179–186. [DOI] [PMC free article] [PubMed] [Google Scholar]