

Abstract
Purpose
Nanovesicles composed of the phospholipid dioleylphosphatidylserine (DOPS) and a fusogenic protein, saposin C (SapC), selectively target and induce apoptotic cell death in a variety of human cancer cells in vitro and in vivo. We tested whether such tumor-homing nanovesicles are capable of delivering fluorescent probes and magnetic resonance (MR) contrast agents to cancerous tissue to aid in earlier detection and improve visualization.
Procedures
SapC–DOPS nanovesicles labeled with either a far-red fluorescent probe (CellVue® Maroon, CVM) or conjugated with a dextran coated MR contrast agent, ultrasmall superparamagnetic iron oxide (USPIO), were systemically administrated into xenografts for tumor detection using optical and MR imaging systems.
Results
SapC–DOPS nanovesicles were effectively detected in vivo in tumor-bearing animals using both optical and MR imaging techniques, thereby demonstrating the cancer-selective properties of these nanovesicles.
Conclusions
SapC–DOPS nanovesicles offer promise as a new and robust theranostic agent for broad cancer-selective detection, visualization, and potential therapy.
Keywords: Saposin C–dioleylphosphatidylserine nanovesicles, USPIO, Fluorescence, Cancer-selective detection
Introduction
Emergence of whole-body optical imaging technologies has offered a practical new method for monitoring neoplastic growth in living animals [1]. In vivo imaging technologies are increasingly being used to study tumors that would otherwise remain hidden. For example, tumor cells engineered to express green- or red-fluorescent proteins are implanted in nude mice, and the growth and metastasis of tumors can be followed by tracking fluorescence using a live-animal photon detection device equipped with a sensitive charge-coupled device (CCD) camera. Engineering such models requires significant cell manipulation including gene transfer, which can alter the biology of the cells, and many currently used tumor models do not express detectable markers. In addition, imaging in genetically engineered mice predisposed to develop various cancers can be challenging. A method to utilize fluorescence imaging technologies would thus be highly useful for monitoring tumor growth in these models.
A significant hurdle in tumor imaging appears to be the lack of tumor-specific labeling reagents that can selectively bind and label the cells of the tumor mass to enable quantitative high-resolution imaging. Additional desirable features of the next generation of in vivo imaging agents include rapid clearance (better signal to noise), efficient tumor targeting, low toxicity, and a fluorophore emission spectrum that is minimally susceptible to scattering, and attenuation by overlying tissues. In addition, the manufacturing process should be robust and inexpensive [2].
Our interest in developing saposin C–dioleylphosphatidylserine (SapC–DOPS) nanovesicles as antitumor agents arose from empirical observations that these proteolipid vesicles have a high affinity for phosphatidylserine (PS)-rich membranes. Because many tumors and cells of tumor vasculature have been found to have aberrantly exposed PS-rich domains on the cell surface [3–6], we tested whether the nanovesicles could target tumor cells.
Both the protein and lipid components of nanovesicles occur naturally in animal cells. Saposin C (SapC) is a small and stable lysosomal protein (Fig. 1) whose physiological role is to activate glucocerebrosidase, the enzyme that catalyzes the breakdown of sphingolipids [7]. Mutations in either protein lead to symptoms of Gaucher's disease [8]. The lipid component of the nanovesicles is DOPS, a phospholipid found in cell membranes.
Fig. 1.
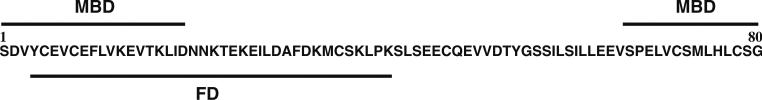
Functional organization of Saposin C: human Saposin C (SapC) is an 80-aa hydrophobic protein required for the activation of the enzyme glucocerebrosidase. SapC binds to membranes via two membrane-binding domains (MBD), while the fusogenic domain (FD, highlighted) is necessary for membrane fusion. SapC has an N-glycosylation site (NKT), six cysteines, and an enzyme activation domain (QEVV...SIL).
We discovered the unusual delivery and tumor-targeting properties of SapC–DOPS nanovesicles while studying saposin protein structure and function. First, we reported that SapC has especially strong affinity for unsaturated phospholipids [9] and requires phospholipids for optimal activity [10]. Second, in vitro assays showed that when purified SapC is mixed with the DOPS and gently sonicated at lysosomal (acidic) pH, the two components readily assemble into nanovesicles [11].
The unparalleled resolution and diversity of tissue contrast mechanisms, in addition to potential clinical translatability, provides motivation for attempting to use magnetic resonance imaging (MRI) to track these nanovesicles in vivo. In recent years, molecular and cellular imaging using targeted contrast-enhanced MRI has gained prominence in the detection and monitoring of cancerous tissue. Several therapies for cancer also employ targeted delivery of drugs to the tissue of interest. Targeted therapies enable the use of lower doses of the drug, thus reducing the possibility of side effects in healthy tissue. One approach to delivering drugs to the tissue of interest is by using liposomes. The drug is either encapsulated or attached to the liposome and injected into the vasculature for delivery to the target. Delivery of the liposomes to the tumor in vivo is enabled by the enhanced permeability and retention (EPR) phenomenon [12] due to fenestrations in tumor neovasculature and poor lymphatic drainage. Evaluation of targeted drug therapies using MRI, by co-delivering the targeted drug and the contrast agent, could potentially provide quantitative information about the delivery, uptake, and effect on the site of pathology.
First introduced for hepatic and lymph node imaging through uptake by phagocytic cells [13], ultrasmall superparamagnetic iron oxide (USPIO) contrast agents have become increasingly popular for visualizing other types of cells using MR microimaging, both in vitro and in vivo through a variety of application specific targeting methods [14]. Superparamagnetic iron oxide contrast particles have been favored in many studies for molecular and cellular imaging using MRI mainly because of the ability of small quantities of iron oxide contrast particles to significantly affect the MR signal. A review of several such studies was carried out by Bulte and Kraitchman [14]. Most approaches to labeling cells with iron oxide contrast agents involve the use of a transfection agent like poly-l-lysine or lipofectamine to label the cells in vitro. In order to selectively label cells in vivo with contrast agents, the contrast agent can be encapsulated within a liposomal delivery vector [15] or attached to monoclonal antibodies via one of several techniques including periodate oxidation/borohydride-reduction to form Schiff bonds [16], gluteraldehyde crosslinking [17], the biotin streptavidin system [18], and amine-sulfhydryl group linkage [19].
In order to use MRI to evaluate the targeting and delivery of the SapC–DOPS complex to tumor cells, we have developed a method to couple ferumoxtran-10 with the SapC–DOPS complex based on the approach used by Bogdanov et al. [20]. In this paper, we describe the formulation of the SapC–DOPS nanovesicles containing USPIO in detail. For convenience, we refer to the SapC–DOPS–USPIO as SapC–DOPS–IO. We then evaluate the uptake of these particles in tumor cells in vitro, and also demonstrate the delivery in vivo of the complex in a mouse tumor xenograft model, paving the way for further in vivo evaluation. We hypothesize that the T2 relaxation time in tumors will selectively decrease in response to the uptake of the USPIO contrast after injection of SapC–DOPS–IO.
Materials and Methods
Preparation of SapC–DOPS Nanovesicles
Bath sonication was used to form SapC–DOPS nanovesicles as previously described [11, 21]. A small aliquot (20 μL) of pH 4.7 citric-phosphate buffer was added to the dry SapC and DOPS (Avanti Polar Lipids, Alabaster, AL) or DOPS alone followed by addition of 1 mL phosphate-buffer solution (PBS). The mixture was sonicated for 20 min at~4°C to form SapC–DOPS nanovesicles. The sonicated samples were stored at 4°C for 2 days [11], and were characterized by freeze-fracture electron microscopy.
Preparation of SapC–DOPS Nanovesicles Coupled with Iron Oxide Contrast
In order to efficiently encapsulate USPIO (ferumoxtran-10; Advanced Magnetics, Lexicon, MA; size ~20 nm) in nanovesicles, a chemical binding method described by Bogdanov et al. [20] was adapted. Briefly, the dextran coating on the USPIO particles was oxidized to generate aldehyde groups. Typically, 1 mL of USPIO solution in PBS (20 mg Fe/mL) was oxidized using 10–15 mg sodium periodate for 30 min at pH 6.0. The reaction was stopped by addition of ethylene glycol (10 mM). The USPIO solution was then purified using a PD10 column as follows. The PD10 column was first equilibrated with PBS by passing 5 volumes of PBS and then the column was centrifuged at 1,000g. The eluate fraction was discarded and the solution containing oxidized USPIO particles and ethylene glycol was pipetted drop by drop to the center of the column. The column was again centrifuged at 1,000g, and the eluate containing 99% USPIO solution free of periodate and ethylene glycol was obtained.
The surface aldehydes form covalent Schiff bonds at high pH with amines of lipids such as DOPS. After drying the lipid (1 mM) by evaporation of organic phase using slow flowing N2 gas, 0.2 mg of dry SapC was added, along with 20 μL of citric-phosphate buffer at pH 4.7 and 200 μL of oxidized USPIO solution at pH 6. The mixture was vortexed, followed by addition of 300 μL of sodium borate at pH 9. The mixture was vortexed again and then mixed with 2 mL of diethyl ether. Sonication for about 15 min, followed by removal of diethyl ether through flow of N2 gas resulted in the formation of reverse evaporation vesicles. The vesicles were sized by passing through a 200-nm polycarbonate membrane using the Liposofast extruder (Avestin Inc., Ottawa, Canada). To remove the USPIO particles attached to the outer surface of the vesicles, the solution was further dialyzed against a low pH 4.5 solution of sodium chloride (0.15 mM) and sodium citrate (0.15 mM) for several h. Finally, the unencapsulated USPIO was removed by passing the solution through a Con-A Sepharose 4B column (Amersham Biosciences Corp., Piscataway, NJ) The nanovesicle solution was stabilized by adding 1 mM HEPES buffered to pH 8 (20 mM final concentration). The vesicle size distribution was determined by dynamic light scattering experiments (Coulter N4 particle sizer) and electron microscopy. Inductively coupled plasma-atomic emission spectroscopy (ICP-AES) was used to determine the concentration of iron in the vesicles.
Cell Cultures
Human neuroblastoma cells (CHLA-20) were a gift from Thomas Inge (Cincinnati Children's Hospital Medical Center, Cincinnati, OH) and Robert Seeger (Children's Hospital of Los Angeles, Los Angeles, CA) [11], and were grown in complete medium consisting of Iscove's modified Dulbecco's medium (IMDM; Bio Whittaker, Walkersville, MD) supplemented with 3 mMl-glutamine (Gemini Bioproducts, Inc., Calabasas, CA), insulin and transferrin (5 μg/mL each), and 5 ng/mL of selenous acid (ITS Culture Supplement, Bio Whittaker, Walkersville, MD), and 20% fetal bovine serum (FBS) at 37°C in a humidified 5% CO2 atmosphere. Human pancreatic cancer (MiaPaCa-2, American Type Culture Collection, Manassas, VA) and murine rhabodomyosarcoma (MR366, a gift from Glenn Merlino, National Cancer Institute, Bethesda, MD) cells were grown in Dulbecco's modified Eagle's medium (DMEM) with 10% FBS. Cells were subcultured by detaching with trypsin from culture plates. These cells were used for both in vitro and implantation in mice for in vivo studies. No cross-contamination was found in these cells and xenografted tumors.
Preparation and Labeling of Cells
Samples of neuroblastoma cells were prepared with approximately 500,000 cells per group in 1 mL IMDM growth medium. SapC–DOPS–IO nanovesicles were added to the samples at final concentration of 18 μg Fe/mL. Growth medium containing free USPIO and DOPS–USPIO vesicles were used as controls, in addition to cells not exposed to any contrast agent or vesicles. Cells were collected at various time points (24, 18, and 12 h), washed, trypsinized, and fixed in 1% agarose for imaging. A majority of cells exposed to SapC–DOPS–IO were killed and detached from the plate. These cells were also collected, washed, and fixed in agarose. Washing of the cells removes all USPIO external to the cells. Only USPIO that have been transported into the cell is retained by this process. Therefore, image intensity changes in the in vitro cell images can be directly attributed to intracellular iron taken up by the cell through endocytosis.
In another experiment, neuroblastoma cells (5×10⁵ per well) were incubated with various concentrations of SapC–DOPS–IO for 12 h. 60, 80, 100, and 120 μL of SapC–DOPS–IO solution was added to cells (5×10⁵ per well) in 1 mL growth medium resulting in a final iron concentration 5.1, 6.6, 8.1, and 9.6 μg, respectively. The cells, including those that were detached from the plate were collected, washed, and fixed in 1% agarose. All experiments were conducted in triplicate to confirm measurements.
Magnetic Resonance Imaging
High-resolution MRI of the cells was performed using a 7 T Bruker Biospec scanner (Bruker BioSpin MRI GmbH, Ettlingen, Germany) equipped with the B-GA12 actively shielded 12 cm gradient subsystem delivering up to 400 mT/m. Relaxometry and imaging experiments were performed using a 38-mm birdcage resonator.
Imaging
Gradient echo methods optimized for T2* weighting were used to visualize cells loaded with SapC–DOPS–IO. A 3D FLASH imaging sequence with TR/TE/θ of 200 ms/35 ms/10° and 320×320×64 matrix was used for a 3.2×3.2×0.64 cm field of view (FOV) resulting in an isotropic 100 μm resolution.
Relaxometry
Spin echo and gradient echo images were acquired with varying TE (spin echo: TE=15–50 ms, TR=4,000 ms; gradient echo: TE=5–25 ms, TR=1,000 ms). The natural logarithm of the signal intensity of the images of cells fixed in agarose in each vial was determined over a 3D slab and plotted against TE. The negative slope of the best fit line determined by linear regression for each set of points is the corresponding relaxation rate (R2 or R2*).
Inductively Coupled Plasma-Atomic Emission Spectroscopy
ICP-AES was used to quantify the concentration of iron in SapC–DOPS–IO and in cells loaded with SapC–DOPS–IO. An Agilent 7500 ce (Agilent Technologies, Tokyo, Japan) ICPMS equipped with shielded torch and collision/reaction cell technology was used after calibration of the instrument with a stock solution. Cell samples (0.5 mL) were placed in septum sealed glass tubes and treated with 0.5 mL of concentrated HNO3 resulting in a 50% v/v acid concentration. The resulting solutions were digested in a water bath at 80°C for 2 h. Digested samples were then diluted to 5.0 mL with DII water containing 250 μg/l Yttrium internal standard. The washed cells contain only iron internalized in the cells as exogenous iron is removed. Samples were then analyzed for total Fe with the Agilent 7500ce ICP-MS.
Freeze-Fracture Electron Microscopy
For freeze-fracture electron microscopy, all samples were quenched using the sandwich technique and liquid nitrogen-cooled propane [22]. Using this technique, a cooling rate of 10,000 K/s is reached avoiding ice crystal formation and artifacts possibly caused by the cryofixation process. The cryofixed samples were stored in liquid nitrogen for less than 2 h before processing. The fracturing process was carried out in JEOL JED-9000 freeze-etching equipment and the exposed fracture planes were shadowed with platinum for 30 s in an angle of 25–35° and with carbon for 35 s (2 kV/60–70 mA, 1×10⁻⁵ Torr). The replicas produced this way were cleaned with concentrated, fuming HNO3 for 24 h, followed by repeating agitation with fresh chloroform/methanol (1:1 by vol.) at least five times. The replicas were then examined at a JEOL 100 CX electron microscope.
Xenograft and Allograft Tumor Models
For in vivo optical and MR imaging with fluorescently labeled or USPIO-conjugated SapC–DOPS nanovesicles, xenografts and allografts were implanted in the mice. Human pancreatic (MiaPaCa-2), human neuroblastoma (CHLA-20), and murine rhabdomyosarcoma (MR366) cells (MR366 5×10⁶) were injecting subcutaneously into female nude or FVB/N mice (2–5 months old, n=5). These tumors were established in 4–6 weeks before imaging. Control animals were injected with PBS (n=5). The growth rate of tumors was determined by caliper measurements and the tumors were approximately 50 to 400 mm3 when imaging was performed as described [11].
Tumor Targeting of the CVM-Labeled SapC-DOPS Nanovesicles Using In Vivo Optical Imaging
An aliquot of CellVue® Maroon (CVM, PTI Research Inc., Exton, PA) in ethanol was mixed with phospholipid solvent for bath sonication preparation by the procedure as previously described [11]. CVM-labeled SapC–DOPS nanovesicle had an excitation maximum at 653 nm and an emission maximum at 677 nm [11]. CVM-labeled SapC–DOPS nanovesicles were separated from free CVM dye using a Sephadex™ G25 column (PD-10, Amersham Pharmacia Biotech, Piscataway, NJ). CVM-labeled SapC–DOPS or CVM-labeled DOPS alone were administrated by tail vein injection into mice bearing subcutaneous pancreatic, neuroblastoma xenografts, and rhabdomyosarcoma allograft. Real-time images were taken using an IVIS 200 Series imaging system with an XFO-6 fluorescent kit (Xenogen, Alameda, CA).
Magnetic Resonance Imaging
High-resolution MRI of the tumor was performed in vivo on mice at 7 T using a 78-mm birdcage quadrature volume coil for transmit and surface coil placed on the tumor for receiving the MR signal. The surface coil was actively decoupled from the receiver and detuned using a PIN diode circuit during transmit pulses to the volume coil. T2* weighted 3D FLASH sequence (TE/TR=5 ms/20 ms, flip angle=10°, 16 averages) were used with a 320×320×64 matrix and 3.2×3.2×0.64 cm FOV resulting in an isotropic 100 μm resolution. The imaging time for the 2D and 3D scans was approximately 5 and 50 min, respectively. SapC–DOPS–IO solution was administered intravenously via a tail vein injection after acquiring reference images prior to injection. Image acquisition was repeated 3 and 24 h after injection of 400 μL SapC–DOPS–IO solution containing 36 μg iron. The mouse was euthanized after imaging, i.e., approximately 24 h after injection, and the tumor was collected for ex vivo analysis using ICP.
For imaging experiments in pancreatic tumor-bearing mice (n=5), a T2 mapping protocol was used to measure the change in tumor T2 values before and 4 h after intravenous injection of the SapC–DOPS–IO solution. A multiple echo–spin–echo sequence available in Bruker Paravision® 4.0 was modified with the following parameters: TE=10–160 ms (16 echoes), TR=2,000 ms, resolution 256×192 pixels (200 μm×200 μm×1 mm resolution). Due to different rates of tumor progression and availability of mice, the mice were imaged on different days. The control experiments included injection of a mixture of free USPIO solution and a DOPS–USPIO solution with no SapC. Each animal also served as its own control, by imaging the animal prior to any injection. The animals were imaged a few hours after injection using the imaging protocols described in the previous section. Imaging was performed at 3–4 h after injection to allow for clearance of nanovesicles from the blood. Five animals were used for the initial part of the experiment comparing tumor T2 values at the above mentioned time points. Animal protocols were approved by the Institutional Animal Care and Use Committee.
Image Postprocessing and Analysis
Raw data acquired from the MR scanner was processed using Bruker software Paravision® 4.0. Further analysis of MR images was performed using in-house image processing software written in IDL® (Interactive Data Language). From the T2 map generated by fitting the data to a three-parameter exponential function, the mean tumor T2 was derived by manual segmentation of the ROI.
Results
SapC–DOPS Nanovesicles
Freeze-fracture electron micrographs of the SapC–DOPS nanovesicles show overall spherical vesicles (Fig. 2a). The shadows are visible in front as well as behind their structures and therefore these vesicles represent bilayer vesicles. This was further confirmed by electron microscopy showing nanovesicles containing iron oxide particles (Fig. 2b). Dynamic light scattering (Coulter N4+, Beckman Coulter, CA) was used to determine the vesicle size distribution (Fig. 2c, d). A comparison of the profile of particle sizes obtained from dynamic light scattering indicates that nanovesicles (diameter ~200±27 nm) efficiently encapsulate the USPIO particles (diameter ~30±10 nm).
Fig. 2.

Electron micrograph and size distribution of SapC–DOPS and SapC–DOPS–IO nanovesicles. a Freeze-fracture electron micrograph of SapC–DOPS nanovesicles. The bars represent 100 nm, and the shadow direction is running from bottom to top. b Transmission electron microscope images of vesicles loaded with USPIO contrast particles. c and d N4 plus particle size analysis. Sample containing free USPIO particles and vesicles (c). The two peaks indicate the relative numbers of USPIO and vesicles on an arbitrary scale and the location of the peaks represent the mean diameter of USPIO and vesicles. d Sample passed through a Con-A Sepharose column and passed through Liposofast® Extruder. Free USPIO is eliminated and a monodisperse nanovesicle solution is obtained. Mean vesicle diameter is approximately 230 nm.
The relaxivity (r2) of the SapC–DOPS–IO solution was calculated by plotting the relaxation rate (R2) values of serial dilutions of the vesicle solution. From the slope of the line, the r2 value was determined to be 101.21±4.9 mM−1s−1. DOPS vesicles containing SapC (1 mol SapC/30 mol DOPS) were found to encapsulate approximately 5-fold higher number of UPSIO particles than DOPS vesicles not containing SapC, as determined by ICP. The mean iron concentration in SapC-DOPS-IO was 94.8±12.8 vs. 36.33±4.5 μg/mL in vesicles not containing SapC.
In Vitro Experiments
Previously published results indicate that fluorescently labeled SapC–DOPS nanovesicles labeled human cancer cells by internalization into cells [11]. To confirm cell-labeling ability of USPIO conjugated SapC–DOPS nanovesicles, we incubate human neuroblastoma cells (CHLA-20) with SapC–DOPS–IO nanovesicles for 24 h, and then collected the cells for MRI. A T2* weighted 3D FLASH imaging sequence was used to image the vials containing cells fixed in agarose. Figure 3a shows MR images of USPIO laden neuroblastoma cells (dark spots) fixed in a uniform agarose background. An increasing number of signal voids are observed in cells incubated with the SapC–DOPS–IO solution for longer periods. For reference, images of fixed cells that were exposed only to free USPIO in the growth medium and cells that were incubated in growth medium without any contrast are included.
Fig. 3.

MRI of SapC–DOPS–IO in human neuroblastoma (CHLA-20) cells. a MR images of cells fixed in agarose. T2* weighted 3D-FLASH imaging on 7 T Bruker (TE=30 ms/TR=50 ms/FA=10°/16 averages, 100 μm isotropic resolution). b R2 relaxation rates of labeled cells fixed in agarose. c (R2*) relaxation rates of labeled cells fixed in agarose. d (R2 and R2*) values of the vials correlated with the actual iron concentrations obtained from ICP-AES measurements of identical samples. Note: Error bars along the x-axis are of the order of 0.001 μg and therefore not visible at this scale.
All USPIO exogenous to the cells was removed during the washing and fixation process, so the signal change in Fig. 3a can be attributed to cellular uptake of USPIO. MR relaxometry performed on the vials of cells fixed in agarose provides a method of quantifying the iron content in the cells. For example, the R2 and R2* relaxation rates of cells in agarose were 14.64 and 26.74 s−1, respectively, for cells exposed to SapC–DOPS–IO for 24 h vs. the control cells, which had R2 and R2* relaxation rates of 7.84 and 11.04 s−1, respectively (Fig. 3b and c). Figure 3d shows the correlation of these relaxation rates with the actual iron content in cells measured using ICP-AES in identical samples. Relaxation rates and ICP measurements are also tabulated in Table 1. From ICP-AES measurements of the absolute iron concentration in cell samples, the average iron uptake per cell was also estimated. The average iron content in cells was about 3, 2.12, and 1.48 pg/cell for cells incubated with SapC–DOPS–IO for 24, 18, and 12 h, respectively.
Table 1.
Relaxation rates (R2 and R2*) of USPIO-loaded cells fixed in 1% agarose, compared with concentration of iron determined by ICP-AES
| Sample | R2 (s−1)±SEM | R2*(s−1)±SEM | ICP-AES (μg/2.5×105 cells) |
|---|---|---|---|
| Control cells | 7.8±0.33 | 11.0±1.05 | 0 |
| USPIO 24 h | 7.8±0.35 | 14±1.63 | 0.1 |
| SapC-DOPS-IO 12 h | 10.4±0.35 | 15.6±1.2 | 0.37 |
| SapC-DOPS-IO 18 h | 12.9±0.38 | 17.3±1.6 | 0.53 |
| SapC-DOPS-IO 24 h | 14.6±0.34 | 26.7±1.71 | 0.75 |
When the cells were exposed to the varying concentrations of vesicles for the same period, the uptake was found to be proportional the initial concentration in the growth medium, as expected. Cells exposed to lower concentration of SapC–DOPS–IO showed less uptake as compared to cells exposed to higher concentrations of SapC–DOPS–IO, as determined by measurements of R2 and R2* relaxation rates of the cells fixed in agarose. Spin echo and gradient echo image samples are shown in Fig. 4a, and the relaxation rates are plotted in Fig. 4b for each of the four vials.
Fig. 4.

Uptake analysis of SapC–DOPS–IO by MRI in human neuroblastoma (CHLA-20) cells. a Image strip showing spin echo (top row) and gradient echo (bottom row) images of vials containing iron oxide loaded cells fixed in agarose. Vials in columns 1, 2, 3, and 4 contain cells that were incubated with 5.1, 6.6, 8.1, and 9.6 μg of Fe, respectively, for 12 h. b Plot of R2 and R2* relaxation rates of cells fixed in agarose plotted against initial iron concentration in growth medium. The mean values and standard deviation over three samples are shown.
Tumor Targeting of Fluorescently Labeled SapC–DOPS Nanovesicles for Optical Imaging
In vivo optical imaging of fluorescently labeled SapC–DOPS (CVM-SapC–DOPS) was conducted in mice bearing human pancreas and neuroblastoma xenografts, and murine rhabdomyosarcoma allograft using real-time fluorescence imaging. First, we evaluated the biodistribution time course of CVM-labeled SapC–DOPS complexes via tail vein injection using xenograft pancreatic (MaiPaCa-2) tumors (Fig. 5a). At 2 h post-administration, CVM-labeled SapC–DOPS nanovesicles significantly internalized into human pancreatic tumor in animals (Fig. 5a, mice 1 and 2). Some signals were detected at nontumor tissues (likely liver) in tumor and nontumor-bearing mice (Fig. 5a, mice 1–3). At the time points from 2 to 24 h, fluorescent signals of CVM-SapC–DOPS were significantly increased in tumor sites, and decreased in nontumor tissues. Tumor-homing fluorescence remained for at least 100 h.
Fig. 5.

Tumor-selective imaging of fluorescent labeled SapC–DOPS nanovesicles in animals. a Biodistribution of intravenously administered CVM-labeled SapC–DOPS to mice bearing pancreatic xenografts indicates tumor-targeting potential. Athymic nude mice bearing pancreatic xenografts (circled 1 and 2) and a nontumor-bearing animal (3) were treated with coupled CVM-labeled SapC–DOPS nanovesicles. Imaging time points were 0, 2, 5, 24, 52, and 100 h after injection. b Fluorescence and photo mages of neuroblastoma xenografts treated with (from left to right): coupled CVM-labeled SapC–DOPS (circled 1), SapC and CVM-labeled DOPS (circled 2), and CVM-labeled DOPS alone (circled 3). c Fluorescence and photo images of CVM-labeled SapC–DOPS in murine rhabdomyosarcoma (MR366) allografts. Fluorescence filters: Ex=640 nm, Em=700 nm. SapC=4.2 mg/kg, DOPS=2 mg/kg, CVM=6 μmol. Images were acquired 24 h after injection.
Next, we determined that SapC played a critical role in tumor-selective targeting using human neuroblastoma xenograft. CVM-SapC–DOPS, uncoupled SapC and CVM-labeled DOPS vesicles, and CVM-labeled DOPS alone were intravenously injected into mouse 1, 2, and 3, respectively (Fig. 5b). By 24 h after injection, animal receiving CVM-SapC–DOPS complexes (mouse 1) showed a fluorescent signal in tumor tissue while those receiving uncoupled SapC and CMV-labeled DOPS (mouse 2) or CVM-labeled DOPS alone (mouse 3) showed no accumulation of fluorescence signal. Furthermore, tumor-selective optical imaging with fluorescently labeled SapC-DOPS nanovesicles was confirmed using a rhabdomyosarcoma allograft (Fig. 5c). These results indicate that SapC-DOPS nanovesicles accumulate preferentially in tumor tissues and that SapC is essential for its tumor-selective targeting properties.
In Vivo MR Imaging
Quantitative measurements of uptake of SapC–DOPS–IO solution in vivo in nude mice bearing a neuroblastoma tumor on the right flank were made using MRI and ICP-AES methods (Fig. 6). Images of tumor imaged before, immediately after, 3 h, and 24 h after injection of SapC–DOPS–IO are shown (Fig. 6a). A visual comparison of the signal intensity in the tumor in the T2* weighted scans at these time points shows a drop in signal intensity over the entire tumor volume. Quantitatively, the signal intensity was measured over the entire tumor volume from the 3D, T2* weighted scan in a manually drawn ROI containing the tumor. The mean signal intensity over the 3D tumor volume, normalized against a region of interest in the muscle tissue selected just below the tumor is shown. It can be seen that the MR signal intensity drops within the tumor ROI immediately after injection, and gradually decreases further before rebounding slightly 24 h later (Fig. 6b). This could indicate some washout or metabolism of the dextran iron particles. ICP analysis of the same tumor indicates that approximately 5-fold concentration of iron was found in the tumor compared to the tumor of a control mouse.
Fig. 6.

In vivo MR imaging of SapC–DOPS–IO in mice with xenografts. a–c Human neuroblastoma (CHLA-20) tumors. a Image strip shows T2* weighted FLASH image of tumor before and after injection of contrast agent (TE=5 ms/TR=20 ms/FA=10°), 16 averages; resolution: 100 μm isotropic. b Normalized tumor signal intensity (dimensionless) is plotted at the time points of image acquisition, obtained over a 3D slab. The tumor signal intensity is normalized against an ROI chosen just below the tumor tissue at each time point. c ICP-AES data representing iron concentration in excised tumor of mouse treated with SapC shows nearly 5-fold iron concentration when compared with the iron in an untreated mouse. d Human pancreatic (MiaPaCa-2) tumor. Representative T2 map of tumor was imaged before and after injections (4 h) of SapC–DOPS–IO. An average change in T2 of approximately 29 ms was seen, from 91.4±11.6 to 62.8±8.6 ms in a manually drawn ROI of approximately the same slice of tumor (n=5).
Results of MRI experiments in mice with the pancreatic tumor xenografts (n=5) showed similar uptake as reflected in the changes in T2 values of the tumor (Fig. 6d). T2 values measured before injection of SapC–DOPS–IO was 91.4±11.6 ms. Approximately 4 h after injection, an average drop of 29 ms was seen, with average post-injection T2=62.8±8.6 ms in a manually drawn ROI of approximately the same slice of tumor. In control mice, injected with free USPIO and DOPS–USPIO not containing SapC, there was very little change in tumor SI before and 4 h after injection. This result verifies the hypothesis that the mean of the post-treatment tumor T2 values would be lower than the mean tumor T2 prior to injection reflecting uptake of the contrast in the tumor. A one-tail paired t-test of the mean tumor T2 values obtained (n=5) showed the difference to be significant (p=0.011).
Discussion
SapC and DOPS form a proteolipid complex which has a selective cytotoxic effect on cancerous cells. SapC plays a major role in this cytotoxicity via the ceramide- and caspase-mediated apoptotic pathway as described [11]. Developing MRI labels to detect the delivery of targeted nanoparticles in vivo is challenging for several reasons: The imaging contrast agent should be bound to or encapsulated within the nanoparticles, the targeted nanoparticles should avoid uptake by macrophages and nontargeted tissue, and the nanoparticles should accumulate in sufficiently high quantities to enable detection using high-resolution MRI. Finally, the contrast label should not inhibit the binding and uptake of the targeted nanoparticle in the desired target tissue.
We have developed an MR technique to detect the delivery of the protein SapC to tumor cells in vitro and in vivo. SapC, delivered to tumor cells using DOPS vesicles as a carrier, has also been shown to induce phospholipid membrane fusion at low pH [10]. This property enables the binding of SapC–DOPS vesicles to tumor cells, which express PS on the outer surface of the cell membrane. Once bound, the SapC–DOPS nanovesicles may enter the cell by transcytosis.
In order to further investigate the effect of the protein SapC in in vivo models, we have used contrast-enhanced MRI techniques in addition to other biological assays including fluorescence methods. By tagging these vesicles with USPIO particles, we have developed a method for monitoring the delivery and uptake of the SapC–DOPS–IO vesicles in both in vitro and in vivo experiments. Having established the basic technique for preparing vesicles, we conducted MR experiments to show that cells that have taken up sufficient quantities of iron oxide contrast by in vitro incubation become MR visible on high-resolution T2*-weighted 3D scans. Control experiments with USPIO-tagged DOPS nanovesicles without SapC showed lower uptake, demonstrating that SapC is a key component of the nanovesicles that enhances uptake into cells. The quantity of iron encapsulated by incubation ranged between 1 and 3 pg/cell. While iron concentrations of 10–20 pg/cell have been achieved in vitro [23] using transfection agents, a concentration of about 1–3 pg of iron/cell is sufficient for MR detection [24].
Experiments using SapC–DOPS–IO vesicles injected into in vivo mouse tumor models showed accumulation of iron oxide in the tumor as detected by MR. The change in signal intensity of the tumor was attributed to the accumulation of SapC–DOPS–IO, and was confirmed by ICP-AES. T2 mapping of tumors indicated a significant change in tumor T2 before and 4 h after injection of SapC–DOPS–IO. However, there was some variability in the T2 values between animals. In some cases, a drop in T2 exceeding 30 ms was observed, and in other cases, the change was much smaller (less than 2 ms). This could be attributed to several factors including tumor size, the nature of the tumor (homogenous tissue vs. heterogeneous tissue), the degree of permeability of the neovasculature (more leaky vs. less leaky), and variation from one animal to the next. A larger study with more animals and different tumor models would be required to unravel the dependence of these factors on uptake of SapC–DOPS–IO.
We also observed that fluorescent signal in the CVM-SapC–DOPS treated mice was temporarily distributed in liver at earlier imaging time points (2–5 h) after intravenous administration (Fig. 5a, mice 1 and 2) but the later imaging time points (24–100 h) show accumulation of the fluorescent nanovesicle only in the tumor. In control experiments, fluorescently labeled DOPS alone was mainly visualized in liver tissues (Fig. 5a, mouse 3). These observations suggest that fluorescently labeled SapC–DOPS nanovesicles preferentially target and accumulate in tumors. The partial and temporal signal in liver may reflect vesicles taken up and cleared by the reticuloendothelial system due to their lipophilicity.
We have demonstrated that SapC–DOPS nanovesicles have a tumor-selective targeting ability that can be utilized for cancer detection using optical and MR imaging. Incorporation of a fluorescent probe in the SapC–DOPS complex provided evidence for the selectivity of the complex for tumor tissue in animal models. Although optical imaging is highly sensitive, there is limited utility of optical imaging techniques in humans due to limited signal detection of fluorescence probes in deep tissues. In contrast, MRI provides a noninvasive, high-resolution imaging method that is widely used in the clinic. Labeling of SapC–DOPS with an iron oxide based contrast agent was motivated by the potential translatability of the techniques to human patient trials.
Conclusions
In summary, we have developed fluorescently or USPIO labeled nanovesicles that target tumor tissues, and have demonstrated their sensitivity as markers for fluorescence or MR detection, respectively, both in vitro and in vivo in mouse models. The MR technique allows quantitative measurements useful for time course studies of uptake and clearance of the drug in specific tissues. Validation of tumor uptake of SapC–DOPS–IO nanovesicles using fluorescence methods provides confidence that the MRI measurements reflect intracellular concentrations of the agent. These initial studies pave the way for longitudinal imaging studies using MR techniques in order to quantify the delivery, uptake, and effect of SapC on tumor tissue.
Acknowledgments
This work was funded in part by CancerFree Kids as well as Translational Research Initiative and Validation Research Grants from Cincinnati Children's Medical Center.
Footnotes
Conflict of Interest. Xiaoyang Qi, PhD is listed as an inventor on the patent for the technology (SapC–DOPS) that is the subject of this research. Consistent with current Cincinnati Children's Hospital Medical Center policies, the development and commercialization of this technology has been licensed to Bexion Pharmaceuticals, LLC, in which Dr. Qi, holds a minor (<5%) equity interest.
References
- 1.Hoffman RM, Yang M. Subcellular imaging in the live mouse. Nature Protoc. 2006;1:775–782. doi: 10.1038/nprot.2006.109. [DOI] [PubMed] [Google Scholar]
- 2.Marx V. Molecular imaging: companies set out to sharpen the in vivo perspective with new machines and novel contrast agents. Chem Eng News. 2005;83:25–34. [Google Scholar]
- 3.Fernandes RS, Kirszberg C, Rumjanek VM, et al. On the molecular mechanisms for the highly procoagulant pattern of C6 glioma cells. J Thromb Haemost. 2006;4:1546–52. doi: 10.1111/j.1538-7836.2006.01985.x. [DOI] [PubMed] [Google Scholar]
- 4.Ran S, Downes A, Thorpe PE. Increased exposure of anionic phospholipids on the surface of tumor blood vessels. Cancer Res. 2002;62:6132–40. [PubMed] [Google Scholar]
- 5.Ran S, Thorpe PE. Phosphatidylserine is a marker of tumor vasculature and a potential target for cancer imaging and therapy. Int J Radiat Oncol Biol Phys. 2002;54:1479–84. doi: 10.1016/s0360-3016(02)03928-7. [DOI] [PubMed] [Google Scholar]
- 6.Utsugi T, Schroit AJ, Connor J, et al. Elevated expression of phosphatidylserine in the outer membrane leaflet of human tumor cells and recognition by activated human blood monocytes. Cancer Res. 1991;51:3062–6. [PubMed] [Google Scholar]
- 7.Qi X, Chu Z. Fusogenic domain and lysines in saposin C. Arch Biochem Biophys. 2004;424:210–8. doi: 10.1016/j.abb.2004.02.023. [DOI] [PubMed] [Google Scholar]
- 8.Sandhoff K, Kolter T, Harzer K. Sphingolipid activator proteins. In: Scriver CR, Beaudet AL, Sly WS, Valle D, editors. The metabolic and molecular bases of inherited disease. 8th edn. McGraw-Hill; New York: 2000. pp. 3371–3388. [Google Scholar]
- 9.Nieh MP, Pencer J, Katsaras J, et al. Spontaneously forming ellipsoidal phospholipid unilamellar vesicles and their interactions with helical domains of saposin C. Langmuir. 2006;22:11028–33. doi: 10.1021/la062275j. [DOI] [PubMed] [Google Scholar]
- 10.Wang Y, Grabowski GA, Qi X. Phospholipid vesicle fusion induced by saposin C. Arch Biochem Biophys. 2003;415:43–53. doi: 10.1016/s0003-9861(03)00219-4. [DOI] [PubMed] [Google Scholar]
- 11.Qi X, Chu Z, Mahller YY, et al. Cancer-selective targeting and cytotoxicity by liposomal-coupled lysosomal saposin C protein. Clin Cancer Res. 2009;15:5840–5851. doi: 10.1158/1078-0432.CCR-08-3285. [DOI] [PubMed] [Google Scholar]
- 12.Sachdeva MS. Drug targeting systems for cancer chemotherapy. Expert Opin Investig Drugs. 1998;7:1849–64. doi: 10.1517/13543784.7.11.1849. [DOI] [PubMed] [Google Scholar]
- 13.Stark DD, Weissleder R, Elizondo G, et al. Superparamagnetic iron oxide: clinical application as a contrast agent for MR imaging of the liver. Radiology. 1998;168:297–301. doi: 10.1148/radiology.168.2.3393649. [DOI] [PubMed] [Google Scholar]
- 14.Bulte JW, Kraitchman DL. Iron oxide MR contrast agents for molecular and cellular imaging. NMR Biomed. 2004;17:484–499. doi: 10.1002/nbm.924. [DOI] [PubMed] [Google Scholar]
- 15.Mulder WJ, Strijkers GJ, van Tilborg GA, et al. Lipid-based nanoparticles for contrast-enhanced MRI and molecular imaging. NMR Biomed. 2006;19:142–164. doi: 10.1002/nbm.1011. [DOI] [PubMed] [Google Scholar]
- 16.Dutton AH, Tokuyasu KT, Singer SJ. Iron-dextran antibody conjugates: general method for simultaneous staining of two components in high-resolution immunoelectron microscopy. Proc Natl Acad Sci USA. 1979;76:3392–3396. doi: 10.1073/pnas.76.7.3392. [DOI] [PMC free article] [PubMed] [Google Scholar]
- 17.Renshaw PF, Owen CS, Evans AE, et al. Immunospecific NMR contrast agents. Magn Reson Imaging. 1986;4:351–357. doi: 10.1016/0730-725x(86)91045-3. [DOI] [PubMed] [Google Scholar]
- 18.Bulte JW, Hoekstra Y, Kamman RL, et al. Specific MR imaging of human lymphocytes by monoclonal antibody-guided dextran-magnetite particles. Magn Reson Med. 1992;25:148–157. doi: 10.1002/mrm.1910250115. [DOI] [PubMed] [Google Scholar]
- 19.Tiefenauer LX, Tschirky A, Kuhne G, et al. In vivo evaluation of magnetite nanoparticles for use as a tumor contrast agent in MRI. Magn Reson Imaging. 1996;14:391–402. doi: 10.1016/0730-725x(95)02106-4. [DOI] [PubMed] [Google Scholar]
- 20.Bogdanov AA, Jr, Martin C, Weissleder R, et al. Trapping of dextran-coated colloids in liposomes by transient binding to amino-phospholipid: preparation of ferrosomes. Biochim Biophys Acta. 1994;1193:212–218. doi: 10.1016/0005-2736(94)90350-6. [DOI] [PubMed] [Google Scholar]
- 21.Chu Z, Sun Y, Kuan CY, et al. Saposin C: neuronal effect and CNS delivery by liposomes. Ann NY Acad Sci. 2005;1053:237–246. doi: 10.1196/annals.1344.021. [DOI] [PubMed] [Google Scholar]
- 22.Sternberg B. Freeze-fracture electron microscopy of liposomes. In: Gregoriadis G, editor. Liposome Technology. Vol. 1. CRC Press; Boca Raton: 1993. pp. 363–374. [Google Scholar]
- 23.Frank JA, Zywicke H, Jordan EK, et al. Magnetic intracellular labeling of mammalian cells by combining (FDA-approved) superparamagnetic iron oxide MR contrast agents and commonly used transfection agents. Acad Radiol. 2002;9(Suppl 2):S484–S487. doi: 10.1016/s1076-6332(03)80271-4. [DOI] [PubMed] [Google Scholar]
- 24.Shapiro EM, Skrtic S, Sharer K, et al. MRI detection of single particles for cellular imaging. Proc Natl Acad Sci USA. 2004;101:10901–10906. doi: 10.1073/pnas.0403918101. [DOI] [PMC free article] [PubMed] [Google Scholar]