

Abstract
Histone post-translational modifications have been recently intensely studied owing to their role in regulating gene expression. Here, we describe protocols for the characterization of histone modifications in both qualitative and semiquantitative manners using chemical derivatization and tandem mass spectrometry. In these procedures, extracted histones are first derivatized using propionic anhydride to neutralize charge and block lysine residues, and are subsequently digested using trypsin, which, under these conditions, cleaves only the arginine residues. The generated peptides can be easily analyzed using online LC-electrospray ionization-tandem mass spectrometry to identify the modification site. In addition, a stable isotope-labeling step can be included to modify carboxylic acid groups allowing for relative quantification of histone modifications. This methodology has the advantage of producing a small number of predicted peptides from highly modified proteins. The protocol should take approximately 15–19 h to complete, including all chemical reactions, enzymatic digestion and mass spectrometry experiments.
INTRODUCTION
Histones are highly basic, small proteins that organize eukaryotic DNA into nucleosomes, the building blocks of chromatin. Besides promoting the formation of the chromatin fiber, a large body of work substantiates that histones are intimately involved in gene regulation1,2. Chromatin-mediated gene regulation is accomplished by post-translational modifications (PTMs) of histones. These PTMs are mostly concentrated on the N-terminal tails that extend beyond the surface of the nucleosome. Prevalent histone PTMs include serine and threonine phosphorylation, arginine methylation (mono- and dimethylation) and lysine acetylation and methylation (mono-, di- and trimethylation). Intriguingly, certain modifications and modification sites have been linked to either gene activation or silencing. Methylation at lysine 9 of histone H3 is known to be located on heterochromatin regions leading to gene repression, whereas methylation of the same histone at lysine 4 is found on actively transcribed genes2. Owing to the excessive amounts of modifications of histones and their observed links to modulating gene expression, theories such as the histone code hypothesis3 have evolved to explain how these modifications can affect cellular events.
Traditionally, histone modifications have been discovered and monitored using methods such as site-specific antibodies or 32P-labeling followed by protein sequencing by Edman degradation. However, these techniques are time consuming and have certain limitations that do not enable complete characterization of the myriad of modifications present on histones. Mass spectrometry (MS) has complemented the biological work being conducted on histone PTMs, categorizing novel modifications on histones that were previously not detected by any other means4–8. Histone proteins pose a formidable challenge to the mass spectrometrist, as their sequences are decorated with an overwhelming number of arginine and lysine residues, especially on the N-termini where most PTMs are known to reside. This causes problems as the most commonly used enzymes usually cleave on either basic or acidic residues. Enzymatic digestion with trypsin results in small peptides that are difficult to retain on RP-HPLC columns and analyzed by MS. On the other hand, proteolysis with enzymes that cleave after acidic residues (e.g., Glu-C) generates larger multiply charged peptides whose MS/MS spectra are difficult if not impossible to interpret. MS-related histone work has benefited from the use of limited trypsin or other enzyme digestion4–6; however, these methods typically generate several truncated peptides containing the same modification sites, rendering quantification of histone PTMs cumbersome. More recently, the Arg-C digestion of histones has been performed to produce histone peptides that can be used for relative quantification purposes8. Nevertheless, we decided to develop a method that could produce uniform peptides using the robust enzyme trypsin.
This method involves the chemical derivatization of histones followed by trypsin digestion resulting in highly reproducible proteolysis fragments that can be quite easily monitored in the mass spectrometer and also allow for a comparative analysis of histone modifications from two distinct cellular conditions9. Our methodology involves derivatizing free amine groups on the N-termini and ε-amino group of unmodified or endogenously monomethylated lysines with propionic anhydride to form propionyl amides before a trypsin cleavage is used. Similar methods using organic acids have also been described, even for in-gel digestion of proteins10–12. Propionic anhydride derivatization has two practical purposes:
As all lysine residues will be blocked by the added chemical group or by endogenous modifications, trypsin digestion results in proteolysis only C-terminal to arginine residues mimicking an Arg-C digestion as shown in Figure 1 for histone H3, but with the efficiency and reproducibility of trypsin.
The derivatization step neutralizes the charge at the N-termini, and unmodified and monomethylated lysine residues. This makes the resulting histone peptides less hydrophilic. They can now be easily resolved by standard RP-HPLC; in addition, the peptides produce doubly and triply charged ions in electrospray ionization MS, and so are pseudo-tryptic-like fragments whose MS/MS spectra are facile to interpret (Fig. 2). This is an advantage over using the Arg-C protease, which will cleave at Arg residues, but not remove charge from lysine residues.
Figure 1.
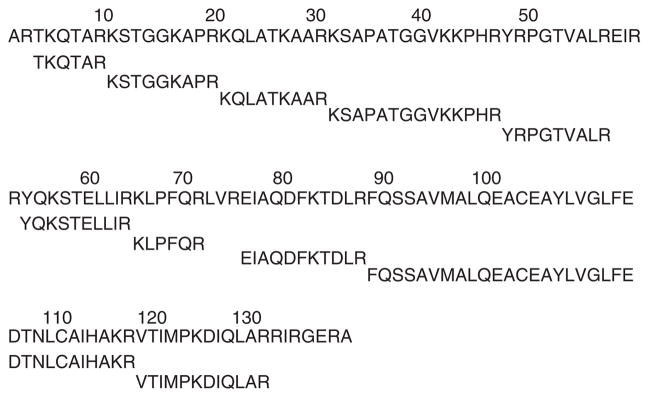
Peptides generated from the trypsin digestion of propionylated histone H3.2. As all lysine residues are blocked by endogenous modifications or chemically by conversion to propionyl amides, cleavage occurs only C-terminal to arginine residues (similar results can be obtained on other histones).
Figure 2.

MS/MS spectrum of the [M+2H]2+ precursor ion from the digest of propionylated histone H3.2 taken on an LTQ-FT mass spectrometer. This peptide was determined to span residues 18–26 and was found to contain an acetylation (ac) modification on K23. Note propionyl amide groups (pr) on the unmodified K18 residue and also on the N-terminus. b and y type ions are labeled. Inset: mass spectrum of the precursor parent ion differentiates this peptide as being acetylated (+1.23 p.p.m.) and not trimethylated (−30.66 p.p.m.), as the experimental mass of the peptide is consistent with an acetylation mark.
As we can now reproducibly generate a set of peptides from one sample to the next regardless of the histone modification status, we can implement a second derivatization step using stable isotope labeling of carboxylic acids for relative quantification and comparison of histone modifications from two separate sources or cellular conditions. The described protocols have been applied for the successful identification and quantification of histone PTMs in cells from various organisms and under various external stimuli13–17, but can clearly be extended to histones extracted from any cellular source.
A typical experimental design for the comparative analysis (i.e., relative quantification) of histone H3 PTMs from two cellular sources is as follows. Histones are acid-extracted from the two different cell samples and purified by HPLC separation into fractions containing distinct family members. The fractions from each sample containing histone H3 are evaporated to dryness and then after reconstitution in a small volume of water are treated with propionic anhydride to block lysine residues. A trypsin digestion is then performed on both samples and another propionic anhydride reaction is performed to modify the newly generated N-termini. Small portions of the two samples are then separately analyzed in the mass spectrometer to determine how much sample (based on total ion current for several peptides) is present from each source. The remaining samples are then treated with methanolic HCl to incorporate a stable isotope label onto the carboxylic acid groups. One sample is treated with “light” methanolic HCl, whereas the other sample is treated with “heavy” methanolic HCl. Roughly equal amounts of sample are mixed (equal amounts judged by previous MS analysis of each sample) and analyzed by MS for a relative comparison of histone PTMs from each cellular state. Typically, these experiments can give information regarding the under- or overexpression of histone PTMs from two different biological conditions. Unmodified histone peptides can serve as controls to determine if equal amounts of each sample were loaded, as their relative abundances should be approximately equal. It is recommended that three replicate runs be performed.
MATERIALS
REAGENTS
Deionized water
Ammonium hydroxide
Propionic anhydride (Sigma-Aldrich)
D0-Methanol 99% (Alltech) ▲ CRITICAL When not in use, D0-methanol should be stored under argon or nitrogen to reduce moisture in the bottles.
D4-Methanol >99% (Sigma-Aldrich) ▲ CRITICAL When not in use, D4-methanol should be stored under argon or nitrogen to reduce moisture in the bottles.
Sequencing-grade modified trypsin (Promega)
Ammonium bicarbonate (100 mM, pH 8)
Glacial acetic acid
Acetyl chloride (Sigma-Aldrich) ▲ CRITICAL When not in use, acetyl chloride should be stored under argon or nitrogen to reduce moisture in the bottles.
MS sample buffer: 0.1% acetic acid
HPLC grade water (Millipore)
HPLC grade acetonitrile (Mallinckrodt)
HPLC buffer A = 0.1% acetic acid
HPLC buffer B = 70% acetonitrile in 0.1% acetic acid
EQUIPMENT
Vortex mixer
Mini-centrifuge
pH indicator strips
Heat blocks or water baths (51 and 37 °C)
SpeedVac concentrator
Small glass vials
Mini-magnetic stirbar (<2 mm to fit in glass vials)
Microcapillary columns for nanoflow HPLC: C18 resin (5–20 μm, YMC ODS-AQ, Waters), 360 μm o.d. × 75 μm i.d. polyimide coating (Polymicro Technologies)
HPLC instrument configured for nanoflow delivery of solvent
High-resolution mass spectrometer (such as a Thermo Finnigan LTQ-FT or LTQ-Orbitrap mass spectrometers) ▲ CRITICAL A high-resolution, high mass accuracy mass spectrometer is needed to differentiate acetylation versus trimethylation (Δm = 0.036 Da).
REAGENT SETUP
Sample requirements
These procedures are best when applied to HPLC-fractionated histone samples obtained from an acid extraction preparation, which would contain mostly histones. Typically, our procedures can be applied to as little as 1 μg of protein, and three replicates should be performed when performing comparative analysis of histone PTMs from two distinct cellular states. At least two runs must be performed on each sample if quantitative information is desired (normal C18 screen and a quantitative analysis after stable isotope labeling); so be sure to save enough sample for two MS experiments.
EQUIPMENT SETUP
RP-HPLC instrument and mass spectrometer
Use the following reverse-phase HPLC gradient with running buffer A and elution buffer B.
| Time interval (min) | Gradient |
|---|---|
| 0–60 | 0–60% B |
| 60–70 | 60–100% B |
| 70–75 | 100% B |
| 75–80 | 100–0% B |
Optimum sensitivity is achieved using nanoflow rates of 100 nl min−1 or lower. The high-resolution, high mass accuracy mass spectrometer should be operated in positive mode using a data-dependent MS/MS mode setting as described previously (see refs. 13–17).
A high mass accuracy instrument is needed to differentiate between acetylated and trimethylated peptides (Δm = 0.036 Da).
A mass spectrometer capable of MS/MS experiments is also highly recommended for localization of modification sites, as the use of peptide mass fingerprinting (obtaining peptide mass only) can be confusing with multiply modified peptides and chemical derivatizations that are all multiples of 14 Da (methyl group).
PROCEDURE
Chemical derivatization of histone proteins with propionic anhydride
-
1|
Reconstitute in deionized water the RP-HPLC-purified histone sample that had been completely dried (we usually try to keep the concentration around 0.5–1 μg μl−1).
-
2|
Aliqout out between 1 and 5 μg of histone sample and dilute with 5 μl of 100 mM ammonium bicarbonate buffer (pH 8).
-
3|
Add 1–2 μl of concentrated ammonium hydroxide to the sample.
! CAUTION Ammonium hydroxide should be handled and dispensed in a fume hood.
▲ CRITICAL STEP Steps 3–7 must be performed in a streamlined manner without any interruptions or breaks for maximum reaction efficiency.
-
4|
Prepare propionylation reagent by adding 75 μl of propionic anhydride to 25 μl of D0-methanol 99%, mix with vortexer and spin down in a mini-centrifuge for several seconds.
▲ CRITICAL STEP Propionylation reagent should be made freshly for each reaction.
! CAUTION When not in use, propionic anhydride and D0-methanol 99% should be stored under argon or nitrogen and sealed with parafilm to reduce moisture in the bottles.
-
5|
Immediately add 20 μl of propionylation reaction to histone sample, vortex, spin down in a mini-centrifuge for a few seconds and check pH with pH indicator strips (add <0.5 μl to strip). If pH is <8, add ammonium hydroxide dropwise until pH is approximately 8. Typically, adding 5 μl of ammonium hydroxide is a good starting point for the titration.
! CAUTION Ammonium hydroxide should be handled and dispensed in a fume hood.
▲ CRITICAL STEP The drop in pH is due to the hydrolysis of propionic anhydride releasing propionic acid. Propionic anhydride, while labeling amino groups, is also hydrolyzed by water molecules. The optimal pH of the reaction is 8. Step 5 should be performed as quickly as possible to avoid reduction in labeling efficiency. Care should be exercised in titrating the ammonium hydroxide. If the pH is >10, labeling of other residues with higher pKa is possible.
?TROUBLESHOOTING
-
6|
Incubate the reaction at 51 °C for 20 min.
-
7|
Dry sample down to approximately 5 μl in a SpeedVac concentrator at room temperature (25 °C) for about 20 min.
-
8|
Dilute sample with 5 μl of 100 mM ammonium bicarbonate buffer (pH 8).
-
9|
Repeat Steps 3–7.
▲ CRITICAL STEP Usually, performing the propionylation reaction twice ensures maximum conversion (>95%) of amino groups to propionyl amides.
■ PAUSE POINT Propionylated histone protein samples can be stored for several weeks at −80 °C.
Enzymatic digestion of propionylated histones and propionylation of newly generated N-termini
-
10|
Dilute sample with 50 μl of 100 mM ammonium bicarbonate buffer solution.
-
11|
Add trypsin to the sample to make a 20:1 (wt/wt) protein:trypsin ratio. Incubate at 37 °C for 6–10 h.
-
12|
Quench trypsin digestion by adding glacial acetic acid. We typically add 1 μl of glacial acetic acid for every 15 μl of sample buffer volume, but make sure pH has dropped to about 3. Place quenched sample in −80 °C freezer until frozen (to inactivate the trypsin).
-
13|
Dry sample down to approximately 5 μl in a SpeedVac concentrator.
-
14|
Repeat Steps 3–7. We react the sample again with propionic anhydride to convert the newly trypsin-generated N-termini on peptides to propionyl amides.
-
15|
Dilute sample with 5 μl of 100 mM ammonium bicarbonate buffer (pH 8).
-
16|
Repeat Steps 3–7. For comparative analysis of histone PTMs from two cellular states, go to Step 23. For quantitative analysis using stable isotope labeling, go to Step 17.
▲ CRITICAL STEP Usually, performing the propionylation reaction twice ensures maximum conversion (>95%) of amino groups to propionyl amides.
■ PAUSE POINT Digested histone samples can be stored for several weeks at −80 °C.
Stable isotope labeling of carboxylic acid groups for quantitative MS of histones from two cellular states
-
17|
Bring two histone samples from different cellular states to dryness using a SpeedVac concentrator.
▲ CRITICAL STEP Samples must be completely dry, as water in the sample leads to by-products and inefficient labeling. Owing to many rounds of drying to completeness, the stable isotope labeling procedures described below must be performed using at least 1 μg of histone peptide sample.
-
18|
Add 10 μl of D0-methanol 99% to the sample to be labeled with light methanol and 10 μl of D4-methanol >99% to the sample to be labeled with heavy methanol, vortex and dry completely again using a SpeedVac concentrator. This step helps to remove any last trace amounts of water in the samples before stable isotope labeling reaction is applied.
-
19|
Prepare methyl ester reagents by adding 160 μl of acetyl chloride slowly and dropwise to 1 ml of either D0-methanol 99% or D4-methanol >99% in glass vials. Add mini-magnetic stirbar to glass vials and stir at slow speed while adding acetyl chloride.
! CAUTION This reaction should be performed in a fume hood. As the reaction is exothermic, glass vial will be warm to the touch while the acetyl chloride is added. However, caution is needed as the reagents may react violently if the acetyl chloride is added too quickly.
-
20|
Add 100 μl of methyl ester reagent (D0-methanol 99%) to histone sample from cellular state 1, and add 100 μl of deuterated methyl ester reagent (D4-methanol >99%) to histone sample from cellular state 2 and allow reaction to proceed at room temperature for 1 h.
? TROUBLESHOOTING
-
21|
Repeat Steps 17–20.
▲ CRITICAL STEP Usually, performing the methyl ester reaction twice ensures maximum conversion (>95%) of carboxylic groups to their corresponding methyl esters.
-
22|
Bring samples to dryness using a SpeedVac concentrator.
■ PAUSE POINT Labeled samples can be stored for 1–2 days at −80 °C.
Mass spectrometry analysis
-
23|
For qualitative analysis, dilute samples with 20 μl of MS sample buffer (0.1% acetic acid) and add 1 μl of glacial acetic acid. Vortex and spin down in a mini-centrifuge for 1 min. For quantitative analysis, dilute samples with 20 μl of MS sample buffer (0.1% acetic acid) and add 1 μl of glacial acetic acid; then, mix equal volumes of both samples. Vortex and spin down in a mini-centrifuge for 1 min.
▲ CRITICAL STEP For best quantitative results, you should add equal amounts of histone sample from state 1 and state 2. To ensure equal loading, you may have to first analyze each sample individually to determine total ion signal from each sample and adjust accordingly (see refs. 13–17).
-
24|
Load sample onto microcapillary column, perform online RP-HPLC separation of peptides using nanoflowLC (see suggested gradient in EQUIPMENT SETUP) and directly elute into an electrospray ionization high-resolution tandem mass spectrometer operated in data-dependent MS/MS mode.
? TROUBLESHOOTING
Data analysis
-
25|
Mass spectral data may be searched against histone protein sequence databases using search algorithms such as SEQUEST or Mascot for identification of modification sites, but manual validation of results is essential. For database searches, use the following differential modifications on lysine residues: unmodified (+56.03 Da), monomethylation (+70.04 Da), dimethylation (+28.03 Da), trimethylation (+42.05 Da) and acetylation (+42.01 Da). A static modification of +56.03 Da should be used on all N-termini. If methyl ester stable isotope labeling is used, search data using +14.02 Da (D0-methyl ester) and +17.03 Da (D3-methyl ester).
? TROUBLESHOOTING
-
26|
Determine the relative quantification of histone modification sites by manually integrating the area under the curve of the selected ion species from all charge states as previously detailed (see refs. 10–12).
● TIMING
Propionic anhydride labeling before digestion, Steps 1–9: 2 h
Trypsin digestion and repropionic anhydride, Steps 10–16: 8–12 h
Stable isotope labeling, Steps 17–22: 3 h
Mass spectrometry analysis, Steps 23–24: 2 h per sample
Data analysis, Steps 25–26: variable, dependent on user
? TROUBLESHOOTING
Step 24
As several peptides having similar retention times can roughly coelute into the mass spectrometer, undersampling of low-level modified histone peptides is occasionally observed. You may need to adjust the HPLC gradient to make it more gradual to better separate peptides. However, the scan rates on most LTQ ion trap-based mass spectrometers (which we recommend) is more than sufficient to obtain MS/MS spectra for nearly all eluted peptides.
Step 25 (incomplete labeling of lysine groups)
In Step 5, if the pH drops and you are not able to quickly raise the pH to 8, the result may be incomplete labeling of lysine groups. Unfortunately, inefficient propionylation cannot be assessed until analysis by LC-MS/MS. If a drop in pH is prolonged (>1 minute), then it is advised to repeat the propionylation step.
Step 25 (incomplete labeling of carboxylic groups)
In Step 20, if there are trace levels of water in the samples, this could result in incomplete labeling of carboxylic groups. Inefficient conversion to methyl esters can be assessed by LC-MS/MS analysis.
ANTICIPATED RESULTS
Identification of histone modification sites
Figure 1 displays the peptides that can be expected from a trypsin digest of propionylated histone H3.2. As lysine residues are blocked by chemical or endogenous modifications, cleavage happens only at arginine residues. It should be noted that only N-termini, and endogenously unmodified and monomethylated lysines can be derivatized with propionic anhydride, and that dimethylated, trimethylated or acetylated lysines are too sterically hindered to allow the addition of the propionyl amide group. This allows the user to produce a small number of easily predicted peptides from histone proteins (all core histones), which is difficult otherwise because of the large number of basic residues and PTMs. These predictable peptides also yield MS/MS spectra that are easier to analyze due to their pseudotryptic character. Figure 2 shows the MS/MS spectra of the 18–26-residue fragment containing an acetylation modification at lysine 23. As all peptides fragments can be predicted, the peptide masses can also be calculated with mass additions corresponding to certain PTMs and data searched accordingly (computer search or manually).
Relative quantification of histone modification sites
It is recommended that samples be first analyzed qualitatively by MS before stable isotope labeling to estimate peptide levels for equal mixing of labeled samples for comparative analysis. A good check to determine whether equal amounts of the two label samples were loaded is to check the ion signal originating from peptides that are not modified such as the 41–49-residue peptide from histone H3 shown in Figure 3a. If equal amounts of each sample are loaded, then an ion ratio of approximately 1:1 should be observed (Fig. 3a). Analysis of other histone H3 peptides can then reveal if certain PTMs are enriched on any sample, such as is displayed in Figure 3b for the 27–40-residue fragment containing a trimethylation on lysine 27 from the H3.2 sample.
Figure 3.

Differential expression mass spectrometry analysis of histone PTMs. (a) An example of methyl ester stable isotope labeling of histone H3 samples. Summed full MS spectrum spanning the 551–555 m/z region from the comparative analysis of histone H3 variants, H3.1 (labeled D0-methanol, light) and H3.2 (labeled D3-methanol, heavy). Doublet peaks at 551.8212 and 553.3304 m/z both correspond to the peptide pr-YRPGTVALR with one stable isotope label incorporated at the C-terminus (pr = propionyl group). The observed ion ratio is roughly 1:1, demonstrating equal loading of the two samples as this peptide is not modified and only one form exists. (b) Summed full MS spectrum spanning the 828–833 m/z region from the same comparative analysis between histone H3 variants, H3.1 (labeled D0-methanol, light) and H3.2 (labeled D3-methanol, heavy). Doublet peaks at 829.4917 and 831.0007 m/z both corresponding to the peptide pr-Kme3SAPATGGVKprKprPHR with the incorporation of one stable isotope label at the C-terminus (pr = propionyl group). This peptide with a trimethylation modification at K27 from the H3.2 sample was found in twofold abundance compared to the H3.1 sample.
Acknowledgments
Funding from the National Institutes of Health (GM 37537) to D.F.H. and the Ford Foundation to B.A.G is gratefully acknowledged.
Footnotes
COMPETING INTERESTS STATEMENT The authors declare they have no competing financial interests.
References
- 1.Turner BM. Cellular memory and the histone code. Cell. 2002;111:285–291. doi: 10.1016/s0092-8674(02)01080-2. [DOI] [PubMed] [Google Scholar]
- 2.Berger SL. Histone modifications in transcriptional regulation. Curr Opin Genet Dev. 2002;12:142–148. doi: 10.1016/s0959-437x(02)00279-4. [DOI] [PubMed] [Google Scholar]
- 3.Jenuwein T, Allis CD. Translating the histone code. Science. 2001;293:1074–1080. doi: 10.1126/science.1063127. [DOI] [PubMed] [Google Scholar]
- 4.Zhang K, et al. Identification of acetylation and methylation sites of histone H3 from chicken erythrocytes by high-accuracy matrix-assisted laser desorption ionization-time-of-flight, matrix-assisted laser desorption ionization-postsource decay, and nanoelectrospray ionization tandem mass spectrometry. Anal Biochem. 2002;306:259–269. doi: 10.1006/abio.2002.5719. [DOI] [PubMed] [Google Scholar]
- 5.Strahl BD, et al. Methylation of histone H4 at arginine 3 occurs in vivo and is mediated by the nuclear receptor coactivator PRMT1. Curr Biol. 2001;11:996–1000. doi: 10.1016/s0960-9822(01)00294-9. [DOI] [PubMed] [Google Scholar]
- 6.Zhang L, Eugeni EE, Parthun MR, Freitas MA. Identification of novel histone post-translational modifications by peptide mass fingerprinting. Chromosoma. 2004;112:77–86. doi: 10.1007/s00412-003-0244-6. [DOI] [PubMed] [Google Scholar]
- 7.Pesavento JJ, Kim YB, Taylor GK, Kelleher NL. Shotgun annotation of histone modifications: a new approach for streamlined characterization of proteins by top down mass spectrometry. J Am Chem Soc. 2004;126:3386–3387. doi: 10.1021/ja039748i. [DOI] [PMC free article] [PubMed] [Google Scholar]
- 8.McKittrick E, Gafken PR, Ahmad K, Henikoff S. Histone H3.3 is enriched in covalent modifications associated with active chromatin. Proc Natl Acad Sci USA. 2004;101:1525–1530. doi: 10.1073/pnas.0308092100. [DOI] [PMC free article] [PubMed] [Google Scholar]
- 9.Mollah S, et al. New approach for mapping of post-translational modifications of histones. 50th American Society for Mass Spectrometry Conference Proceedings; Orlando, Fl. 2002. [Google Scholar]
- 10.Peters AH, et al. Partitioning and plasticity of repressive histone methylation states in mammalian chromatin. Mol Cell. 2003;12:1577–1589. doi: 10.1016/s1097-2765(03)00477-5. [DOI] [PubMed] [Google Scholar]
- 11.Bonaldi T, Imhof A, Regula JT. A combination of different mass spectroscopic techniques for the analysis of dynamic changes of histone modifications. Proteomics. 2004;4:1382–1396. doi: 10.1002/pmic.200300743. [DOI] [PubMed] [Google Scholar]
- 12.Loyola A, Bonaldi T, Roche D, Imhof A, Almouzni G. PTMs on H3 variants before chromatin assembly potentiate their final epigenetic state. Mol Cell. 2006;24:309–316. doi: 10.1016/j.molcel.2006.08.019. [DOI] [PubMed] [Google Scholar]
- 13.Syka JE, et al. Novel linear quadrupole ion trap/FT mass spectrometer: performance characterization and use in the comparative analysis of histone H3 post-translational modifications. J Proteome Res. 2004;3:621–626. doi: 10.1021/pr0499794. [DOI] [PubMed] [Google Scholar]
- 14.Johnson L, et al. Mass spectrometry analysis of Arabidopsis histone H3 reveals distinct combinations of post-translational modifications. Nucleic Acids Res. 2004;32:6511–6518. doi: 10.1093/nar/gkh992. [DOI] [PMC free article] [PubMed] [Google Scholar]
- 15.Garcia BA, Busby SA, Shabanowitz J, Hunt DF, Mishra N. Resetting the epigenetic histone code in the MRL-lpr/lpr mouse model of lupus by histone deacetylase inhibition. J Proteome Res. 2005;4:2032–2042. doi: 10.1021/pr050188r. [DOI] [PubMed] [Google Scholar]
- 16.Hake SB, et al. Expression patterns and post-translational modifications associated with mammalian histone H3 variants. J Biol Chem. 2006;281:559–568. doi: 10.1074/jbc.M509266200. [DOI] [PubMed] [Google Scholar]
- 17.Garcia BA, et al. Comprehensive phosphoprotein analysis of linker histone H1 from Tetrahymena thermophila. Mol Cell Proteomics. 2006;5:1593–1609. doi: 10.1074/mcp.M600086-MCP200. [DOI] [PubMed] [Google Scholar]