Abstract
Magnetic resonance imaging (MRI) can depict not only anatomical information, but also physiological factors such as velocity and pressure gradient. Measurement of these physiological factors is necessary to understand the cerebrospinal fluid (CSF) environment. In this study we quantified CSF motion in various parts of the CSF space, determined changes in the CSF environment with aging, and compared CSF pressure gradient between patients with idiopathic normal pressure hydrocephalus (iNPH) and healthy elderly volunteers. Fifty-seven healthy volunteers and six iNPH patients underwent four-dimensional (4D) phase-contrast (PC) MRI. CSF motion was observed and the pressure gradient of CSF was quantified in the CSF space. In healthy volunteers, inhomogeneous CSF motion was observed whereby the pressure gradient markedly increased in the center of the skull and gradually decreased in the periphery of the skull. For example, the pressure gradient at the ventral surface of the brainstem was 6.6 times greater than that at the convexity of the cerebrum. The pressure gradient was statistically unchanged with aging. The pressure gradient of patients with iNPH was 3.2 times greater than that of healthy volunteers. The quantitative analysis of 4D-PC MRI data revealed that the pressure gradient of CSF can be used to understand the CSF environment, which is not sufficiently given by subjective impression of the anatomical image.
Keywords: cerebrospinal fluid, magnetic resonance imaging, cerebrospinal fluid motion, quantitative data analysis, image analysis
Introduction
In recent years, several studies have cast doubt on the traditional cerebrospinal fluid (CSF) circulation theory. Some of the criticism has been due to the results of magnetic resonance imaging (MRI) studies,1–6) which have indicated that the CSF does not move in a laminar flow in the CSF space. The CSF can move in a turbulent, swirling, oscillating fashion in various parts of the CSF space. Today, many researchers believe that CSF does not act like water in a river, moving in a unidirectional fashion throughout several parts of the CSF space, and the terms CSF flow and CSF circulation in the CSF space have been replaced with CSF motion or CSF movement.7) These new concepts arose from several different types of MRI sequences. Unfortunately, most of these imaging techniques do not produce quantitative data, and interpretation is limited to subjective impression. This may not provide a full understanding of the true CSF motion, and cannot be used to identify diseases such as hydrocephalus that involve disturbance of the CSF motion. Additionally, the question has arisen as to how CSF motion changes with aging. Understanding the relation between CSF motion and aging is important to understand the CSF environment. Idiopathic normal pressure hydrocephalus (iNPH) is caused by the disturbance of CSF motion distribution, usually found in elderly individuals, and for this reason it is important to identify the CSF motion in elderly individuals.
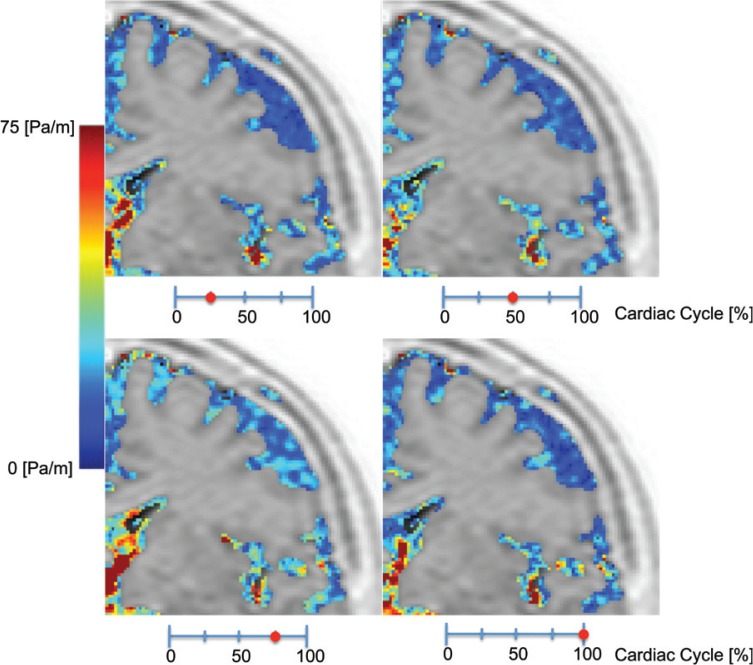
In 2014, the authors performed quantitative analysis of CSF motion using pressure gradient data in both healthy volunteers and patients with iNPH and Chiari type I malformation. Data were obtained by four-dimensional (4D) phase-contrast (PC) imaging.1) The 4D-PC technique shows not only the velocity of the CSF, but also allows the pressure gradient of CSF motion to be quantified. Using this technique, we found that the pressure gradient of CSF motion increased in the ventricular system, and that CSF motion seemed to be silent in the convexity of cerebrum (Fig. 1). This suggests that the motion of the CSF is inhomogeneous in the CSF space. However, previous reports of inhomogeneous CSF motion in the CSF space are limited to subjective impression. The next step is to use quantitative data to show inhomogeneous CSF motion in the CSF space. In the present article we performed quantitative analysis of CSF motion in various part of the CSF space. In addition, we quantified the change in CSF pressure gradient with age, and compared pressure gradient between patients with iNPH and healthy elderly volunteers.
Fig. 1.
High-magnification, coronal-plane pressure-gradient images of the left frontal lobe in a 55-year-old healthy volunteer at four different phases of a cardiac cycle. The images show the inhomogeneity of the pressure gradient distribution. There is a markedly increased pressure gradient at the foramen of Monro, a slightly increased pressure gradient in the distal Sylvian fissure, and a markedly decompressed pressure gradient in the convexity of the cerebrum.
Materials and Methods
Our institution’s internal review board approved this research. All volunteers were examined after providing appropriate informed consent, consistent with the terms of approval from the internal review board of Tokai University Hospital, Kanagawa, Japan.
CSF motion was quantified in 57 healthy volunteers aged 21–80 years and 6 patients with iNPH aged 65–85 years. The pressure gradient of CSF in the intracranial CSF space was examined in a thick sagittal slab from the midline that covered the entire fourth ventricle and ventral surface of the brainstem, including the interpeduncular, prepontine, and premedullary cisterns, and a thick coronal slab vertical to the line between the anterior commissure and the posterior commissure that covered the entire foramen of Monro of the lateral and third ventricles and the convexity of the cerebrum that covered the surface of the frontal lobe expect the Sylvian fissure and interhemispheric fissure. Images of the Sylvian aqueduct in the sagittal slices were used to quantify the pressure gradient used in comparison across age groups and in comparison between healthy volunteers and patients with iNPH. For quantitative analysis of the effects of age on the pressure gradient, the healthy volunteers were divided in to three groups: young (age 20–39 years, n = 19), middle aged (age 40–59 years, n = 18), and elderly (age > 60 years, n = 20).
A 1.5-Tesla magnetic resonance (MR) scanner (Gyroscan Intera; Philips Medical Systems, Best, the Netherlands) equipped with an eight-channel phase array head and neck surface coil was used for MRI. Quantitative, 4D-PC imaging was performed in a volume acquisition manner with the following parameters: foot-head, right-left, and anterior-posterior flow encode directions; 32 cardiac phases; 9.8–16.4 ms repetition time; 6.6–6.7 ms echo time; 20-degree flip angle; 22 × 22 cm2 or 32 × 32 cm2 field of view; 5–50 cm/s velocity encoding; and 1.96 × 1.96 × 1.96 acquisition matrix. The resultant spatial resolution of the data was isotropically 1.96 mm. The principle of this analysis represents the velocity obtained in the three directions (anterior-posterior, right-left, head-foot) by the PC method. The obtained velocity information was used to calculate the pressure gradient between each side of the voxel using the Navier-Stokes equations. Further, we used cardiac gated dynamic cine images within one cardiac cycle and created a 4D pressure-gradient image. We quantified each parameter at each region of interest (ROI) within the skull, and carried out statistical processing. The intensity of the pressure gradient was indicated using a color scale. The color-coded CSF pressure gradient was then superimposed onto T2-weighted images of the stationary tissues. All image processing was performed on an independent workstation (Power Mac Pro, Quad-Core Intel Xeon; Apple Inc., Cupertino, California, USA) by our home-built software written with Matlab (R2012b; MathWorks, Natick, Massachusetts, USA).
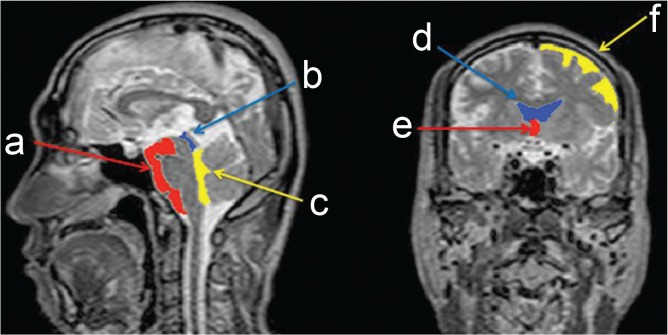
After obtaining the color-coded pressure-gradient images, board-certified neurosurgeons who are also experienced in MR image interpretation specified rough outlines of the ROI around the ventral surface of the brainstem and the fourth ventricle on the sagittal images using a homemade mouse-operated graphical user interface (Fig. 2). They performed the same ROI delineation around the convexity of the cerebrum, the lateral ventricle, and the third ventricle on the coronal images. The partial volume effect8) arising from the relatively large voxel size (approximately 2 mm) used in the present experiment made a simple threshold-based segmentation of the T2-weighted image difficult. To segment the CSF regions on the images with reduced partial volume effect and to apply these images to the velocity and pressure images as masks for the quantitative analyses, a novel segmentation technique called spatial-based fuzzy clustering was applied. The details of this technique are explained elsewhere.9)
Fig. 2.
Representative region of interest (ROI) for the segmented areas. a: ventral surface of the brainstem including the interpeduncular, prepontine, and premedullary cisterns, b: Sylvian aqueduct, c: fourth ventricle, d: lateral ventricle, e: third ventricle, and f: convexity of the cerebrum.
The CSF pressure gradient data extracted from each ROI are depicted in box plots. Because the Kolmogorov–Smirnov test and the Mann-Whitney U test can be applied to nonparametric data,10) these tests were used to compare pressure gradient across different ROIs. All statistical analyses were performed using SPSS software version 13 (SPSS Japan Inc., Tokyo).
Results
I. Pressure gradient of CSF
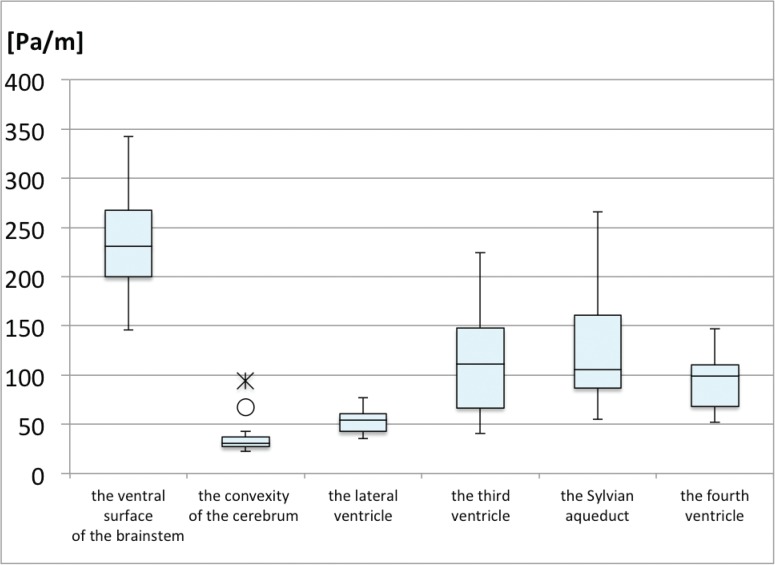
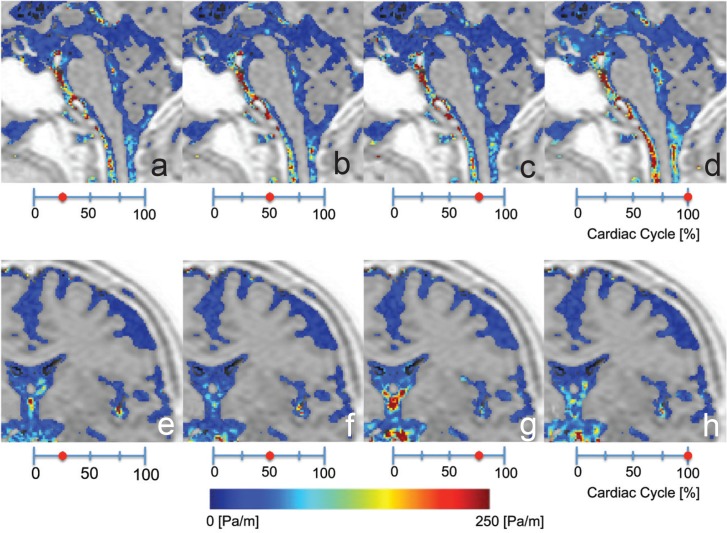
The box plots of the pressure gradient at the ventral surface of the brainstem, the convexity of the cerebrum, the lateral ventricle, the third ventricle, the Sylvian aqueduct, and the fourth ventricle show that CSF motion was inhomogeneous in the intracranial CSF space of healthy volunteers (Fig. 3). Fig. 4 shows representative pressure gradient color images from the ventral surface of the brainstem, the convexity of the cerebrum, the lateral ventricle, the Sylvian aqueduct, the third ventricle, and the fourth ventricle. The median value of each ROI is as follows: lateral ventricle = 53.27 Pa/m, third ventricle = 104.5 Pa/m, Sylvian aqueduct = 101.1 Pa/m, fourth ventricle = 94.64 Pa/m, prepontine cistern = 219.0 Pa/m, convexity of the cerebrum = 32.84 Pa/m.
Fig. 3.
Box plots of pressure gradient at the ventral surface of the brainstem, including the interpeduncular, prepontine, and premedullary cisterns, at the convexity of the cerebrum, the lateral ventricle, the third ventricle, and the fourth ventricle. Outside values are indicated by a small “o” and far-out values are indicated by an asterisk.
Fig. 4.
a–d: Representative sagittal-plane pressure-gradient images from the ventral surface of the brainstem and the fourth ventricle. e–h: Coronal-plane pressure-gradient images from the convexity of the cerebrum, the lateral ventricle, and the third ventricle. Note, the pressure gradient increased in the center of skull and gradually decreased toward the periphery of the skull.
In the subarachnoid space, CSF pressure gradient at the ventral surface of the brainstem was significantly higher than in other CSF spaces (Fig. 3). CSF pressure gradient at the convexity of the cerebrum was much lower than in the intracranial CSF space (Fig. 3). CSF pressure gradient at the ventral surface of the brainstem was statistically higher than at the convexity of cerebrum (p = 0.0001). In Fig. 4 it can be observed that the area of increased pressure gradient was limited to the distal Sylvian fissure.
In the ventricular system, CSF pressure gradient in the third ventricle was higher than that in the lateral ventricle (p = 0.011), but statistically similar to that in the fourth ventricle (p = 0.419) (Fig. 3). The pressure gradient in the Sylvian aqueduct was statistically similar to that in the third ventricle (p = 0.525) and the fourth ventricle (p = 0.299). The pressure gradient was smoothly transmitted from the third ventricle to the adjacent ventricular system through both the foramen of Monro and the Sylvian aqueduct (Fig. 4).
II. Comparison of the pressure gradient across age groups
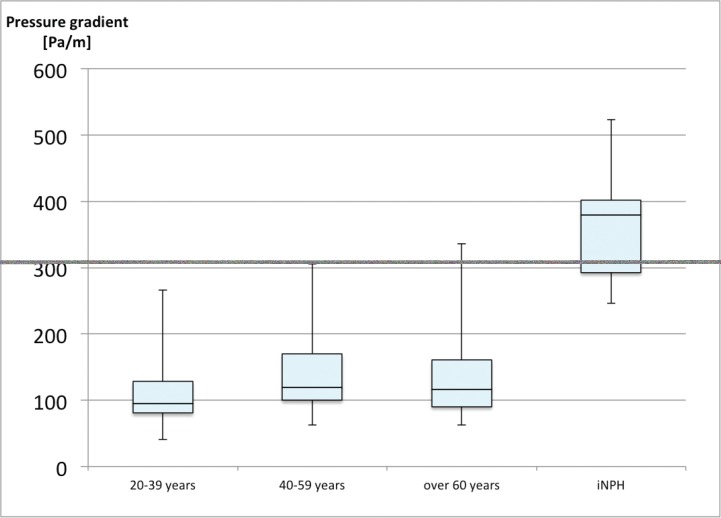
Figure 5 shows the pressure gradient at the Sylvian aqueduct in the three age groups of healthy volunteers. The medial value of each group is as follows: younger group = 92.50 Pa/m, middle age group = 109.4 Pa/m, elder age group = 114.5 Pa/m. The pressure gradient tended to be greater in the middle age group than in the younger age group (p = 0.089), but was similar in the middle age group and the elder age group (p = 0.977).
Fig. 5.
Box plots of the pressure gradient in the three age groups of healthy subjects and in patients with iNPH. The pressure gradient was unchanged with age but was higher in patients with iNPH than in healthy elderly volunteers. iNPH: idiopathic normal pressure hydrocephalus.
III. Comparison of the pressure gradient across healthy volunteers and patients with iNPH
The pressure gradient in patients with iNPH (median = 365.6 Pa/m) was 3.2 times greater than that in healthy elderly participants (median = 114.5 Pa/m) (p = 0.001) (Fig. 5).
Discussion
Our previous study suggested that CSF motion was not homogeneous throughout the CSF space.1) The present study of CSF motion in healthy volunteers showed a marked increase in the pressure gradient in the ventral surface of the brainstem and a low pressure gradient in the convexity of the cerebrum, and the quantitative analysis indicated that the difference was 6.6-fold. Compared to other MR sequencing methods, the 4D-PC method is a powerful tool for quantitative analysis,11) as shown for pressure gradient and velocity in this study.1) To our knowledge, this is the first report to provide a detailed description of the inhomogeneity of CSF motion quantified from MRI data. Contrary to our hypothesis, there was no change in pressure gradient with age. However, there was a significant difference between healthy elderly subjects and patients with iNPH, whereby CSF pressure gradient was 3.2 times greater in patients with iNPH than in healthy elderly participants.
For many years, quantitative velocity data obtained using the PC method was widely used by many researchers.12–15) However, the velocity map was sometimes confusing to interpret, for example the velocity vector appeared outside the skull when the velocity was high. In this study we used pressure gradient because a pressure gradient map shows the fluid motion status more clearly than a vector map such as that created in velocity mapping, and thus makes the interpretation of 4D-PC data somewhat easier for the clinician and the researcher.1)
In this study, we used a relatively coarse spatial resolution to limit the acquisition time to one that is acceptable for future use in patients. Consequently, the segmentation of the CSF space under the presence of the partial volume effect was one of the key technical issues in this study. Previous studies have shown that automated segmentation is more accurate than clinicians’ manual segmentation.16,17) The accuracy of the segmentation method used in this study9) was equivalent to that of expert clinicians’ manual segmentation, even with the partial volume effect. Thus, we adopted a statistical quantitative analysis based on the automated segmentation.
We observed a pressure gradient in the intracranial cavity whereby pressure was high in the center and significantly decreased toward the periphery because this region no longer maintained increased pressure gradient forces. Computation models have indicated that CSF velocity is higher in the pontine cistern than in other cisterns.18) In 2011, Min et al. supported this theory and proposed that the energy contained in the CSF pulsatile flow, which is derived from intracranial arterial pulsation, is more than 100-fold greater than the energy contained in the CSF bulk flow.19) In the basal cisterns that are located behind the clivus, the CSF engulfs the major vessels in the basal cistern, which is largely in contact with vertebra-basilar arteries. The vertebra-basilar artery covers a long distance and, for this reason, the surrounding CSF is easily affected by the pulsation of the artery. This explains why the pressure gradient was high at the ventral surface of the brainstem.
Theoretically, water is not compressed and the pressure gradient should be equal in any region that has homogenized CSF space.20) However, CSF has a slight viscosity and the CSF space is not a rigid tube-like space, as the ependymal layer of the ventricular system is not elastic, the structures adjacent to the subarachnoid space (the dura mater, inner table of the skull, and gray matter of the parenchyma) have different elasticity, the diameter of the CSF space is irregular, and the arachnoid trabeculae,21) vessels,21) and cranial nerves21) oppose the transmission of CSF motion. All these anatomical properties affect the transmission of CSF motion. In addition, Liliequist membrane, which forms the upper border of the interpeduncular cistern, is a major barrier against the transmission of CSF motion, and localized pressure is exerted on the CSF space from the vessels in the ependymal layer and parenchyma of the brain, creating a localized pump action that also affects the inhomogeneity of the CSF space. This results in poor transmission of the pressure gradient through the subarachnoid space in this region, and underlies the weak pressure gradient in the convexity of cerebrum.
Presumably, compliance of the brain and the vessel walls decrease with aging. Decreased compliance would cause the CSF space to become more rigid. Therefore, CSF motion would be restricted in the rigid CSF space, and CSF pressure gradient would increase with aging. Contrary to our expectation, the CSF pressure gradient was not dramatically increased with aging. This is the first report to examine changes in intracranial physiological factors with age.
In 1992, Schroth and Klose pointed out that the velocity of the CSF in the Sylvian aqueduct was increased in patients with iNPH,22) as evaluated using PC MRI data. Our data show that quantitative analysis of CSF pressure gradient is useful in the identification of patients with iNPH.
Accuracy of PC measurements
In 1993, Tang et al. used computer simulations and in vitro experiments to evaluate the accuracy of PC measurements and reported that measurement accuracy was within 10%.8) They also showed that the accuracy greatly depended on the relative signal intensity of stationary tissue and was better for laminar flow than for plug flow.8)
Conclusion
In this study, we performed quantitative analysis of 4D-PC MRI data and showed that the pressure gradient of CSF was inhomogeneous across the CSF space. The pressure gradient did not change with age but was useful to distinguish between healthy elderly volunteers and patients with iNPH. The results of this 4D-PC analysis provide new understanding of CSF physiology and additional valuable information that is relevant to CSF disorders.
Acknowledgments
The authors thank Isao Muro, R.T. and Nao Kajihara, R.T. for their assistance with the MRI.
This study was supported in part by Research and Study Project of Tokai University Educational System General Research Organization and Labor Sciences Research Grant from the Japanese government for research on rare and intractable disease.
All authors were involved in the conception and design of these experiments. Drs. Hayashi and Matsumae collected the data. Drs. Hirayama, Yatsushiro, Abdullah, and Kuroda participated in the analysis and interpretation of the data. Drs. Hayashi and Matsumae wrote the manuscript and all authors critically revised the article and reviewed the final version prior to submission of the manuscript. Dr. Matsumae supervised the study.
References
- 1). Matsumae M, Hirayama A, Atsumi H, Yatsushiro S, Kuroda K: Velocity and pressure gradients of cerebrospinal fluid assessed with magnetic resonance imaging. J Neurosurg 120: 218– 227, 2014. [DOI] [PubMed] [Google Scholar]
- 2). Sweetman B, Xenos M, Zitella L, Linninger AA: Three-dimensional computational prediction of cerebrospinal fluid flow in the human brain. Comput Biol Med 41: 67– 75, 2011. [DOI] [PMC free article] [PubMed] [Google Scholar]
- 3). Stadlbauer A, Salomonowitz E, van der Riet W, Buchfelder M, Ganslandt O: Insight into the patterns of cerebrospinal fluid flow in the human ventricular system using MR velocity mapping. Neuroimage 51: 42– 52, 2010. [DOI] [PubMed] [Google Scholar]
- 4). Stadlbauer A, Salomonowitz E, Brenneis C, Ungersböck K, van der Riet W, Buchfelder M, Ganslandt O: Magnetic resonance velocity mapping of 3D cerebrospinal fluid flow dynamics in hydrocephalus: preliminary results. Eur Radiol 22: 232– 242, 2012. [DOI] [PubMed] [Google Scholar]
- 5). Greitz D, Franck A, Nordell B: On the pulsatile nature of intracranial and spinal CSF-circulation demonstrated by MR imaging. Acta Radiol 34: 321– 328, 1993. [PubMed] [Google Scholar]
- 6). Yamada S, Miyazaki M, Kanazawa H, Higashi M, Morohoshi Y, Bluml S, McComb JG: Visualization of cerebrospinal fluid movement with spin labeling at MR imaging: preliminary results in normal and pathophysiologic conditions. Radiology 249: 644– 652, 2008. [DOI] [PubMed] [Google Scholar]
- 7). Oresković D, Klarica M: The formation of cerebrospinal fluid: nearly a hundred years of interpretations and misinterpretations. Brain Res Rev 64: 241– 262, 2010. [DOI] [PubMed] [Google Scholar]
- 8). Tang C, Blatter DD, Parker DL: Accuracy of phase-contrast flow measurements in the presence of partial-volume effects. J Magn Reson Imaging 3: 377– 385, 1993. [DOI] [PubMed] [Google Scholar]
- 9). Abdullah A, Hirayama A, Yatsushiro S, Matsumae M, Kuroda K: Cerebrospinal fluid image segmentation using spatial fuzzy clustering method with improved evolutionary Expectation Maximization. Conf Proc IEEE Eng Med Biol Soc 2013: 3359– 3362, 2013. [DOI] [PubMed] [Google Scholar]
- 10). McDonald JH: Handbook of Biological Statistics, ed 2 Maryland, Sparky House Publishing, 2009. [Google Scholar]
- 11). Mase M, Yamada K, Banno T, Miyachi T, Ohara S, Matsumoto T: Quantitative analysis of CSF flow dynamics using MRI in normal pressure hydrocephalus. Acta Neurochir Suppl 71: 350– 353, 1998. [DOI] [PubMed] [Google Scholar]
- 12). Edelman RR, Wedeen VJ, Davis KR, Widder D, Hahn P, Shoukimas G, Brady TJ: Multiphasic MR imaging: a new method for direct imaging of pulsatile CSF flow. Radiology 161: 779– 783, 1986. [DOI] [PubMed] [Google Scholar]
- 13). Bradley WG: Magnetic resonance imaging in the evaluation of cerebrospinal fluid flow abnormalities. Magn Reson Q 8: 169– 196, 1992. [PubMed] [Google Scholar]
- 14). Yatsushiro S, Hirayama A, Matsumae M, Kuroda K: Visualization of pulsatile CSF motion separated by membrane-like structure based on four-dimensional phase-contrast (4D-PC) velocity mapping. Conf Proc IEEE Eng Med Biol Soc 2013: 6470– 6473, 2013. [DOI] [PubMed] [Google Scholar]
- 15). Bradley WG, Scalzo D, Queralt J, Nitz WN, Atkinson DJ, Wong P: Normal-pressure hydrocephalus: evaluation with cerebrospinal fluid flow measurements at MR imaging. Radiology 198: 523– 529, 1996. [DOI] [PubMed] [Google Scholar]
- 16). Morey RA, Petty CM, Xu Y, Hayes JP, Wagner HR, Lewis DV, LaBar KS, Styner M, McCarthy G: A comparison of automated segmentation and manual tracing for quantifying hippocampal and amygdala volumes. Neuroimage 45: 855– 866, 2009. [DOI] [PMC free article] [PubMed] [Google Scholar]
- 17). Cherbuin N, Anstey KJ, Réglade-Meslin C, Sachdev PS: In vivo hippocampal measurement and memory: a comparison of manual tracing and automated segmentation in a large community-based sample. PLoS ONE 4: e5265, 2009. [DOI] [PMC free article] [PubMed] [Google Scholar]
- 18). Linninger AA, Sweetman B, Penn R: Normal and hydrocephalic brain dynamics: the role of reduced cerebrospinal fluid reabsorption in ventricular enlargement. Ann Biomed Eng 37: 1434– 1447, 2009. [DOI] [PubMed] [Google Scholar]
- 19). Min KJ, Yoon SH, Kang JK: New understanding of the role of cerebrospinal fluid: offsetting of arterial and brain pulsation and self-dissipation of cerebrospinal fluid pulsatile flow energy. Med Hypotheses 76: 884– 886, 2011. [DOI] [PubMed] [Google Scholar]
- 20). Chandran K, Rittgers S, Yoganathan A: Biofluid Mechanics: The Human Circulation, ed 2 Boca Raton, Taylor and Francis, 2012. [Google Scholar]
- 21). Yaşargil MG: Microsurgical Anatomy of the Basal Cisterns and Vessels of the Brain, Diagnostic Studdies, General Operative Techniques and Pathological Considerations of the Intracranial Aneurysms. New York, Georg Thieme Verlag, 1984. [Google Scholar]
- 22). Schroth G, Klose U: Cerebrospinal fluid flow. III. Pathological cerebrospinal fluid pulsations. Neuroradiology 35: 16– 24, 1992. [DOI] [PubMed] [Google Scholar]


