Abstract
Purpose
To assess the performance of computer extracted feature analysis of dynamic contrast enhanced (DCE) magnetic resonance images (MRI) of axillary lymph nodes. To determine which quantitative features best predict nodal metastasis.
Methods
This institutional board-approved HIPAA compliant study, in which informed patient consent was waived, collected enhanced T1 images of the axilla from patients with breast cancer. Lesion segmentation and feature analysis were performed on 192 nodes using a laboratory-developed quantitative image analysis (QIA) workstation. The importances of 28 features were assessed. Classification used the features as input to a neural net classifier in a leave-one-case-out cross-validation and evaluated with receiver operating characteristic (ROC) analysis.
Results
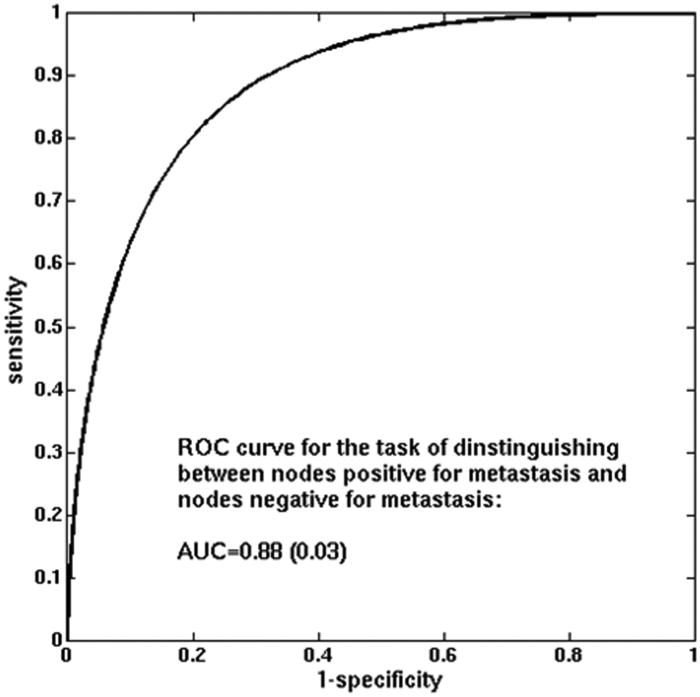
The area under the ROC curve (AUC) values for features in the task of distinguishing between positive and negative nodes ranged from just over 0.50 to 0.70. Five features yielded AUCs greater than 0.65: two morphological and three textural features. In cross-validation, the neural net classifier obtained an AUC of 0.88 (SE 0.03) for the task of distinguishing between positive and negative nodes.
Conclusion
QIA of DCE MRI demonstrated promising performance in discriminating between positive and negative axillary nodes.
Introduction
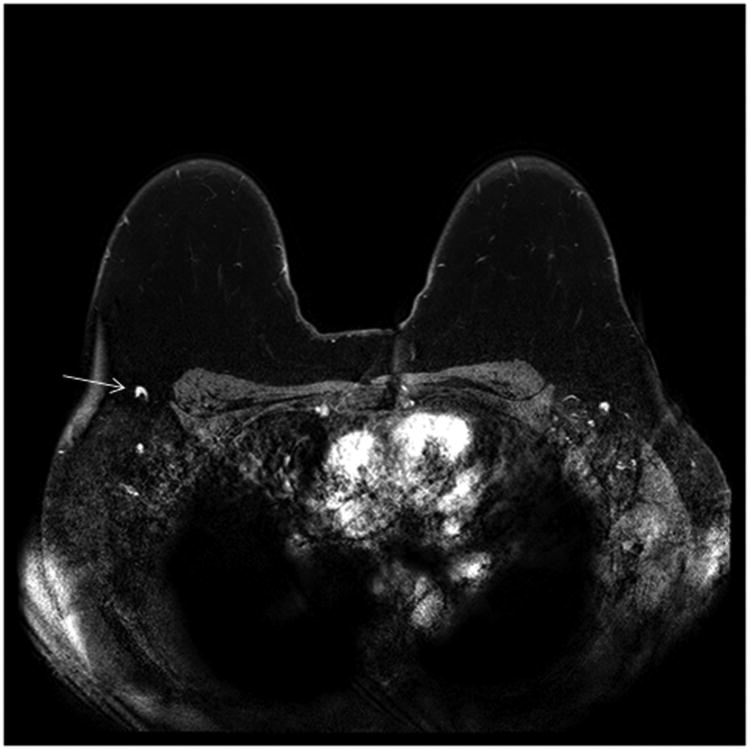
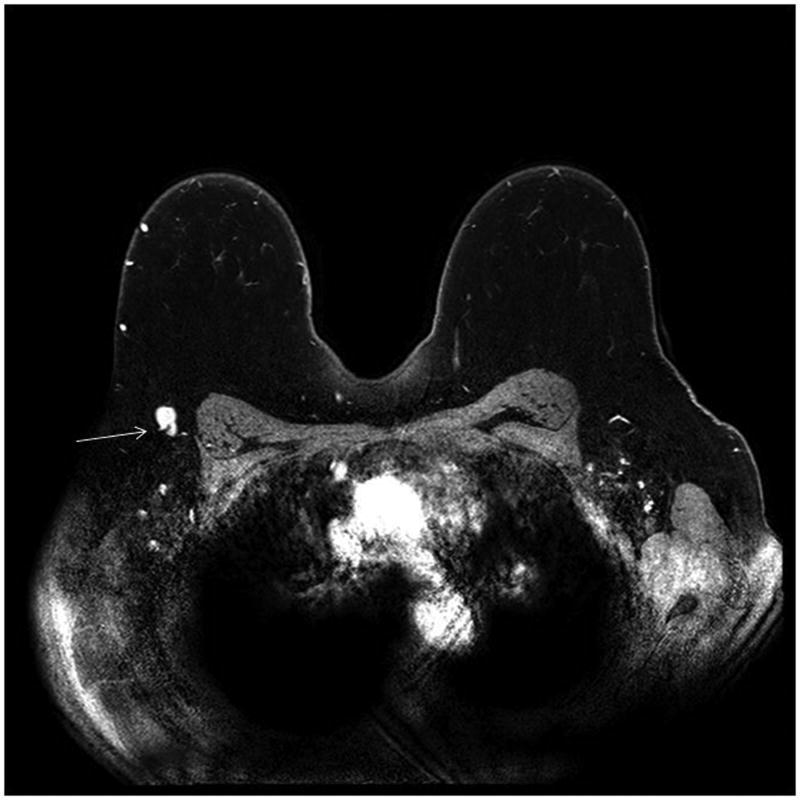
Breast MRI is often used in the clinical staging of patients with newly diagnosed breast cancer for defining extent of disease in the breast, detecting contralateral cancers [1], and detecting adenopathy. Axillary and internal mammary lymph nodes are readily detectable on MRI, and T2 weighted sequences and post-contrast dynamic sequences can both demonstrate the size and morphology of axillary lymph nodes. With these high-resolution sequences, the axillae can be viewed three dimensionally and a high level of anatomic detail is discernable. Such images are especially useful for determining architectural details of lymph nodes such as cortical size, morphology and the presence or absence of a fatty hilum (Figure 1).
Figure 1.
(a) Normal morphology right axillary lymph node (arrow) on an axial post-contrast T1 fat saturated subtracted sequence. Note the normal appearing enhancement of the lymph node and normal appearance of the fatty hilum with density similar to the background fat.
(b) Abnormal right axillary lymph node (arrow) on a post- contrast T1 fat saturated subtracted axial image: Enlarged nodal size and near complete loss of the fatty hilum are seen.
Quantitative image analysis (QIA) is an area of active research and includes rather well-established applications, such as computer-aided detection (CADe), and applications not yet available for everyday clinical use, such as computer-aided prognosis. Within radiology, and especially within the subspecialty of breast imaging, CADe has become mainstream for some imaging modalities and is often integrated within clinical workstations. On mammograms, CADe serves as a “second reader” and is used to detect masses and calcifications that could indicate the presence of invasive or in-situ carcinoma [2].
In this paper, we investigate the potential of computer-aided prognosis through axillary lymph node assessment in breast MRI. Currently, most commercially available software is more limited in its abilities and performs volumetric assessment of defined lesions, which can aid in surgical planning. Similarly, in cases where the patient will receive neoadjuvant chemotherapy, comparison measurements performed before and after therapy can be used as an imaging biomarker for response [3]. The use of more sophisticated QIA for breast MRI, however, remains an area of active research both for tumor classification [4], and for staging and prognosis [5]. In previous research studies, promising performance was obtained using image-based biomarkers for computer analysis of breast lesions in MRI, whereby the computer performed segmentation, extraction of morphologic and kinetic characteristics (features), and subsequent classification [6-9]. In this study, we investigated whether a QIA scheme utilizing a digital analysis of lymph nodes imaged on breast MRI is able to distinguish between lymph nodes that were positive for metastasis (‘positive’ nodes) and those that were negative for metastasis (‘negative’ nodes). In the future, such a scheme, if successful, could potentially help guide clinical management in the axilla.
Methods
This study was an institutional review board-approved, HIPPA compliant study, with waiver of informed consent. A retrospective review was performed on 66 cancer patients who underwent staging MRI at our institution between 2006 and 2010.
MR images were obtained by using 1.5 and 3.0 T systems depending on clinical availability. MRI was performed with a dedicated breast coil and the patient in the prone position (Table 1). Contrast material was injected IV (0.1 mmol/kg of gadodiamide [Omniscan, GE Healthcare]) and followed by a 20-mL saline flush at a rate of 2 mL/s. The same contrast material/protocol was used for all systems.
Table 1. Acquisition Protocols and Lymph Node Status of the MRI database of 66 cancer patients.
| 1.5 T Achieva Philips | 3 T Achieva Tx. Philips | ||
|---|---|---|---|
| Lymph Nodes | Number of Positive Lymph Nodes | 32 | 6 |
|
| |||
| Number of Negative Lymph Nodes | 123 | 31 | |
|
| |||
| Dynamic Studies | Study type | 3D gradient echo sequences One pre- and six post-contrast enhancement (axial) | 3D gradient echo sequences One pre- and five post-contrast enhancement (axial) |
|
| |||
| TR/TE | 5.5/2.7 | 5.5/2.7 | |
|
|
|||
| Flip angle | 10° | 10° | |
|
|
|||
| Slice thickness | 2 mm | 2 mm | |
|
|
|||
| Matrix size | 480×480 | 448×448 | |
|
|
|||
| FOV | 360 mm | 340 mm | |
|
|
|||
| Acquisition time | 75 second | 65 second | |
A database from 66 cancer patients was retrospectively collected for the assessment of QIA of axillary lymph nodes on MRI (Table 1). Analysis was performed on 154 negative lymph nodes and 38 positive lymph nodes, identified a posteriori by a board certified expert radiologist with 9 years of experience. Review of surgical pathology reports, radiology reports, and ultrasound images were used to establish the ‘gold standard’ of positivity or negativity for these lymph nodes. All axillary lymph nodes of the patients with negative sentinel lymph node biopsy were considered negative. All metastatic lymph nodes proven by ultrasound guided core needle biopsy were regarded as positive for metastasis. To correlate between the biopsy proven metastatic axillary LNs on ultrasound (US) and LNs shown on MRI, the same radiologist identified each metastatic axillary LN on MRI by comparing MR images with images from the US guided biopsy. When multiple lymph nodes (> 8) were proven positive for metastasis at axillary lymph node dissection, highly suspicious lymph nodes on MRI (up to three lymph nodes per patient) were presumed positive for metastasis.
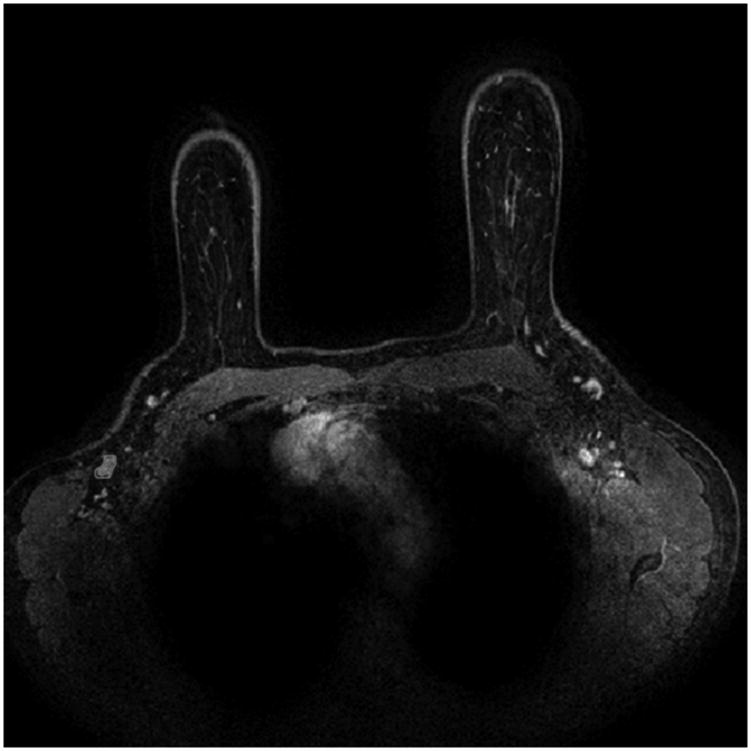
The methodology involved several steps which were all automated except for MR image acquisition (as detailed above) and the identification of the image locations of lymph nodes. The steps in the methodology not specific to the current application have been described extensively elsewhere [10, 11] and are briefly summarized here for clarity. An expert board-certified radiologist identified the locations of axillary lymph nodes visible in the MR images. The lymph nodes were then automatically segmented) using a method previously developed for breast tumors [10]. Subsequently, computer-extracted MR-based features were calculated to characterize the lymph nodes. The feature set describing each node consisted of 28 features, including 5 kinetic curve assessment, 4 variance of kinetics, 14 enhancement texture, and 5 morphological features (Figure 2a and Table 2). For the task of distinguishing between nodes positive for metastasis and those negative for metastasis, each feature was assessed individually to gain insight into which type of feature was relevant for this task. Subsequently, all features were used in combination through the use of a classifier to predict which nodes were positive and which were negative for metastasis. We used a Markov-Chain Monte-Carlo Bayesian Neural Net classifier [12] (MCMC-BNN) within leave-one-case-out cross-validation. Leave-one-case-out cross-validation is an accepted training and testing method with the aim to minimize database bias (overtraining) of a classifier. Here, for N cases, in each cross-validation a single case was assigned as the testing case and the remaining N-1 cases were used for classifier training. This process was repeated N times until all cases had served a test case.
Figure 2.
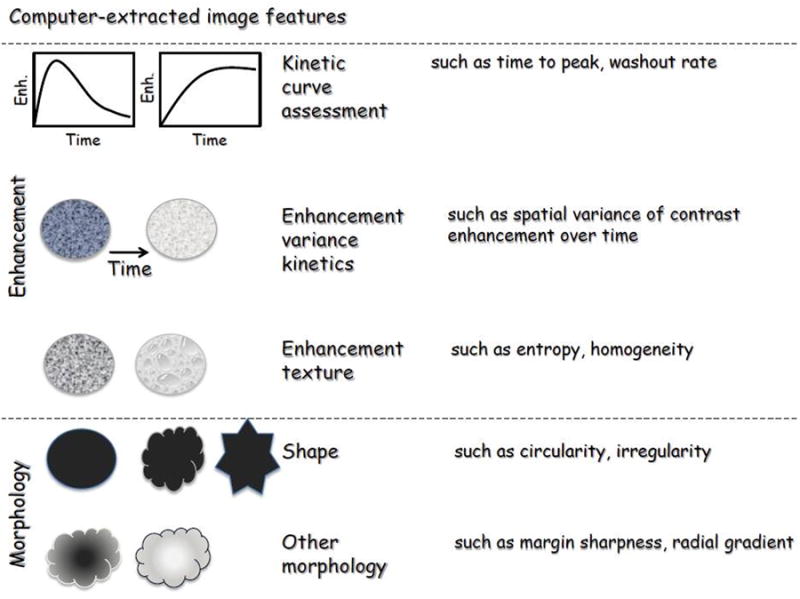
a: Pictorial representation of the characteristics analyzed
b: Example of a positive axillary lymph node with automated segmentation overlay (red outline)
Table 2.
| Feature category | Image feature | Description |
|---|---|---|
| Kinetic Curve Assessment | Maximum enhancement | Maximum contrast enhancement |
| Time to peak (s) | Time at which the maximum enhancement occurs | |
| Uptake rate (1/s) | Uptake speed of the contrast enhancement | |
| Washout rate (1/s) | Washout speed of the contrast enhancement | |
| Curve shape index | Difference between late and early enhancement | |
| Enhancement-Variance Kinetics | Maximum variance of enhancement | Maximum spatial variance of contrast enhancement over time |
| Time to peak at maximum variance (s) | Time at which the maximum variance occurs | |
| Enhancement variance increasing rate (1/s) | Rate of increase of the enhancement-variance during uptake | |
| Enhancement variance decreasing rate (1/s) | Rate of decrease of the enhancement-variance during washout | |
| Enhancement Texture | Angular second moment (Energy) | Image homogeneity |
| Contrast | Local image variations | |
| Correlation | Image linearity | |
| Entropy | Randomness of the gray-levels | |
| Sum of squares (Variance) | Spread in the gray-level distribution | |
| Difference entropy | Randomness of the difference of neighboring voxels' gray-levels | |
| Difference variance | Variations of difference of gray-levels between voxel-pairs | |
| Inverse difference moment | Image homogeneity | |
| Sum average | Overall brightness | |
| Sum entropy | Randomness of the sum of gray-levels of neighboring voxels | |
| Sum variance | Spread in the sum of the gray-levels of voxel-pairs distribution | |
| Information measure of correlation (IMC) 1 | Nonlinear gray-level dependence | |
| Information measure of correlation (IMC) 2 | Nonlinear gray-level dependence | |
| Maximum correlation coefficient | Nonlinear gray-level dependence | |
| Morphology | Sphericity/circularity | Similarity of the lesion shape to a sphere |
| Irregularity | Deviation of the lesion surface from the surface of a sphere | |
| Margin sharpness | Mean of the image gradient at the lesion margin | |
| Variance of margin sharpness | Variance of the image gradient at the lesion margin | |
| Variance of radial gradient histogram | Degree to which the enhancement structure extends in a radial pattern originating from the center of the lesion |
Hence, the novel aspects of the current study included (a) the application of a 3D segmentation method, which was previously developed on breast tumors [10], for the segmentation of axillary lymph nodes (Figure 2b), (b) the use of computer-extracted features (mathematical descriptors) to quantitatively characterize the nodes from MR image data [6-8,13], and (c) a neural network classifier to distinguish between nodes that were positive for metastasis and nodes that were negative for metastasis.
Performance was assessed both qualitatively – using box plots - and quantitatively using receiver operator characteristic (ROC) analysis with the area under the ROC curve (AUC) as the figure of merit [14, 15]. The performance of individual features was assessed to gain insight into their relative importance for the task at hand, and thus, statistical comparisons amongst performance of individual features were not performed. The aim was to determine whether we can learn anything at all from imaging features regarding lymph node status, not whether image-based features were as good as the ‘gold-standard’ of more invasive and not necessarily risk-free biopsy (assumption AUC=1.0). Hence, the null-hypothesis here was that a computer-extracted nodal feature gives no insight into the presence of metastasis, and the AUC value for each individual feature was compared to the baseline of random chance (AUC=0.5) through the estimation of the symmetrical 95% confidence interval of the AUC value as AUC ±1.96 standard error. The performance of all features used in conjunction with the neural net classifier was similarly assessed.
Results
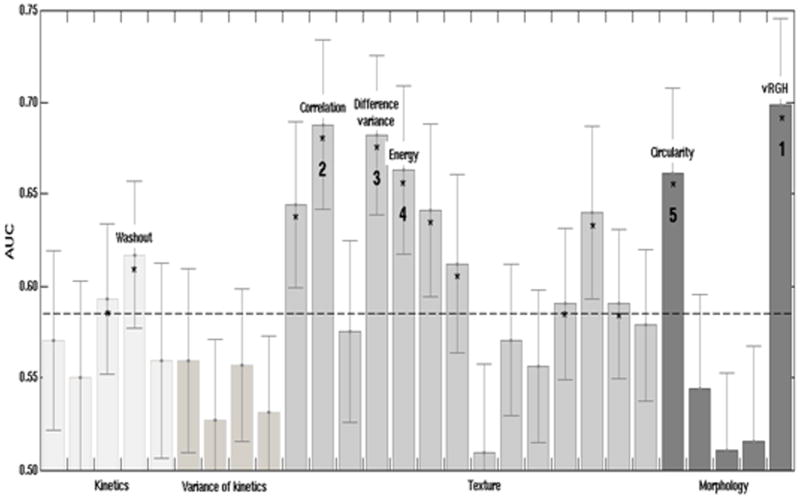
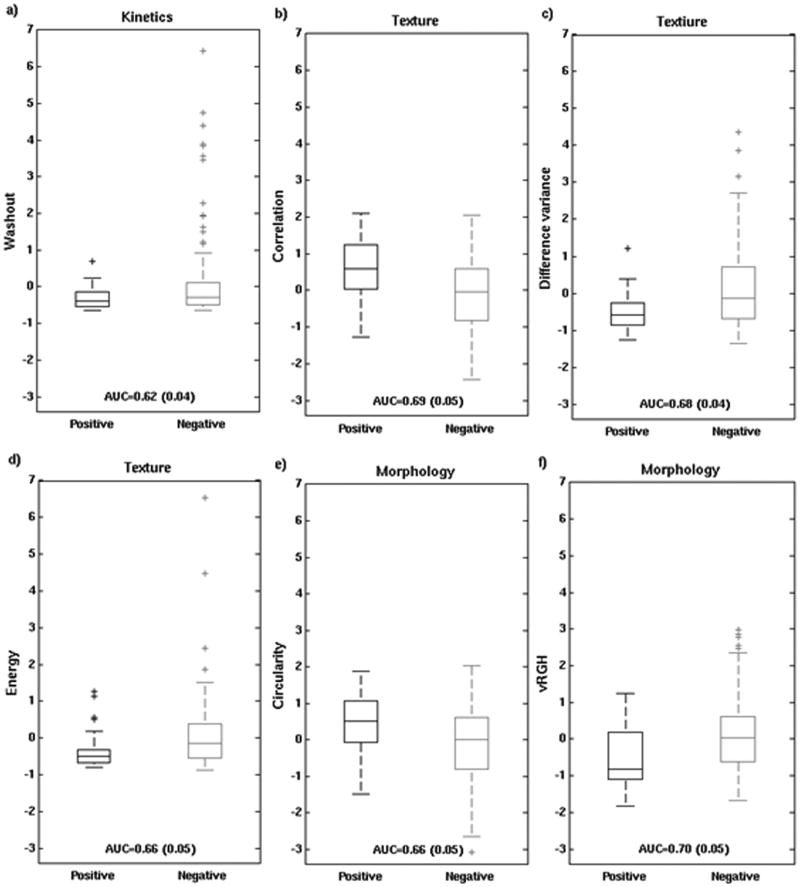
When each of the 28 features was analyzed individually, 13 features achieved performance substantially better than guessing (Figure 3). These 13 traits were 2 kinetic curve assessment, 9 enhancement texture, and 2 morphological features. The five best performing individual features, in order of decreasing AUC were: variance of radial gradient histogram (vRGH) (morphology), correlation (enhancement texture), difference in variance (enhancement texture), energy (enhancement texture), and circularity (morphology). Note that no kinetic curve assessment features were in this group of 5 best performing individual characteristics. Also note that the highest AUC for an individual characteristic of 0.70 (0.05) was obtained for a morphological feature that describes how well enhancing structures within a lesion extend from the center of a lesion outwards.
Figure 3.
AUC values for individual features in the task of distinguishing between nodes that were positive for metastasis and those that were negative (with error bars denoting ± standard error). The numbers indicate the order of the best performing 5 features, and features that individually achieved significantly better performance than a coin-toss are marked with an asterisk. The dashed line is a visual guide to separate those features from the ones that failed to outperform a coin-toss.
Feature values for the 5 features with the highest individual merit (as noted above) and for the best performing kinetic feature (washout) are shown with box plots and whiskers for positive and negative nodes (Figure 4). Based on this analysis, positive nodes were more likely to have: increased variance of radial gradient histogram (increase in radially outward enhancement patterns), increased circularity, decreased energy (less homogeneous appearance), decreased difference in variance (less variation in the difference in gray levels between voxel pairs), increased correlation (larger image linearity), and decreased washout (kinetic curve assessment).
Figure 4.
Box plots of feature values for positive and negative nodes (after standardization to zero mean and unit standard deviation for the entire dataset): a) the most discriminatory kinetic feature (washout), and the 5 best performing features, i.e., 3 textural (b-d) and 2 morphological (e-f). On each box, the central mark is the median, the edges of the box are the 25th and 75th percentiles, the whiskers extend to the most extreme data points not considered outliers, and outliers are plotted individually.
The use of all lymph node characteristics combined in leave-one-case-out cross-validation considerably improved performance compared to the performance of any individual feature on its own, yielding AUC=0.88 (standard error 0.03 and estimated 95% confidence interval [0.82; 0.94]) (Figure 5). Note that the best performing individual feature, as discussed above, obtained AUC = 0.70.
Figure 5.
ROC curve for the MCMC-BNN classifier in the task of distinguishing between nodes that were positive for metastasis and those that were negative for metastasis (leave-one-case-out cross-validation).
Discussion
The results of this study, though preliminary in scope, show how quantitative methods that had previously been applied to breast lesions could also be applied to axillary lymph nodes in newly diagnosed cancer patients. The results showed that several individual features, and also the combination of all studied lymph node characteristics could be used to assess lymph nodes. The majority of features that achieved performance better than guessing were textural features. This could be due to the inherent differences at the cellular level that occur in metastatic versus benign lymph nodes and the resultant MRI signal changes. Not surprisingly, several morphological features also performed well. For example, the morphology descriptor of circularity is generally higher in positive nodes. This result is concordant with the typical imaging appearance of metastatic nodes, which tend to be rounder and less reniform. Kinetic features, in general, showed less performance in distinguishing between the positive and negative lymph nodes. It is well known that even normal axillary lymph nodes can display typically malignant patterns of rapid uptake and washout kinetics. And therefore it is not unexpected that there were many outlier negative lymph nodes that demonstrated significant washout (Figure 4 a). The finding of a significantly higher AUC value with the utilization of all characteristics, by merging with a classifier, is important because it highlights the potential clinical utility of this work. By using the combination of all selected computer-extracted lymph node characteristics, a high AUC was obtained.
This study has several limitations. First, the MRI images analyzed in this study represent only those from dynamic contrast enhancement (DCE) MRI protocols. QIA on primary breast tumors has demonstrated improved performance in distinguishing between malignant and benign lesions with the incorporation of QIA on the T2 weighted images [16]. Future studies of axillary node QIA could incorporate images from an additional sequence, such as the T2 images. Similarly, if QIA could also incorporate multi-modality information, the utility might be further improved.
Another limitation is that the results presented here might be affected by the relatively small and unbalanced data set. Because of the modest size of the data set, we did not extensively investigate different feature selection protocols to improve performance, since such an approach would likely result in database bias, i.e., in a too optimistic performance assessment and a lack of generalize-ability. The single leave-one-case-out cross-validation presented here provided a more realistic evaluation. A similar study with a larger and more balanced set of lymph nodes, however, may have some effect on the characteristics that were seen to be most influential in determining lymph node status, and thus further studies are planned. In addition, inclusion of more lymph-node specific features, such as cortical thickness, may lead to further improvements as well. A third limitation is a level of ambiguity in the ‘gold standard’ due to the difficult task of identifying which lymph nodes were biopsied or dissected and of matching the pathology to the imaged nodes.
Staging the axilla has recently been a topic of much research, discussion and debate. The publication and implementation of the ACOSOG Z 0011 study [17] has led to changes in the imaging work up of many breast cancer patients at this institution. Specifically, axillary ultrasound is being used much less frequently. Prior to Z 0011, every newly diagnosed cancer patient would undergo an axillary ultrasound in the search for a suspicious lymph node. If a suspicious node was found and biopsy proven malignant, then surgeons would proceed directly to complete axillary dissection at the time of breast surgery. However, this paradigm is no longer used in light of Z 0011, which showed no survival benefit to more extensive axillary surgery, even with positive sentinel nodes (up to two). Now patients with small breast cancers (T1 or T2) usually only have a sentinel lymph node biopsy (rather than a complete axillary dissection) even when the sentinel node is positive. As a result, the rate of staging axillary ultrasound and ultrasound guided axillary biopsy has significantly decreased.
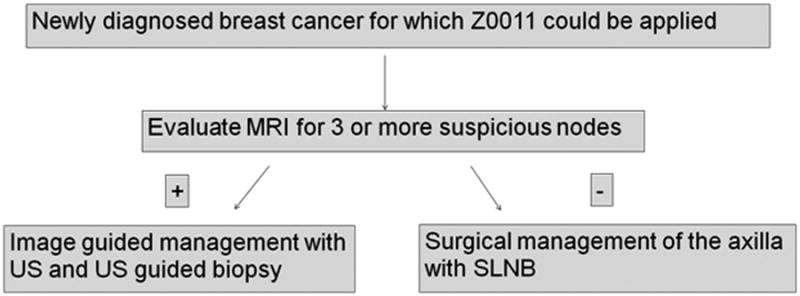
In institutions where axillary ultrasound is being used less frequently, MRI may become more important for providing imaging staging of the axilla. While the results presented here are preliminary in nature, it is possible that a new paradigm could depend on MRI with quantitative analysis to provide the initial staging view of the axilla, and if there are multiple suspicious lymph nodes (suggesting at least 3 positive nodes, and therefore suggesting exclusion from Z 0011 criteria) then further work-up with axillary ultrasound and axillary ultrasound guided biopsy could be performed (Figure 6). Given this potential new framework, gaining the most information from the MRI images of the axilla is critical, and further development of QIA methods of evaluating the axilla could increase the diagnostic utility and prognostic value of staging MRI.
Figure 6. Imaging work-up of the axilla of newly diagnosed T1 or T2 breast cancer in the Z0011 era.
Quantitative image analysis showed promise in evaluating axillary lymph nodes.
13 of 28 features performed better than guessing at metastatic status.
When all features were used in together, a considerably higher AUC was obtained.
Acknowledgments
This work was supported in part by Department of Energy grant DE-FG02-08ER6478, National Institute of Health grants NIH P50-CA125183 and NIH S10 RR021039.
Footnotes
Conflict of interests: M.L.G. is a stockholder in R2 Technology/Hologic and receives royalties from Hologic, GE Medical Systems, MEDIAN Technologies, Riverain Medical, Mitsubishi and Toshiba. MLG is a co-founder of and stockholder in Quantitative Insights. K.D. received royalties from Hologic. It is the University of Chicago Conflict of Interest Policy that investigators disclose publicly actual or potential significant financial interest that would reasonably appear to be directly and significantly affected by the research activities.
Publisher's Disclaimer: This is a PDF file of an unedited manuscript that has been accepted for publication. As a service to our customers we are providing this early version of the manuscript. The manuscript will undergo copyediting, typesetting, and review of the resulting proof before it is published in its final citable form. Please note that during the production process errors may be discovered which could affect the content, and all legal disclaimers that apply to the journal pertain.
References
- 1.Lehman C, Gatsonis C, Kuhl C, Hendrick RE, Pisano ED, Hanna L, et al. MRI evaluation of the contralateral breast in women with recently diagnosed breast cancer. N Engl J Med. 2007;356(13):1295–1303. doi: 10.1056/NEJMoa065447. [DOI] [PubMed] [Google Scholar]
- 2.Doi K, Giger ML, Nishikawa RM, Schmidt RA. Computer-aided diagnosis of breast cancer on mammograms. Breast Cancer. 1997 Dec 25;4(4):228–233. doi: 10.1007/BF02966511. [DOI] [PubMed] [Google Scholar]
- 3.Hylton NM, Blume JD, Bernreuter WK, Pisano ED, Rosen MA, Morris EA, et al. Locally advanced breast cancer: MR imaging for prediction of response to neoadjuvant chemotherapy—results from ACRIN 6657/I-SPY trial. Radiology. 2012 Jun;263(3):663–72. doi: 10.1148/radiol.12110748. [DOI] [PMC free article] [PubMed] [Google Scholar]
- 4.Bhooshan N, Giger M, Edwards D, Yuan Y, Jansen S, Li H, et al. Computerized three-class classifications of MRI-based prognostic markers for breast cancer. Phys Med Biol. 2011 Sep 21;56(18):5995–6008. doi: 10.1088/0031-9155/56/18/014. [DOI] [PMC free article] [PubMed] [Google Scholar]
- 5.Bhooshan N, Giger M, Jansen S, Li H, Lan L, Newstead G. Cancerous breast lesions on DCE-MRI: computerized characterization for image-based prognostic markers. Radiology. 2010 Mar;254(3):680–690. doi: 10.1148/radiol.09090838. [DOI] [PMC free article] [PubMed] [Google Scholar]
- 6.Chen W, Giger ML, Li H, Bick U, Newstead G. Volumetric texture analysis of breast lesions on contrast-enhanced magnetic resonance images. Magn Reson Med. 2007;58:562–571. doi: 10.1002/mrm.21347. [DOI] [PubMed] [Google Scholar]
- 7.Chen W, Giger ML, Li H, Bick U, Newstead G. Automatic identification and classification of characteristic kinetic curves of breast lesions on DCE-MRI. Med Phys. 2006 Aug;33(8):2878–2887. doi: 10.1118/1.2210568. [DOI] [PubMed] [Google Scholar]
- 8.Chen W, Giger ML, Lan L, Bick U. Computerized interpretation of breast MRI: investigation of enhancement –variance dynamics. Med Phys. 2004 May;31(5):1076–1082. doi: 10.1118/1.1695652. [DOI] [PubMed] [Google Scholar]
- 9.Shimauchi A, Giger ML, Bhooshan N, Lan L, Pesce LL, Lee JK, et al. Evaluation of clinical breast MR imaging performed with prototype computer-aided diagnosis breast MR imaging workstation: reader study. Radiology. 2011 Mar;258(3):696–704. doi: 10.1148/radiol.10100409. [DOI] [PubMed] [Google Scholar]
- 10.Bhooshan N, Giger ML, Edwards D, Yuan Y, Jansen S, Li H, et al. Computerized three-class classification of MRI-based prognostic markers for breast cancer. Phys Med Biol. 2011 Sep 21;56(18):5995–6008. doi: 10.1088/0031-9155/56/18/014. [DOI] [PMC free article] [PubMed] [Google Scholar]
- 11.Chen W, Giger ML, Bick U. A fuzzy c-means (FCM)-based approach for computerized segmentation of breast lesions in dynamic contrast-enhanced MRI images. Acad Radiol. 2006;13(1):63–72. doi: 10.1016/j.acra.2005.08.035. [DOI] [PubMed] [Google Scholar]
- 12.Cronin B, Stevenson IH, Sur M, Kording KP. Hierarchical Bayesian modeling and Markov chain Monte Carlo sampling for tuning-curve analysis. J Neurophysiol. 2010;103(1):591–602. doi: 10.1152/jn.00379.2009. [DOI] [PMC free article] [PubMed] [Google Scholar]
- 13.Chen W, Giger ML, Newstead G, Bick U, Jansen S, Li H, Li L. Computerized assessment of breast lesion malignancy using DCE-MRI: robustness study on two independent clinical datasets from two manufacturers. Acad Radiol. 2010 Jul;17(7):822–829. doi: 10.1016/j.acra.2010.03.007. [DOI] [PMC free article] [PubMed] [Google Scholar]
- 14.Pesce LL, Metz CE. Reliable and computationally efficient maximum-likelihood estimation of “proper” binormal ROC curves. Acad Radiol. 2007 Jul;14(7):814–829. doi: 10.1016/j.acra.2007.03.012. [DOI] [PMC free article] [PubMed] [Google Scholar]
- 15.Metz CE. Basic principles of ROC analysis. Semin Nucl Med. 1978 Oct;8(4):283–298. doi: 10.1016/s0001-2998(78)80014-2. [DOI] [PubMed] [Google Scholar]
- 16.Bhooshan N, Giger ML, Lan L, Li H, Marquez A, Shimauchi, Newstead G. Combined use of T2-weighted MRI and T1-weighted dynamic contrast-enhanced MRI in the automated analysis of breast lesions. Magn Reson Med. 2011;66:555–563. doi: 10.1002/mrm.22800. [DOI] [PMC free article] [PubMed] [Google Scholar]
- 17.Guiliano AE, Hunt KK, Ballman KV, Beitsch PD, Whitworth PE, Blumencranz PW, et al. Axillary dissection vs no axillary dissection in women with invasive breast cancer and sentinel node metastasis: a randomized clinical trial. JAMA. 2011 Feb 9;305(6):569–575. doi: 10.1001/jama.2011.90. [DOI] [PMC free article] [PubMed] [Google Scholar]


