

Abstract
Objectives:
We investigated artefacts caused from orthodontic appliances at 1.5-T MRI of the head and neck region and whether the image quality can be improved utilizing the artefact-minimizing sequence WARP.
Methods:
In vitro tests were performed by phantom measurements of different orthodontic devices applying different types of MR sequences [echoplanar imaging (EPI), turbo spin echo (TSE) and TSE-WARP, gradient echo (GRE)]. Two independent readers determined after calibration the level of artefacts. Subsequently, the interobserver agreement was calculated. The measurement of artefacts was based on the American Society for Testing Materials Standard F 2119-07. For in vivo imaging, one test person was scanned with an inserted multibracket appliance. The level of artefacts for 27 target regions was evaluated.
Results:
In vitro: ceramic brackets and ferromagnetic steel brackets produced artefact radii up to 1.12 and 7.40 cm, respectively. WARP reduced these artefacts by an average of 32.7%. The Bland–Altman-Plot indicated that maximum measurement differences of 3 mm have to be expected with two calibrated observers. In vivo: the EPI sequence for brain imaging was not analysable. The TSE sequence of the brain did not demonstrate artefacts except for the nasal cavity. Conversely, the TSE sequence of the cervical spine revealed severe artefacts in the midface region. The GRE sequence appeared to be more susceptible to artefacts than did the TSE sequence.
Conclusions:
In vitro measurements allow an estimation of the in vivo artefact size. Orthodontic appliances may often remain intraorally when performing MRI. WARP showed a more significant effect in vitro than in vivo.
Keywords: MRI, orthodontic appliances, brackets, artefacts, phantoms
Introduction
Most of the clinically relevant susceptibility artefacts in the head region are caused by fixed orthodontic appliances.1 These are often made from ferromagnetic steel grades. Prior to MRI examination of patients with such devices, radiologists are confronted with a critical question: should the appliance be removed, since it might consist of ferromagnetic alloy? General risks such as acceleration and torsion have hardly any impact on adequately fixed attachments. Sung et al2 found debonding forces of 61–104 N in different bracket materials. However, a complete orthodontic appliance consisting of 28 steel brackets, ligature wires and 2 arch wires only experiences very weak forces of approximately 1.69 N when exposed to a strong magnetic field of 3 T.3 Furthermore, no clinically relevant heating occurs in these products.4,5
However, extensive susceptibility artefacts must be taken into consideration. These artefacts may—depending on the type of MR sequence applied—affect diagnostic accuracy in the regions of the mouth, pharynx, temporomandibular joint and cervical spine.6–8
Brackets and wires comprising dia- and paramagnetic materials such as ceramic, nickel–titanium (Ni-Ti) alloys and austenitic steels that can remain intraorally are also available. Owing to a very low magnetic susceptibility, these materials only generate insignificant artefacts. Removal of the appliance is always very time and cost consuming and is associated with an alteration of the enamel. Conventional carbide burs may further cause enamel abrasion and periodic enamel damage.9 Thus, it needs to be clarified whether removal of the appliance is necessary for achieving a diagnostic MR scan.
Owing to a variety of manufacturers and commercially available alloys, various recent studies investigating the level of artefacts caused by orthodontic devices fail to provide a useful guideline for clinical practice. So called magnetic tests determining the adherence of a small, light mini magnet with strong magnetic flux density to a device are used to predict artefacts to date: when the magnet (licensed for intraoral use) attaches to a ferromagnetic device, artefacts expanding the appliance will occur. This test, however, is limited since artefacts might still appear despite the magnet not attaching.8 Artefacts can already be observed at a susceptibility slightly >0.01, whereas a notable adherence of the magnet does not occur until higher susceptibility levels are reached.10 There are no obligations to declare the magnetic properties or the susceptibility to artefacts of orthodontic appliances at present. Thus, in unclear cases, the radiologist will potentially suggest the removal of the appliance. Sequence modifications reducing susceptibility artefacts would be a welcome alternative in order to improve MRI image quality.
This study was prompted by a case of a 14-year-old girl wearing orthodontic appliances in the mandible and the maxilla who had to be examined by MRI to identify potential tumour growth in the mandible. The appliances caused major artefacts when using the turbo spin echo (TSE) sequence making evaluation of the viscerocranium impossible. The devices had to be removed completely and the MRI examination was repeated. This particular case may have further encouraged radiologists to suggest the removal of orthodontic device prior to MRI examination. However, this might not always be necessary. Therefore, we investigate the level of artefacts of different orthodontic appliances.
The aims of this study were:
– in vitro: phantom measurement of experimentally obtained artefacts around different orthodontic objects and evaluation of a potential artefact-reducing MRI sequence technique
– in vivo (test volunteer): examination of which anatomical structures of the head and neck region were affected by the artefacts caused by orthodontic appliances
– investigation of the conditions and sequences that allow for keeping the orthodontic appliances
– to evaluate whether phantom artefact measurements can estimate the extent of clinically relevant in vivo artefacts.
Methods and materials
Orthodontic appliances
For in vitro simulation of the case mentioned above, seven orthodontic attachments, two orthodontic wires provided by 3M Unitek GmbH (Landsberg, Germany) and one ligature wire (Dentaurum GmbH & Co. KG, Ispringen, Germany) were used (Table 1). They can be divided into three categories:
(1) Single attachments (brackets, tubes) comprising slots for insertion of a wire that are attached to a tooth using adhesive composite. These attachments can be made of different materials.
(2) Wires serve to transfer orthodontic forces to the teeth.
(3) Ligatures (very thin steel wires) are utilized to attach the therapeutic arch wire in case no self-ligating brackets or rubber ligatures are used. Table 1 shows to which specimen a small neodymium–iron–boron magnet attaches, indicating the ferromagnetic character of different specimens.
Table 1.
Specimen and parameters
| Code | Product description | Alloy according to AISI (DIN) structure |
Weight (g) | Size (mm) D, H |
“Magnet test” Magfit® DX 800, m = 0.16 g/F = 6.5 N |
|---|---|---|---|---|---|
| UK1 | SmartClip™, first molar (3004-7033) | Steel 630 (17-4 PH) martensitic |
0.1078 | D = 5.0, H = 2.0 | Holds |
| UK2 | APC™ II Adhesive Coated Appliance, Victory Tube, 6er (3067-9613) | Steel 316L (17-13-2) austenitic |
0.1875 | D = 6.3, H = 3.0 | Holds |
| UK3 | APC II Adhesive Coated Appliance System, Victory Tube, first molar (3067-9604) | Steel 316L (17-13-2) austenitic |
0.1850 | D = 6.3, H = 3.0 | Holds |
| UK4 | APC II Adhesive Coated Appliance, Victory Tube, second molar (3067-9154) | Steel 316L (17-13-2) austenitic |
0.1096 | D = 5.0, H = 2.0 | Holds |
| UK5 | APC II Adhesive Coated Appliance, Victory Tube, second molar (3067-9163) | Steel 316L (17-13-2) austenitic |
0.1072 | D = 5.0, H = 2.0 | Holds |
| UK6 | Nitinol heat-activated 0.019 × 0.025-inch (4297-920) wire | 55/45 Ni-Ti | 0.3135 | 0.48 × 0.64 | Does not hold |
| OK1 | APC II Adhesive Coated Appliance, Clarity™ SL, canine (3007-406) | Aluminum oxide–ceramic, Ni-Ti, Steel 316 (17-12-2) austenitic |
0.0956 | D = 5.0 , H = 3.0 | Does not hold |
| OK2 | APC II Adhesive Coated Appliance, Victory Tube, first molar (3068-9511) | Steel 316L (17-13-2) austenitic |
0.1585 | D = 6.0, H = 2.5 | Holds |
| OK3 | Stainless steel arch wire 0.46 mm; resilient OrthoForm™ III Ovoid, wire | Steel 304 (V2A) austenitic |
0.2395 | D = 0.46 | Holds |
| Lig | Remanium® ligature (500-025-00) wire | AISI 316 L (17-13-2) austenitic |
0.0126 | D = 0.25 | Does not hold |
AISI, American Iron and Steel Institute; D, diameter; H, height; Lig, ligature wire; Ni-Ti, nickel–titanium.
UK1 to OK3 obtained from Unitek GmbH (Landsberg, Germany); ligature wire obtained from Dentaurum GmbH & Co. KG (Ispringen, Germany).
Magfit® obtained from AICHI steel corporation, Tokai City, Japan.
MRI
All MR measurements were performed using a 1.5-T MR system with a maximum gradient amplitude of 33 mT m−1 and a maximum slew rate of 125 mT m−1 ms−1 (MAGNETOM® Aera; Siemens Healthcare, Erlangen, Germany). The main magnetic field is oriented along the z-axis. For the in vitro study, the built-in whole-body coil was used as receive-coil to account for the heterogeneity of coil sensitivity profiles of multichannel surface coils. The in vivo study was performed with a 20-channel head coil and a 4-channel neck coil. Clinically relevant sequences for diagnostic purpose of the head and neck region were applied. The artefact minimizing sequence technique (syngo® WARP; Siemens Healthcare) comprises different techniques to reduce susceptibility artefacts, such as high-bandwidth protocol, high-bandwidth optimized radiofrequency pulses and high-readout bandwidth. On the available MR system, it can be applied to TSE and short tau inversion recovery-TSE sequences.
In vitro measurement
The orthodontic appliances were analysed in a chambered, cuboidal polymethylmethacrylate (PMMA) phantom (size, 400 × 300 × 300 mm), filled with cupric sulfate solution (1–2 g l−1) to reduce the T1 relaxation time and to maintain a reasonable repetition time (TR) level (Figure 1). The phantom is permeated by 11 6.4-mm-thick inflated PMMA dividers comprising a cavity of diameter (d) = 5 mm. On the MRI images, the dividers have a distance of 20 mm. It results from 18-mm distance between the fixtures and a mechanical tolerance of 2 mm.8
Figure 1.

The structured phantom. PMMA, polymethylmethacrylate.
Phantom measurements without orthodontic appliances in coronal and sagittal orientation lead to a typical stripe pattern. In contrast to a phantom with amorphous filling, the chambered model allows the imaging of distortion. The middle PMMA divider contains the fixation for the orthodontic appliances. The samples were placed in the centre of the panel and fixed with instant adhesive. The central position of the specimen ensures the maximum field homogeneity. For exact localization of the specimen centre on the MR images, 10-mm Plexiglas® bars were integrated with a distance of 12 cm in all three planes (Figure 2). They further serve as a reference for the calibration of the measuring tools. Subsequently to the blank measurement, every test specimen was scanned with a TSE sequence run with and without the artefact-minimizing algorithm, and a gradient echo (GRE) sequence. The imaging parameters were as follows:
Figure 2.

Localization of the centre of the orthodontic attachments on the basis of three orthogonal reference bars.
T1 weighted GRE sequence (fast low-angle shot)
Slice thickness, 5.0 mm; distance factor, 30%
Voxel size, 2.73 × 1.37 × 5.00 mm
TR, 100 ms; echo time (TE), 3.25 ms
Flip angle, 90°
Bandwidth, 380 Hz per pixel
Number of excitations (NEX), one
T2 weighted TSE sequence
Slice thickness, 5.0 mm; distance factor, 30%
Voxel size, 2.73 × 1.37 × 5.00 mm
TR, 8550 ms; TE, 61 ms
Flip angle, 150°
Bandwidth, 199 Hz per pixel
Turbo factor (echo train lengths), 20
NEX, one
T2 weighted TSE sequence with artefact minimizing technique (WARP)
Slice thickness, 5.0 mm; distance factor, 30%
Voxel size, 2.73 × 1.37 × 5.00 mm
TR, 8550 ms; TE, 63 ms
Flip angle, 150°
Bandwidth, 751 Hz per pixel
Turbo factor (echo train lengths), 17
NEX, one
The test series referred to the American Society for Testing Materials standard F2119-0711 for artefact determination around passive implants. This standardization requires imaging of irregular-formed devices such as hip prostheses in three orthogonal planes. The orthodontic appliances used in this study are very small and relatively symmetric and were therefore considered as small cylinders. Coronal and sagittal sections were acquired. Wires and ligatures were examined in three sectional planes and analysed separately.
To date, no dedicated software is available that is routinely applicable to evaluate artefact quality and quantity. There are various reasons for that:
– Defining the signal loss area is not always possible as it becomes indistinct in the periphery.
– Signal amplification is often seen at the margin of the signal loss area. This occurs when the disturbing gradient equals the resonance frequency of the local tissue.12
– Additional image distortions and signal variations appear owing to a susceptibility gradient between adjacent tissues resulting in magnetic field inhomogeneity.12
In the present study, we determined the signal loss and signal amplification using the freely available digital imaging and communications in medicine (DICOM) viewer “MicroDicom” (MicroDicom, Sofia, Bulgaria). The used brackets have a maximum size of 6.3 × 3.0 mm2, they contain several slots and the wires are curved to fit into the jaw. Thus, the American Society for Testing Materials standard F2119-07 that is normally used for larger solid implants (e.g. hip and knee) does not need to be applied here. F2119-07 requires the measurement of the “longest distance between the margin of the implant and the margin of the resulting artefact”. Discrimination between the small central shadow produced by orthodontic attachments and their resulting artefacts is not appropriate. Furthermore, the radii of the attachments (Table 1) are similar to the measurement uncertainty.
Measurement of small objects (radii)
The distance between the artefact-producing attachment and the anatomic structure that needs to be examined is of great importance for the radiologist. Thus, the centre of the specimen was determined using reference bars and the maximum distance to the artefact periphery was measured (Figure 3). Additional distortions were indicated by the number of deformed images of the phantom dividers. To estimate the expansion of the distortion, the following rule was applied: when two panels are affected, this area has a minimal width of 30 mm (thickness of two panels + the distance between the panels). Thus, the distortion area increases by at least 25 mm with every additionally affected panel.
Figure 3.

Method of measurement: orthodontic attachments. Rmax, maximum radius.
Measurement of the wires (diameter)
The parabolic arch wires UK6 and OK3 and loop-shaped wire ligature are considered as a special case, as they do not possess a singular object centre generating three different evaluation methods:8
– The wire is clearly visible and surrounded by a tubular artefact. In coronal sections of U-shaped wires, two artefact areas of equal size are detected; their diameter was determined (Figure 4). Measuring the sagittal plane is not necessary since the area of the bow-shaped wire will only be imaged at its vertex. Imaging of frontal sections only served for clear illustration of the artefacts and can be omitted as well.
– The wire or an artefact is not detectable in any of the coronal sections. No further sections are needed.
– The artefacts of the two legs of the wire merge owing to their large size. The diameter of the total artefact was determined (Figure 5).
Figure 4.

Method of measurement: orthodontic wires with separate artefacts. Dmax, maximum diameter.
Figure 5.

Method of measurement: orthodontic wires with confluent artefacts. Dmax, maximum diameter.
Two observers independently measured the in vitro artefacts after a pilot phase in which they were trained to perform exact and identical artefact measurements (calibration of the two readers). To investigate the effects of this pilot phase for further studies, we subsequently determined the interobserver agreement.
In vivo measurement
The original multibracket appliances for upper and lower jaws from the above-mentioned patient were cleaned and sterilized and attached vestibular to a PMMA splint fabricated for the test person. The 27-year-old female test person who volunteered for the in vivo experiment (after our institutional review board approved this in vivo test) was healthy, free of caries and was not supplied with metallic tooth restoration. The few composite and ceramic fillings present in the test person produce only minor artefacts7 not influencing the measurement. In addition to a localizer scan, the following five MR sequences, which are representative for neurocranial and cervical spine imaging, were acquired:
T2 weighted TSE sequence of the neurocranium
Slice thickness, 5.0 mm (transverse orientation)
Distance factor, 30%
Voxel size, 0.96 × 0.72 × 5.00 mm
TR, 4500 ms; TE, 92 ms
Flip angle, 150°
Bandwidth, 191 Hz per pixel
Turbo factor (echo train lengths), 20
NEX, one
Spin echo SE echoplanar imaging (SE-EPI) sequence of the neurocranium
Slice thickness, 6.0 mm (transverse orientation)
Distance factor, 30%
Voxel size, 1.5 × 1.2 × 6.0 mm
TR, 4500 ms; TE, 113 ms
EPI factor (echo train lengths), 154
Bandwidth, 814 Hz per pixel
NEX, one
T1 weighted GRE sequence of the neurocranium
Slice thickness, 5.0 mm (transverse orientation)
Distance factor, 30%
Voxel size, 1.11 × 0.90 × 5.00 mm
TR, 366 ms; TE, 4.8 ms
Flip angle, 90°
Bandwidth, 150 Hz per pixel
NEX, one
T2 weighted TSE sequence of the cervical spine
Slice thickness, 3.0 mm (sagittal orientation)
Distance factor, 30%
Voxel angle, 1.12 × 0.90 × 3.00 mm
TR, 3000 ms; TE, 84 ms
Flip angle, 150°
Turbo factor (echo train lengths), 16
Bandwidth, 190 Hz per pixel
NEX, one
T2 weighted TSE sequence with artefact-minimizing technique (WARP)
Slice thickness, 3.0 mm (sagittal orientation)
Distance factor, 30%
Voxel size, 1.12 × 0.90 × 3.00 mm
TR, 3000 ms; TE, 84 ms
Flip angle, 150°
Turbo factor (echo train lengths), 17
Bandwidth, 651 Hz per pixel
NEX, one
Evaluation of the in vivo study was performed by a radiologist with 6 years' experience in the field of MRI. 27 typical target regions of the cranial–neck region were selected (Table 2). The level of artefacts in these pre-defined regions was scored on a five-point scale:
• (1) no artefacts
• (2) minimal artefacts, sequence is diagnostic
• (3) moderate artefacts, anatomy is still delineated, diagnostic quality is limited
• (4) severe artefacts, sequence is non diagnostic
• (X) structure is outside the field of view of the imaging sequence.
Table 2.
The level of artefacts in typical target regions of the cranial–neck region scored on a five-point scale
| Target regions | Applied sequences (at 1.5-T MRI) |
|||||||||
|---|---|---|---|---|---|---|---|---|---|---|
|
T2 weighted TSE transverse Neurocranium |
T1 weighted gradient echo transverse Neurocranium |
Echoplanar imaging trasverse Neurocranium |
T2 weighted TSE sagittal Cervical spine |
T2 weighted TSE-WARP sagittal Cervical spine |
||||||
| Without device | With device | Without device | With device | Without device | With device | Without device | With device | Without device | With device | |
| Frontal lobe | 1 | 1 | 1 | 2 | 1 | 4 | × | × | × | × |
| Parietal lobe | 1 | 1 | 1 | 1 | 1 | 2 | × | × | × | × |
| Occipital lobe | 1 | 1 | 1 | 1 | 1 | 1 | 1 | 1 | 1 | 1 |
| Temporal lobe | 1 | 1 | 1 | 2 | 1 | 4 | × | 1 | × | 1 |
| Thalamus | 1 | 1 | 1 | 2 | 1 | 4 | × | × | × | × |
| Pallidum | 1 | 1 | 1 | 2 | 1 | 4 | × | × | × | × |
| Pituitary gland | × | × | × | × | × | × | 1 | 1 | 1 | 1 |
| Mesencephalon | 1 | 1 | 1 | 1 | 1 | 4 | 1 | 1 | 1 | 1 |
| Cerebellum | 1 | 1 | 1 | 1 | 1 | 4 | 1 | 1 | 1 | 1 |
| Pons | 1 | 1 | 1 | 1 | 1 | 4 | 1 | 1 | 1 | 1 |
| Medulla oblongata | 1 | 1 | 1 | 3 | 1 | 4 | 1 | 1 | 1 | 1 |
| Medulla spinalis | × | × | × | × | × | × | 1 | 1 | 1 | 1 |
| Lingua | × | × | × | × | × | × | 1 | 4 | 1 | 4 |
| Orbita | 1 | 2 | 1 | 4 | 1 | 4 | × | × | × | × |
| Nasal cavity | 1 | 4 | 1 | 4 | 1 | 4 | 1 | 4 | 1 | 4 |
| Frontal sinus | 1 | 1 | 1 | 4 | 1 | 4 | × | × | × | × |
| Maxillary sinus | × | × | × | × | × | × | 1 | 4 | 1 | 4 |
| Ethmoid sinus | 1 | 1 | 1 | 4 | 1 | 4 | 1 | 4 | 1 | 4 |
| Sphenoid sinus | 1 | 2 | 1 | 4 | 1 | 4 | 1 | 2 | 1 | 1 |
| Temporomandibular joint | 1 | 1 | 1 | 2 | 1 | 4 | × | × | × | × |
| Atlas | × | × | × | × | × | × | 1 | 1 | 1 | 1 |
| Axis | × | × | × | × | × | × | 1 | 1 | 1 | 1 |
| Cervical vertebra 3-7 | × | × | × | × | × | × | 1 | 1 | 1 | 1 |
| Nasopharynx | × | × | × | × | × | × | 1 | 2 | 1 | 1 |
| Oropharynx | × | × | × | × | × | × | 1 | 2 | 1 | 1 |
| Laryngopharynx | × | × | × | × | × | × | 1 | 1 | 1 | 1 |
| Larynx with epiglottis | × | × | × | × | × | × | 1 | 1 | 1 | 1 |
×, structure is outside the field of view of the imaging sequence; 1, no artefact; 2, minimal artefact, sequence is diagnostic; 3, moderate artefacts, anatomy is still delineated, diagnostic quality is limited; 4, severe artefacts, sequence is non-diagnostic; TSE, turbo spin echo.
Statistic evaluation
All statistical analyses were performed using the SPSS® Statistics software v. 22 (IBM Deutschland GmbH, Ehningen, Germany). In vitro measurements were performed independently by two observers. Differences between the two were tabulated with a Bland–Altman-Plot. In addition, the Pearson correlation coefficient was calculated. The rater bias was determined using a paired t-test. p ≤ 0.05 was considered statistically significant. Intraobserver reliability was not measured since the agreement of one observer with him/herself can be considered higher in comparison with two independent observers. The Student's t-test was applied to evaluate the reduction of artefacts by the artefact-minimizing sequence.
Results
In vitro evaluation
Table 3 shows the results of the in vitro measurements in coronal and sagittal sections.
Ceramic: ceramic produced no relevant artefacts >1.1 cm.
Steel: the metal brackets comprising steel American Iron and Steel Institute (AISI) 630 and AISI 316L produced artefacts between 4.4 and 7.4 cm. The two legs of the steel wire (OK3) produced artefacts that merged to a total artefact with a maximum diameter of 14.4 cm.
Ni-Ti: the Ni-Ti wire (UK6) caused a tubular artefact with a diameter of only 1.3 cm.
Table 3.
Artefact size, mean values of measurements from Raters 1 and 2
| Codes (Table 1) | Artefact radius (mm) |
|||||
|---|---|---|---|---|---|---|
| Brackets | GRE–coronal | GRE–sagittal | TSE–coronal | TSE–sagittal | TSE–coronal; syngo® WARP | TSE–sagittal; syngo WARP |
| UK1 | 63.53 (5) | 73.0 (0) | 63.78 (5) | 73.62 (5) | 41.91 (4) | 44.81 (4) |
| UK2 | 59.3 (5) | 73.01 (0) | 63.79 (5) | 69.13 (6) | 46.5 (4) | 43.33 (4) |
| UK3 | 56.61 (5) | 73.2 (0) | 60.74 (5) | 67.79 (5) | 37.09 (3) | 46.08 (4) |
| UK4 | 54.61 (4) | 70.05 (0) | 43.19 (5) | 56.05 (5) | 34.14 (3) | 35.91 (3) |
| UK5 | 47.93 (3) | 69.75 (0) | 43.22 (5) | 53.86 (4) | 32.31 (3) | 36.52 (3) |
| OK1 | 11.2 (0) | 9.73 (0) | 8.34 (0) | None (0) | None (0) | None (0) |
| OK2 | 55.0 (4) | 72.45 (0) | 55.02 (5) | 66.26 (5) | 38.75 (3) | 40.31 (3) |
| Wires and ligatures | Artefact diameter (mm) |
|||||
|---|---|---|---|---|---|---|
| GRE–coronal | GRE–sagittal | TSE–coronal | TSE–sagittal | TSE–coronal; syngo WARP | TSE–sagittal; syngo WARP | |
| UK6 | 12.83 (0) | Not applicable | 10.36 (0) | Not applicable | 8.95 (0) | Not applicable |
| OK3 | 143.58 (4) | Not applicable | 132.55 (5) | Not applicable | 117.49 (3) | Not applicable |
| Lig | 12.68 (0) | Not applicable | 13.4 (0) | Not applicable | 6.09 (0) | Not applicable |
GRE, gradient echo; TSE, turbo spin echo.
syngo® WARP obtained from Siemens Healthcare, Erlangen, Germany.
The values given in parentheses are number of distorted panels: 2 ≙ 30 mm; 3 ≙ 55 mm; 4 ≙ 80 mm; 5 ≙ 105 mm; 6 ≙ 130 mm.
The artefact-minimizing sequence reduced the level of artefacts by an average 32.7 ± 5.97% (95% confidence interval, 28.86–36.45%). The artefact reduction effect was more pronounced for the sagittal acquisition (35.96%) compared with the coronal acquisition (29.35%). These artefacts disappeared completely when applying the artefact-minimizing sequence to the ceramic bracket. This reduction was statistically significant (t-test; p < 0.01). With the GRE sequence, distortions were detected only in coronal sections of the phantom, and in both sections when using the TSE sequence.
In vivo evaluation
Almost all in vivo images with and without orthodontic appliance (Table 2) were classified into the categories 1, 2, 4 and ×. The EPI sequence turned out to be most susceptible to artefacts. The T2 weighted TSE sequence of the neurocranium was almost unaffected except for the nasal cavity. By contrast, when applying the T2 weighted TSE sequence to the cervical spine, nasal cavity, maxillary sinus, ethmoid sinus and lingua were severely covered by artefacts making delineation of the respective anatomical structures impossible. The artefact-minimizing sequence reduced the artefacts subjectively; however, this effect only occurred in regions with already minimal artefacts. Artefacts were also reduced at the concha nasalis, which was not visible when applying the T2 TSE sequence without artefact-minimizing algorithm. The GRE sequence appeared to be more susceptible to artefacts than did the TSE sequence with the orbita, nasal cavity and paranasal sinuses especially being affected. Distortions that occurred in the structured phantom were also detected in the test person, for example, in the regions of the orbita, pharynx and vertebral bodies.
Effects of the calibration on correlation and agreement of data
Calibration of the two observers permitted reaching a very high correlation. The Pearson correlation coefficient was r = 0.998 and considered significant (p < 0.01). However, we detected a rater bias. Results determined by Observer 1 were by an average 0.83 mm higher than the results determined by Observer 2, being highly significant with p < 0.001. Furthermore, the agreement of the data obtained by the two observers (interobserver agreement) was high following the calibration. The Bland–Altman-Plot indicated that maximum measurement differences of 3 mm have to be expected with two calibrated observers.
Discussion
In vitro study
We determined the maximum dimension of the different artefact types arising from the centre of the orthodontic attachment. Other studies have evaluated artefacts in two-10,13 or three-dimensions;14 however, without describing the individual form and orientation, these data are of limited use for the clinician since the artefacts usually do not show rotational symmetry. Especially in emergency indications, utilizing the expected distance between the device and the target region would be most relevant to evaluate whether removing the device is required. Artefact size can be classified in different categories, depending on the level of extinction and distortion.15 However, categories such as artefacts <2, 3–5 or >5 cm are imprecise. Also indicating the artefact size on a millimetre range is inefficient for clinical use, since further inaccuracies have to be expected with this method; data obtained from a software-based measurement tool need to be evaluated by the user to define the border of the artefact zone. Here, we show that this subjective measuring inaccuracy can be minimized with extensive calibration. By contrast, a technical inaccuracy arising from slightly different starting points of the image series is inevitable owing to positioning of the phantom in the scanner. This is indicated by the PMMA reference bars; they are not equally cut in every series. Between two subsequent sections, a 1.5-mm layer is not detected owing to the distance factor of 30%. In cases where the maximum artefact dimension is located within this layer, the detected artefact will be slightly smaller. In the present study, this phenomenon occurred twice: the test specimens UK2 and UK3 have identical forms and alloys and, thus, should have caused identical artefacts. However, sample UK3 had its maximum expansion in the non-detectable region. The same effect was seen with sample UK5 compared with the identical sample UK4 in the GRE sequence in the coronal section. This resulted in measurement differences of 9.4 and 6.7 mm, respectively. In cases of an emergency, the artefacts should be predicted conservatively to define a worst-case scenario that can be used to decide whether to remove the objects or not. For this aim, indicating the distance in centimetres appears to be reasonable. Therefore, statistical calculations below this range become irrelevant. However, taking the maximum radius as a reference seems to produce conflicting results: we know from the literature that the susceptibility artefacts on GRE sequence are significantly larger than on TSE sequences.6,16 As expected, we saw this effect in our study when comparing the artefact area. However, based on the radii, the artefacts only show slight differences between GRE and TSE images (Table 2). The reason for that is additional signal amplifications in a certain distance from the device when using the less sensitive TSE sequence (Figures 6 and 7). Including these areas is a safe way to predict an artefact size making its three-dimensional orientation irrelevant.
Figure 6.
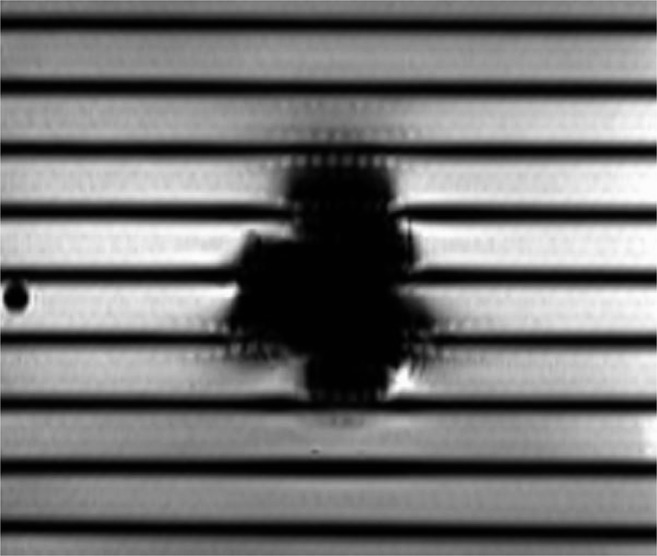
T1 weighted gradient echo (GRE) sequence, sagittal section: steel bracket (UK2). Signal loss areas are higher with GRE sequence. Peripheral signal variations like beads were detected. No distortions appeared on sagittal sections.
Figure 7.
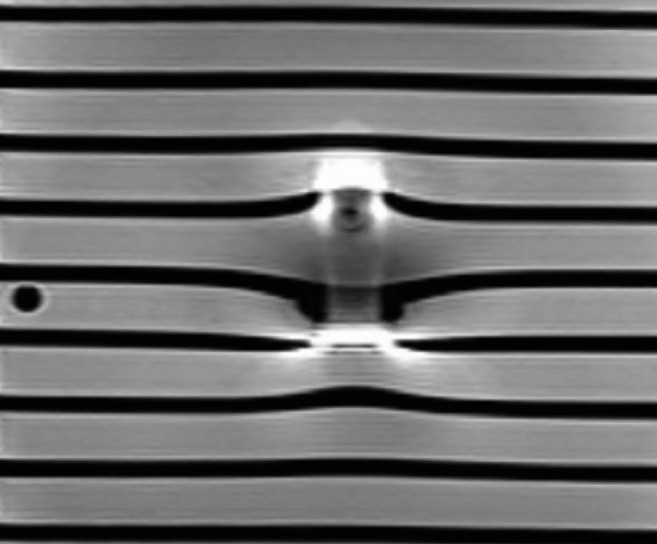
T2 weighted turbo spin echo sequence, sagittal section: steel bracket (UK2). The signal loss area is significantly smaller; however, additional signal amplifications and a central distortion area occur.
Evaluation of the distortion is not possible when using an amorphously filled phantom. Thus, in the present study we utilized the above-described air-filled panels. The number of deformed panels represents the expansion of the distortion area. Since the number of panels is limited, this area has to be considered as the “minimum distortion area”.
Comparability phantom—in vivo study
The in vitro-generated data and the diagnostic quality in the test person evaluated by an experienced observer are consistent. Thus, based on the data obtained from the phantom, a radiologist will be able to make the right decision for every diagnostic question in order to decide whether to remove the orthodontic appliance prior to the MRI examination or not. This was confirmed by the MR images.
To evaluate this question, the area closest to the target regions (neurocranium, cervical spine) where brackets can be attached was chosen to apply the artefact radii: the distal area of the lower last molar. Those images of the test person with the severest artefacts generated at different sequences were chosen, and a virtual circle with the radius measured in the phantom was drawn around this point utilizing the DICOM viewer. No artefacts were detected outside of this circle in any of the sections. Especially with the TSE sequence (Figure 8), some of the relevant structures within the circle with the maximum measured artefact radius of 7.4 cm remain to be diagnostic, for example, the cervical spine, pharynx and brain stem. This is representatively shown in Figures 8 and 9 for the UK1 sample at TSE sequence. Additional brackets attached to premolar and front teeth did not potentiate the artefacts and therefore did not affect the diagnostic quality. Thus, it is sufficient to use the sample that is closest to the respective target region as initial point to apply the artefact radius.
Figure 8.

T2 weighted turbo spin echo sequence, sagittal section with the severest level of artefact, whole device intraoral. A circle was drawn around the second lower molar with r = 7.4 cm as measured in the phantom with sample UK1.
Figure 9.

T2 weighted turbo spin echo sequence, sagittal section without orthodontic appliance. The distal surface of the second lower molar represents the centre of the circle from Figure 8.
Comparability of the results
Comparing our data with other studies regarding the level of artefacts is relatively complicated since the MR sequences applied here differ from other studies since no standardization of imaging parameters is established in the MRI community. There are several studies utilizing various sequence types of specific vendors, such as slice-encoding metal artefact correction, view-angle tilting, multiacquisition variable–resonance image combination and metal artefact reduction sequence, all of which differ in sequence design and therefore cannot be compared to each other.17–19 This is the first study investigating the WARP sequence in this context.
The variety of available orthodontic products and the used steel grades make it difficult to compare in vitro data of artefact measurements of orthodontic devices. Most studies only indicate the composition20 but not the structure of the alloy or the steel grade. In the study by Beau et al20 and in the study by Elison et al,7 only one stainless steel bracket type was examined. They came to the conclusion that all “stainless steel” brackets render MRI scans of the head and neck region non-diagnostic and should be removed before MRI. Regarding this topic, Okano et al21 tried to analyse the assessment of the temporomandibular joint in patients with orthodontic appliances. These appliances consisted of austenitic and martensitic stainless steel attachments. For that reason, these results do not allow conclusions on the various other alloys.
Austenitic steels that are used in most cases are considered non-magnetic but still cause severe artefacts.8 This might be owing to the martensitic transformation during cold working of the products. Our magnetic test confirmed this effect: it was constantly positive when applied to the metallic brackets, thus, relatively strong artefacts had to be expected.
One limitation of this study is related to the fact that the alloys of the appliances investigated in this study are highly ferromagnetic compared with other appliances available for orthodontic therapy. However, this was carefully chosen to investigate the maximum artefact extent. Finally, our data were acquired at a magnetic field strength of 1.5 T and can therefore not predict artefact size at higher field strengths. However, 1.5 T is the clinically most-often available field strength.
In accordance with previous studies,22 we did not change the acquisition parameters of the in vivo study part in comparison with those used for the patients of our clinical routine. Some authors have varied these parameters to reduce artefacts,23,24 but our rationale to keep the acquisition unchanged was to keep our results valid under the terms of clinical routine. In the in vitro study part, the sequence acquisition was optimized for phantom scanning purposes.
Conclusion
Orthodontic metal attachments that proved to be ferromagnetic in a test with a small magnet of high flux density produced artefacts with a radius up to 74 mm in the phantom depending on the sequence type that was applied. Phantom measurements showed that the artefact-minimized TSE sequence reduced the artefact size by an average of 32.7%.
With TSE sequences, visibility of structures adjacent to the orthodontic appliance (temporomandibular bones, teeth, mouth base, lingua, palate, nasal cavity and paranasal sinuses) was negatively affected. The artefact-minimizing sequence reduced the level of artefacts, but the reduction was estimated to be clinically irrelevant for the target region of the cervical spine. With GRE sequences, the pneumatized sinuses and orbits were also not diagnostic owing to severe artefacts. However, the cervical spine and the neurocranium were unaffected. EPI sequences for imaging of the neurocranium cannot be applied in patients with orthodontic appliances.
The results obtained from our phantom measurements can be used to estimate the presence of artefacts in vivo. MRI of the cervical spine and the neurocranium were not affected in patients with ferromagnetic orthodontic appliances except for the EPI sequence. As a safe distance to the diagnostic target region, the dimension of the artefacts detected in the phantom with the respective sequences should be applied. The data obtained in the present study can contribute to a guideline for radiologists when confronted with the question of whether to remove the orthodontic appliance prior to MRI or not. This study further reveals that orthodontic appliances may often remain intraorally.
Contributor Information
C Zachriat, Email: christine.zachriat@charite.de.
P Asbach, Email: patrick.asbach@charite.de.
K I Blankenstein, Email: katharina.blankenstein@charite.de.
I Peroz, Email: Ingrid.peroz@charite.de.
F H Blankenstein, Email: felix.blankenstein@charite.de.
References
- 1.Costa AL, Appenzeller S, Yasuda CL, Pereira FR, Zanardi VA, Cendes F. Artifacts in brain magnetic resonance imaging due to metallic dental objects. Med Oral Patol Oral Cir Bucal 2009; 14: E278–82. [PubMed] [Google Scholar]
- 2.Sung JW, Kwon TY, Kyung HM. Debonding forces of three different customized bases of a lingual bracket system. Korean J Orthod 2013; 43: 235–41. doi: 10.4041/kjod.2013.43.5.235 [DOI] [PMC free article] [PubMed] [Google Scholar]
- 3.Klocke A, Kahl-Nieke B, Adam G, Kemper J. Magnetic forces on orthodontic wires in high field magnetic resonance imaging (MRI) at 3 Tesla. [In English, German.] J Orofac Orthop 2006; 67: 424–9. [DOI] [PubMed] [Google Scholar]
- 4.Yassi K, Ziane F, Bardinet E, Moinard M, Veyret B, Chateil JF. Evaluation of the risk of overheating and displacement of orthodontic devices in magnetic resonance imaging. [In French.] J Radiol 2007; 88: 263–8. [DOI] [PubMed] [Google Scholar]
- 5.Görgülü S, Ayyildiz S, Kamburoglu K, Gökçe S, Ozen T. Effect of orthodontic brackets and different wires on radiofrequency heating and magnetic field interactions during 3-T MRI. Dentomaxillofac Radiol 2014; 43: 20130356. doi: 10.1259/dmfr.20130356 [DOI] [PMC free article] [PubMed] [Google Scholar]
- 6.Blankenstein FH, Truong B, Thomas A, Schröder RJ, Naumann M. Signal loss in magnetic resonance imaging caused by intraoral anchored dental magnetic materials. [In German.] Rofo 2006; 178: 787–93. [DOI] [PubMed] [Google Scholar]
- 7.Elison JM, Leggitt VL, Thomson M, Oyoyo U, Wycliffe ND. Influence of common orthodontic appliances on the diagnostic quality of cranial magnetic resonance images. Am J Orthod Dentofacial Orthop 2008; 134: 563–72. doi: 10.1016/j.ajodo.2006.10.038 [DOI] [PubMed] [Google Scholar]
- 8.Blankenstein F, Truong BT, Thomas A, Thieme N, Zachriat C. Predictability of magnetic susceptibility artifacts from metallic orthodontic appliances in magnetic resonance imaging. J Orofac Orthop 2015; 76: 14–29. doi: 10.1007/s00056-014-0258-0 [DOI] [PubMed] [Google Scholar]
- 9.Radlanski RJ. A new carbide finishing bur for bracket debonding. J Orofac Orthop 2001; 62: 296–304. [DOI] [PubMed] [Google Scholar]
- 10.Thomsen M, Schneider U, Breusch SJ, Hansmann J, Freund M. Artefacts and ferromagnetism dependant on different metal alloys in magnetic resonance imaging. An experimental study. [In German.] Orthopade 2001; 30: 540–4. [DOI] [PubMed] [Google Scholar]
- 11.American Society for Testing and Materials, Subcommitee F04.15. F2119-07: standard test method for evaluation of MR image artifacts from passive implants. West Conshohocken, PA: American Society for Testing and Materials (ASTM) International; 2007. [Google Scholar]
- 12.Nitz R, Runge VM, Schmeets SH. Praxiskurs MRT. 2nd edn. Stuttgart, Germany: Georg Thieme Verlag; 2011. [Google Scholar]
- 13.Klinke T, Daboul A, Maron J, Gredes T, Puls R, Jaghsi A, et al. Artifacts in magnetic resonance imaging and computed tomography caused by dental materials. PLoS One 2012; 7: e31766. doi: 10.1371/journal.pone.0031766 [DOI] [PMC free article] [PubMed] [Google Scholar]
- 14.Hug J, Nagel E, Bornstedt A, Schnackenburg B, Oswald H, Fleck E. Coronary arterial stents: safety and artifacts during MR imaging. Radiology 2000; 216: 781–7. [DOI] [PubMed] [Google Scholar]
- 15.Hinshaw DB, Jr, Holshouser BA, Engstorm HI, Tjan AH, Christiansen EL, Catelli WF. Dental material artifacts on MR images. Radiology 1988; 166: 777–9. [DOI] [PubMed] [Google Scholar]
- 16.Petersilge CA, Lewin JS, Duerk JL, Yoo JU, Ghaneyem AJ. Optimizing imaging parameters for MR evaluation of the spine with titanium pedicle screws. AJR Am J Roentgenol 1996; 166: 1213–18. [DOI] [PubMed] [Google Scholar]
- 17.Zho SY, Kim MO, Lee KW, Kim DH. Artifact reduction from metallic dental materials in T1-weighted spin-echo imaging at 3.0 Tesla. J Magn Reson Imaging 2013; 37: 471–8. doi: 10.1002/jmri.23785 [DOI] [PubMed] [Google Scholar]
- 18.Doran SJ, Charles-Edwards L, Reinsberg SA, Leach MO. A complete distortion correction for MR images: I. Gradient warp correction. Phys Med Biol 2005; 50: 1343–61. [DOI] [PubMed] [Google Scholar]
- 19.Chen CA, Chen W, Goodman SB, Hargreaves BA, Koch KM, Lu W, et al. New MR imaging methods for metallic implants in the knee: artifact correction and clinical impact. J Magn Reson Imaging 2011; 33: 1121–7. doi: 10.1002/jmri.22534 [DOI] [PMC free article] [PubMed] [Google Scholar]
- 20.Beau A, Bossard D, Gebeile-Chauty S. Magnetic resonance imaging artefacts and fixed orthodontic attachments. Eur J Orthod 2015; 37: 105–10. doi: 10.1093/ejo/cju020 [DOI] [PubMed] [Google Scholar]
- 21.Okano Y, Yamashiro M, Kaneda T, Kasai K. Magnetic resonance imaging diagnosis of the temporomandibular joint in patients with orthodontic appliances. Oral Surg Oral Med Oral Pathol Oral Radiol Endod 2003; 95: 255–63. [DOI] [PubMed] [Google Scholar]
- 22.Koff MF, Shah P, Koch KM, Potter HG. Quantifying image distortion of orthopedic materials in magnetic resonance imaging. J Magn Reson Imaging 2013; 38: 610–18. doi: 10.1002/jmri.23991 [DOI] [PubMed] [Google Scholar]
- 23.Lee MJ, Kim S, Lee SA, Song HT, Huh YM, Kim DH, et al. Overcoming artifacts from metallic orthopedic implants at high-field-strength MR imaging and multi-detector CT. Radiographics 2007; 27: 791–803. [DOI] [PubMed] [Google Scholar]
- 24.Suh JS, Jeong EK, Shin KH, Cho JH, Na JB, Kim DH, et al. Minimizing artifacts caused by metallic implants at MR imaging: experimental and clinical studies. AJR Am J Roentgenol 1998; 171: 1207–13. [DOI] [PubMed] [Google Scholar]