Abstract
Objectives:
Diffusion-weighted MRI (DWI) has been introduced in head and neck lesions and adds important information to the findings obtained through conventional MRI. The purpose of this study was to assess the role of DWI in differentiating benign and malignant lesions of the tongue at 3.0-T field strength imaging.
Methods:
78 patients with 78 lingual lesions underwent conventional MRI and DWI with b-values of 0 and 1000 s mm−2 before therapy. The apparent diffusion coefficient (ADC) maps were reconstructed, and the ADC values of the lingual lesions were calculated and compared between benign and malignant lesions of the tongue.
Results:
The mean ADC values of the malignant tumours, benign solid lesions and cystic lesions were (1.08 ± 0.16) × 10−3, (1.68 ± 0.33) × 10−3 and (2.21 ± 0.35) × 10−3 mm2 s−1, respectively. The mean ADC values of malignant tumours were significantly lower (p < 0.001) than those of benign solid lesions, and the mean ADC values of benign solid lesions were significantly lower (p < 0.001) than those of cystic lesions. Receiver operating characteristic analysis showed that when an ADC value <1.31 × 10⁻³ mm2 s−1 was used for predicting malignancy, the highest accuracy of 95.3%, sensitivity of 92.6% and specificity of 97.3% were obtained.
Conclusions:
ADC values of benign and malignant lesions are significantly different at 3.0-T imaging. DWI can be applied as a complementary tool in the differentiation of benign and malignant lesions of the tongue.
Keywords: tongue neoplasms, magnetic resonance imaging, diffusion
Introduction
An early and accurate differentiation of malignant tumours of the tongue from benign lesions is critical for treatment planning and prognosis.1–3 Since location of the tongue is superficial, the pathological biopsy is commonly used for the pre-operative diagnosis. However, the biopsy is invasive, and the results are not always conclusive.4 Therefore, pre-operative imaging plays an important role in treatment selection and surgical planning. CT and conventional MRI are used to localize lingual masses and delineate their extent.5,6 However, accurate diagnosis and differentiating malignant from benign pathologies are likely to be difficult because of unspecific and overlapping imaging findings.7
Recently, diffusion-weighted MRI (DWI) has been introduced in the differentiation of head and neck tumours as a relatively new technique that depicts molecular diffusion, which is the random motion of water protons in biological a tissues. The random motion, classically called Brownian motion, is affected by cellular packing, intracellular elements, cell membranes and macromolecules present in various tissue compartments. The extent of molecular diffusion can be quantified in terms of the apparent diffusion coefficient (ADC). The ADC values reflect the microstructure or pathophysiological state of a tissue and are inversely correlated with tissue cellularity.8–10 Some studies reported the application of DWI with calculation of ADC in the differentiation between benign and malignant head and neck masses.11–15 However, most studies used 1.5-T field strength. To our knowledge, there is only one report on using ADC measurements for differentiating malignant from benign lesions of the tongue at 1.5-T MR.16 However, it is reported that the quantitative ADC values obtained at 1.5 T may not be transferable to 3.0 T.17
The purpose of our study was to investigate the diagnostic value of the ADCs calculated from DWI in distinguishing between benign and malignant lesions of the tongue at 3.0-T field strength imaging.
Methods and materials
This retrospective study was performed on 87 consecutive patients with lingual lesions from May 2012 to August 2014. All patients underwent conventional MRI and DWI at The First Affiliated Hospital of Zhengzhou University (Henan, China) without previous biopsy, surgery or treatment. Nine subjects were excluded from the study owing to lesions <1 cm on MR images (n = 4), obvious susceptibility artefacts (n = 4) or motion artefacts (n = 1). The final diagnoses were made histologically by using either surgery (n = 67) or biopsy (n = 9), and two inflammatory lesions were established with follow-up studies that revealed disappearance or remarkable regression of the lesions after antibacterial therapy. One patient had two lesions with different image characteristics, and the lesion that was the cause of the patient's chief complaint was selected for ADC analysis. Thus, 78 patients with 78 lingual lesions were enrolled in this study. This study was approved by the local institutional ethics committee, and informed consent was waived because this was a retrospective study.
MR examinations were performed on a 3.0-T whole-body MR unit (MAGNETOM® Skyra®; Siemens Healthcare, Erlangen, Germany) with an integrated 20-channel head and neck coil. Sedation was routinely achieved in children under 10 years old using oral chloral hydrate (70–80 mg kg−1 body weight) in 11 patients. Before DWI, T1 weighted spin echo images [repetition time/echo time (TR/TE) of 2000/9 ms], T2 weighted turbo spin echo images (TR/TE of 3800/92 ms) and T2 weighted turbo spin echo images with fat suppression (TR/TE of 7440/125 ms) were obtained in the transverse plane, with a section thickness of 5 mm, an intersection gap of 1 mm, a field of view of 24 × 24 cm and an acquisition matrix of 256 × 256. 24 transverse images of each sequence covered the lesions and areas of drainage from the regional lymph nodes. T2 weighted images with fat suppression (TR/TE of 4000/94 ms) were obtained in the coronal plane, with the same pulse sequence parameters.
DWI was obtained at the same section position as the axial T1 weighted images by using the spin echo single-shot echo-planar sequence. The parameters were as follows: TR/TE of 3200/70 ms, field of view of 24 × 24 cm, an acquisition matrix of 192 × 192, 24 sections and section thickness of 5 mm with an intersection gap of 1 mm. Diffusion-probing gradients were used in the x-, y-, and z-directions with b-values of 0 and 1000 s mm−2. ADC maps were automatically generated by the manufacturer software built into the MR unit (Syngo® REVEAL; Siemens Healthcare). Acquisition time for DWI was 48 s. After intravenous bolus injection of 0.1 mmol kg−1 gadopentetate dimeglumine (Magnevist®; Bayer Schering Pharma AG, Berlin, Germany), enhanced T1 weighted images (TR/TE of 884/6.8 ms) were obtained with or without fat suppression.
The quantitative analysis of the ADC map was made by one radiologist (15 years' experience in head and neck MRI) who was blinded to the clinical information and histopathological results. The region of interest was drawn within the centre of the lesions (avoiding the peripheral 2-mm internal to the circumference) on the ADC maps using an electronic cursor at the Siemens MMWP workstation (Syngo multimodality workplaces; Siemens Healthcare). In measuring the ADCs, region of interests were placed on the solid-appearing areas for the solid masses (avoiding cystic or necrotic portion) and on the cystic parts for the cystic lesions using both DWI and conventional MRI as reference images, including T1 weighted, T2 weighted or contrast-enhanced T1 weighted images. The mean ± standard deviation of the ADC values for the lingual lesions was calculated.
Statistical analyses were performed by using SPSS® v. 11.0 software (SPSS Inc., Chicago, IL). The Kolmogorov–Smirnov (K–S) test was used for diagnosis normality of data distribution. As all data were revealed to be parametric with normal distribution, an independent samples t-test was used to compare between the two groups. To compare more than two groups, one-way analysis of variance was used. Receiver operating characteristic curve analysis was used to determine the cut-off point with highest accuracy and sensitivity as the optimal ADC threshold value to differentiate between benign and malignant lesions. The area under the receiver operating characteristic curve was also calculated. A probability p-value < 0.05 indicated a statistically significant difference.
Results
There were 37 patients with malignant tumours (age range, 11–81 years; mean age, 52.71 ± 16.11 years; male : female ratio, 28 : 9), including 24 squamous cell carcinomas, 6 adenoid cystic carcinomas, 4 non-Hodgkin's lymphomas, 1 mucoepidermoid carcinoma, 1 epi-myo-epi carcinoma and 1 metastasis. 27 patients (age range, 2–84 years; mean age, 31.75 ± 27.88 years; male : female ratio, 12 : 15) had benign solid masses that consisted of 18 cases of vascular malformation, 6 inflammatory lesions, 1 schwannoma, 1 hamartoma and 1 lingual thyroid. 14 patients (age range, 1–74 years; mean age, 21.46 ± 23.07 years; male : female ratio, 9 : 5) had cysts.
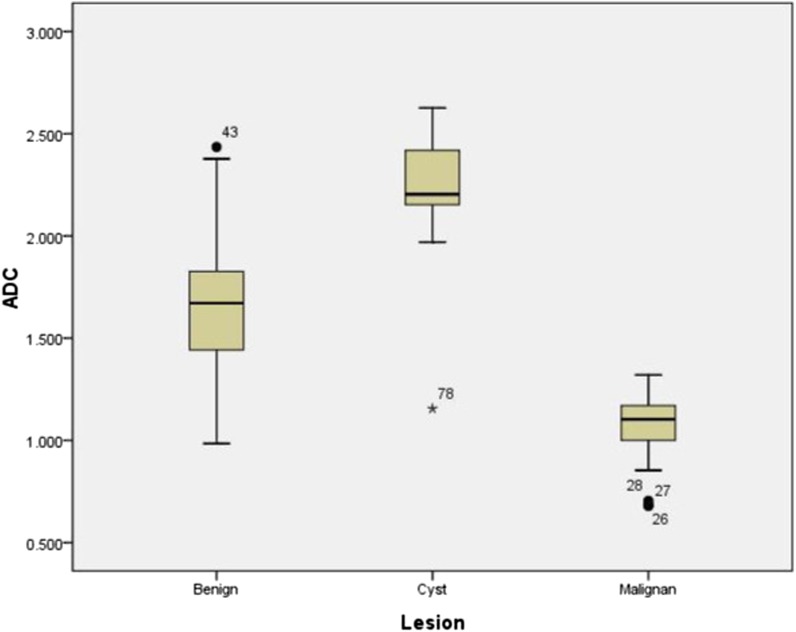
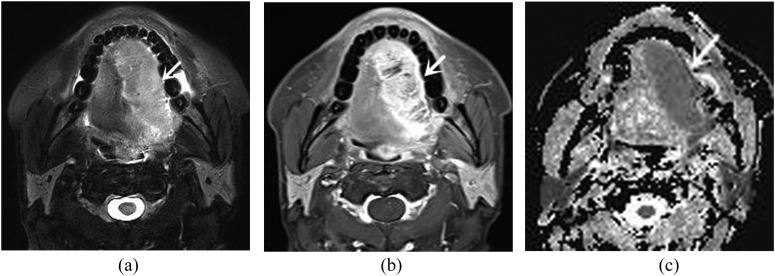
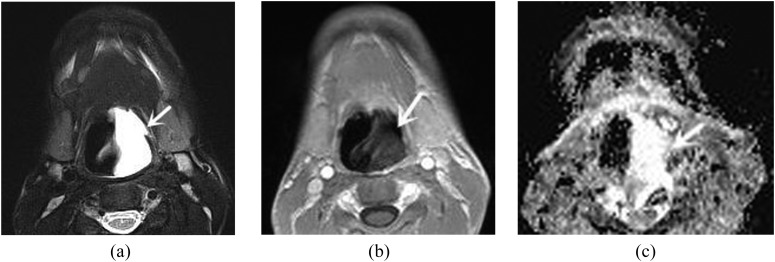
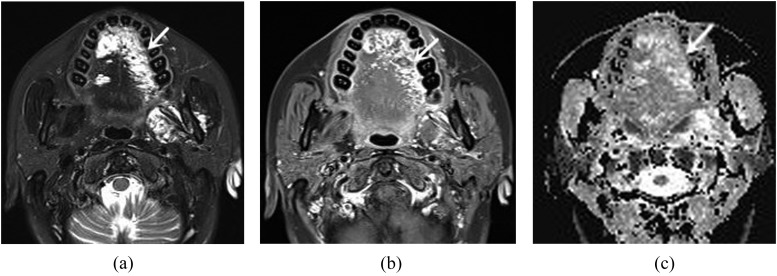
Table 1 displays the mean ADC values of the malignant and benign histological diagnoses. Figure 1 shows the distribution of ADC values. The mean ADC values of the malignant tumours, benign solid lesions and cystic lesions were (1.08 ± 0.16) × 10−3, (1.68 ± 0.33) × 10−3 and (2.21 ± 0.35) × 10−3 mm2 s−1, respectively (Figures 2–4). A statistically significant difference was found among the three groups (p < 0.001). The mean ADC values of the malignant tumours were significantly lower (p < 0.001) than those of the benign solid masses, and the mean ADC values of the benign solid masses were significantly lower (p < 0.001) than those of the benign cystic lesions.
Table 1.
Mean apparent diffusion coefficient (ADC) values of malignant tumours, benign solid and cystic lesions of the tongue (×10−3 mm2 s−1)
| Pathology | Number | ADC (mean ± standard deviation) | ADC (minimum) | ADC (maximum) |
|---|---|---|---|---|
| Malignant | 37 | 1.08 ± 0.16 | 0.68 | 1.32 |
| Squamous cell carcinoma | 24 | 1.12 ± 0.11 | 0.94 | 1.32 |
| Adenoid cystic carcinoma | 6 | 1.14 ± 0.10 | 1.04 | 1.29 |
| Non-Hodgkin's lymphoma | 4 | 0.73 ± 0.08 | 0.85 | 0.68 |
| Mucoepidermoid carcinoma | 1 | 1.00 | – | – |
| Epi-myo-epi carcinoma | 1 | 1.15 | – | – |
| Metastasis | 1 | 1.27 | – | – |
| Benign | 27 | 1.68 ± 0.33 | 0.98 | 2.43 |
| Vascular malformation | 18 | 1.80 ± 0.29 | 1.34 | 2.43 |
| Inflammatory lesions | 6 | 1.35 ± 0.23 | 0.98 | 1.67 |
| Schwannoma | 1 | 1.33 | – | – |
| Hamartoma | 1 | 1.82 | – | – |
| Lingual thyroid | 1 | 1.63 | – | – |
| Cyst | 14 | 2.21 ± 0.35 | 1.16 | 2.63 |
Figure 1.
Box and whisker plot of apparent diffusion coefficient (ADC) values of lingual lesions at 3.0-T strength. Malignant tumours (Malignan) showed lower ADC values than benign solid masses and cystic lesions (Cyst).
Figure 2.
A 55-year-old male with squamous cell carcinoma. (a) Axial T2 weighted image with fat suppression shows a homogeneously hyperintense mass (arrow) at the right lateral aspect of the tongue, which extends across the midline. (b) Axial contrast-enhanced T1 weighted MR image with fat suppression demonstrates heterogeneous enhancement (arrow). (c) Apparent diffusion coefficient (ADC) map reveals a hypointense mass (arrow). The ADC value is 1.17 × 10⁻³ mm2 s−1.
Figure 4.
A 17-year-old male with cyst. (a) Axial T2 weighted image with fat suppression shows a homogeneously hyperintense lesion (arrow) in the tongue root. (b) Axial contrast-enhanced T1 weighted MR image demonstrates heterogeneously peripheral enhancement (arrow). (c) Apparent diffusion coefficient (ADC) map reveals a hyperintense lesion (arrow). The ADC value is 2.17 × 10⁻³ mm2 s−1.
Figure 3.
A 43-year-old female with vascular malformation. (a) Axial T2 weighted image with fat suppression shows multiple heterogeneously hyperintense lesions (arrow) in the tongue dorsum. (b) Axial contrast-enhanced T1 weighted MR image with fat suppression demonstrates heterogeneous enhancement (arrow). (c) Apparent diffusion coefficient (ADC) map reveals heterogeneously hyperintense lesions (arrow). The ADC value is 1.51 × 10⁻³ mm2 s−1.
There were also statistically significant differences between ADC values of different malignant tumours of the tongue (p < 0.001). Non-Hodgkin lymphomas [(0.73 ± 0.08) × 10−3 mm2 s−1] revealed significantly lower ADC values than squamous cell carcinomas [(1.12 ± 0.11) × 10−3 mm2 s−1] (p < 0.001) and adenoid cystic carcinomas [(1.14 ± 0.10) × 10−3 mm2 s−1] (p < 0.001). There was no significant difference in the ADC values between squamous cell carcinomas and adenoid cystic carcinomas (p = 1.000). Within different benign solid lesions, the highest ADC value was detected in patients with vascular malformation, and the ADC values of inflammatory lesions [(1.35 ± 0.23) × 10−3 mm2 s−1] were significantly lower than those of vascular malformation [(1.80 ± 0.29) × 10−3 mm2 s−1] (p = 0.005). There was significant difference in the ADC values between malignant tumours and inflammatory lesions (p = 0.001).
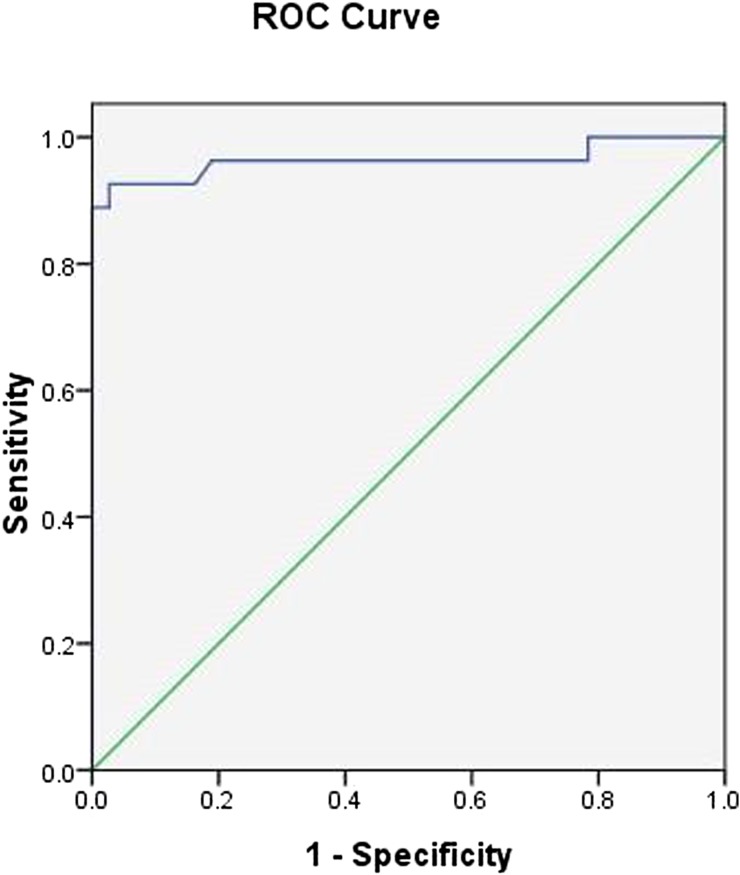
Receiver operating characteristic analysis showed that when the optimal threshold for the ADC was 1.31 × 10⁻³ mm2 s−1, the best result for distinguishing between benign solid lesions and malignant tumours of the tongue was obtained with a sensitivity of 92.6%, a specificity of 97.3%, an accuracy of 95.3% and the area under the curve of 0.963 (Figure 5).
Figure 5.
Receiver operating characteristic (ROC) curve of apparent diffusion coefficient value used for differentiating malignant tumours from benign solid lesions of the tongue. The optimal threshold was 1.31 × 10⁻³ mm2 s−1 with a sensitivity of 92.6%, a specificity of 97.3% and an accuracy of 95.3%.
Discussion
The results of this study demonstrated that the mean ADC values of malignant tumours were significantly lower than those of benign solid and cystic lesions. The lower ADC values of malignant tumours were attributed to the pathophysiological status (hypercellularity and enlarged nuclei). Hypercellularity reduces the extracellular matrix and the diffusion space of water protons in the extracellular compartment, and enlarged nuclei decreases the intracellular dimensions, both resulting in decreased ADC values.11–13
The findings of this study are in concordance with prior studies. Srinivasan et al12 demonstrated a significant difference in ADC values between benign and malignant lesions in the head and neck at 3.0-T imaging. They established an optimal ADC threshold of 1.3 × 10⁻³ mm2 s−1 for differentiating malignant from benign tumours. The ADC threshold of our study is very similar to Srinivasan's. In a study by Wang et al,11 the researchers found that the ADC values of solid benign masses were significantly higher than those of malignant tumours in the head and neck, and the ADC values of cystic lesions were significantly higher than those of solid benign masses. These results were also supported by Abdel Razek et al.14 To our knowledge, there is only one previous report on DWI in the diagnosis of the tongue tumours by Ai et al.16 Their results indicated that malignant tumours exhibited significantly lower ADC values (using b-values of 500 and 1000 s mm−2) than those of benign lesions at 1.5-T imaging, and the ADCb=500 value was <1.43 × 10⁻³ mm2 s−1 for predicting malignancy. Their ADC threshold was greater than ours. This variation can be explained by multiple factors including the use of different b-values, field strength and also by the variation in histology of included lesions. Within the benign lesions, Ai et al16 included cystic lesions and they had no inflammatory lesions, whereas our study had solid lesions (including inflammatory lesions) and cystic lesions as two groups, resulting in a lower mean ADC value.
Although the result of this study demonstrated significant difference in ADC values between benign and malignant lesions, there was variability in ADC values within each group. Within the malignant tumours, lymphomas have more cellularity, and larger nuclei, resulting in less extracellular or intracellular space. The ADC values of lymphomas were lower than those of squamous cell carcinomas (p < 0.001) and adenoid cystic carcinomas (p < 0.001), and this finding is similar to prior studies.18,19 In addition, the present study found that there was no significant difference in ADC values between squamous cell carcinomas and adenoid cystic carcinomas (p = 1.00). Although inflammatory lesions showed lower ADC values in benign lesions of the tongue, they were still higher than those of malignant tumours (p = 0.001). This result may be associated with hypercellularity and enlarged nuclei in malignant tumours and varying properties of secretions in inflammatory lesions. The prior studies on the difference between inflammation and malignant tumours on DWI had reached no agreement. Wang et al20 found there was no significant difference in the ADC values between inflammatory and malignant masticator space lesions. However, Abdel Razek and Nada21 reported that the ADC value of masticator space malignancy was significantly lower than that of masticator space infection. Sasaki et al18 also demonstrated that DWI could differentiate inflammatory from malignant tumours in the sinonasal area. The different results may be owing to different pathologies of patients as well as different data acquisitions. However, it is obvious that the ADC values of benign cystic lesions in this study was higher than those of the other two categories of lesions owing to the relatively freer mobility of water protons in the fluid than in other tissues.
In the present study, the ADC threshold value was 1.31 × 10⁻³ mm2 s−1, resulting in the highest sensitivity of 97.3%, a specificity of 92.6% and an accuracy of 95.3%. One patient with squamous cell carcinoma (1.32 × 10⁻³ mm2 s−1) was misdiagnosed with a benign lesion. The small foci of liquefactive necrosis in the tumour may explain the slightly high ADC value of squamous cell carcinoma. Two inflammatory lesions exhibited low ADC values (1.24 × 10⁻³ and 0.98 × 10⁻³ mm2 s−1) and were falsely diagnosed as malignant lesions. A large amount of inflammatory cells with abundant exudation of protein would limit the motion of the water protons in the extracellular compartment and may be the reason for the low ADC value of the inflammatory lesion. Another inflammatory lesion showed low ADC value because of squamous cell hyperplasia in the pathological analyses. One dermoid cyst revealed a lower ADC value (1.16 × 10⁻³ mm2 s−1) among cystic lesions owing to higher protein component in the fluid that increased the viscosity and decreased the water proton mobility.11
The ADC value is not only dependent on the extent of molecular diffusion but also varies with the underlying chosen b-values. At lower b-values, an additional effect of microperfusion is introduced, leading to stronger signal decay and higher ADC values. At The First Affiliated Hospital of Zhengzhou University, we opted to use a maximum b-value of 1000 s mm−2, which was consistent with most clinical studies.9 The use of higher b-values results in ADC values that are much lower and better approximate the true diffusion of the tissue. To the best of our knowledge, it is still controversial how ADC values vary between different field strengths. While significant differences in ADC values measured in the brain's gray and white matter regions have been reported between 1.5- and 3.0-T field strengths,17 no such studies have been performed in head and neck tumours. Therefore, the present study attempted to investigate whether the differences in ADC values between benign and malignant lesions of the tongue are reproducible towards 3.0 T.
The present study is a retrospective study, which includes patients suspected or at risk of a specific diagnosis. The design of this study is appropriate to evaluate diagnostic accuracy and is comparable to daily practice, compared with a case–control design, which introduces a bias in patient selection and risks the chance of overestimation of the diagnostic accuracy.22 In addition, the quantitative analysis of the ADC map and region-of-interest delineation of this study were made by one radiologist who may have a bias in ADC values measurement. In the study by Ai et al,16 two radiologists in consensus obtained the ADC values measurement, and the ADC threshold (1.43 × 10⁻³ mm2 s−1) was greater than that of ours (1.31 × 10⁻³ mm2 s−1). Except for the use of different b-values, field strength and the variation in pathological types, delineation methods can be other possible factors that affect ADC values.
In this study, the group of patients was heterogeneous with different pathological entities and different age groups of adults and children. Further investigations are recommended in a larger number of cases on certain pathological lesions in adults or children. One limitation of the echo-planar sequence of the tongue is image degradation caused by motion and susceptibility artefacts. We noted that five patients were excluded because of bad image quality in this work. It is reported that artefact volumes were lower with a 3.0-T MRI scanner than with a 1.5-T machine.23 We expect a thinner section, and parallel imaging can be performed for better image contrast in the future studies.8 Another shortcoming of this study is that ADC values between some benign lesions and malignant tumours overlap, and this could result in misdiagnosis. Thus, future studies of multiparametric MRI may be helpful to improve the diagnostic accuracy of differentiating malignant from benign lesions.24
In conclusion, DWI is useful in differentiating benign lesions from malignant tumours of the tongue at 3.0 T. The ADC values are lower in malignant tumours than in benign lesions of the tongue. An ADC value <1.31 × 10⁻³ mm2 s−1 can be used for predicting malignant tumours of the tongue.
Contributor Information
S Li, Email: zzhsj2008@163.com.
J Cheng, Email: chengjl-2008@163.com.
References
- 1.Lim YC, Lee JS, Koo BS, Kim SH, Kim YH, Choi EC. Treatment of contralateral N0 neck in early squamous cell carcinoma of the oral tongue: elective neck dissection versus observation. Laryngoscope 2006; 116: 461–5. doi: 10.1097/01.mlg.0000195366.91395.9b [DOI] [PubMed] [Google Scholar]
- 2.Johnson PL, Eckard DA, Brecheisen MA, Girod DA, Tsue TT. Percutaneous ethanol sclerotherapy of venous malformations of the tongue. AJNR Am J Neuroradiol 2002; 23: 779–82. [PMC free article] [PubMed] [Google Scholar]
- 3.Williams JD, Sclafani AP, Slupchinskij O, Douge C. Evaluation and management of the lingual thyroid gland. Ann Otol Rhinol Laryngol 1996; 105: 312–16. doi: 10.1177/000348949610500414 [DOI] [PubMed] [Google Scholar]
- 4.Zbären P, Nuyens M, Loosli H, Stauffer E. Diagnostic accuracy of fine-needle aspiration cytology and frozen section in primary parotid carcinoma. Cancer 2004; 100: 1876–83. [DOI] [PubMed] [Google Scholar]
- 5.Ong CK, Chong VF. Imaging of tongue carcinoma. Cancer Imaging 2006; 6: 186–93. doi: 10.1102/1470-7330.2006.0029 [DOI] [PMC free article] [PubMed] [Google Scholar]
- 6.Lwin CT, Hanlon R, Lowe D, Brown JS, Woolgar JA, Triantafyllou A, et al. Accuracy of MRI in prediction of tumour thickness and nodal stage in oral squamous cell carcinoma. Oral Oncol 2012; 48: 149–54. doi: 10.1016/j.oraloncology.2011.11.002 [DOI] [PubMed] [Google Scholar]
- 7.Alberico RA, Husain SH, Sirotkin I. Imaging in head and neck oncology. Surg Oncol Clin N Am 2004; 13: 13–35. doi: 10.1016/S1055-3207(03)00124-8 [DOI] [PubMed] [Google Scholar]
- 8.Chawla S, Kim S, Wang S, Poptani H. Diffusion-weighted imaging in head and neck cancers. Future Oncol 2009; 5: 959–75. doi: 10.2217/fon.09.77 [DOI] [PMC free article] [PubMed] [Google Scholar]
- 9.Thoeny HC, De Keyzer F, King AD. Diffusion-weighted MR imaging in the head and neck. Radiology 2012; 263: 19–32. doi: 10.1148/radiol.11101821 [DOI] [PubMed] [Google Scholar]
- 10.Vandecaveye V, De Keyzer F, Vander Poorten V, Dirix P, Verbeken E, Nuyts S, et al. Head and neck squamous cell carcinoma: value of diffusion-weighted MR imaging for nodal staging. Radiology 2009; 251: 134–46. doi: 10.1148/radiol.2511080128 [DOI] [PubMed] [Google Scholar]
- 11.Wang J, Takashima S, Takayama F, Kawakami S, Saito A, Matsushita T, et al. Head and neck lesions: characterization with diffusion-weighted echo-planar MR imaging. Radiology 2001; 220: 621–30. doi: 10.1148/radiol.2202010063 [DOI] [PubMed] [Google Scholar]
- 12.Srinivasan A, Dvorak R, Perni K, Rohrer S, Mukherji SK. Differentiation of benign and malignant pathology in the head and neck using 3T apparent diffusion coefficient values: early experience. AJNR Am J Neuroradiol 2008; 29: 40–4. doi: 10.3174/ajnr.A0743 [DOI] [PMC free article] [PubMed] [Google Scholar]
- 13.Sakamoto J, Yoshino N, Okochi K, Imaizumi A, Tetsumura A, Kurohara K, et al. Tissue characterization of head and neck lesions using diffusion-weighted MR imaging with SPLICE. Eur J Radiol 2009; 69: 260–8. doi: 10.1016/j.ejrad.2007.10.008 [DOI] [PubMed] [Google Scholar]
- 14.Abdel Razek AA, Gaballa G, Elhawarey G, Megahed AS, Hafez M, Nada N. Characterization of pediatric head and neck masses with diffusion-weighted MR imaging. Eur Radiol 2009; 19: 201–8. doi: 10.1007/s00330-008-1123-6 [DOI] [PubMed] [Google Scholar]
- 15.Schakel T, Hoogduin JM, Terhaard CH, Philippens ME. Diffusion weighted MRI in head-and-neck cancer: geometrical accuracy. Radiother Oncol 2013; 109: 394–7. doi: 10.1016/j.radonc.2013.10.004 [DOI] [PubMed] [Google Scholar]
- 16.Ai S, Zhu W, Liu Y, Wang P, Yu Q, Dai K. Combined DCE- and DW-MRI in the diagnosis of benign and malignant tumors of the tongue. Front Biosci (Landmark Ed) 2013; 18: 1098–111. [DOI] [PubMed] [Google Scholar]
- 17.Huisman TA, Loenneker T, Barta G, Bellemann ME, Hennig J, Fischer JE, et al. Quantitative diffusion tensor MR imaging of the brain: field strength related variance of apparent diffusion coefficient (ADC) and fractional anisotropy (FA) scalars. Eur Radiol 2006; 16: 1651–8. [DOI] [PubMed] [Google Scholar]
- 18.Sasaki M, Eida S, Sumi M, Nakamura T. Apparent diffusion coefficient mapping for sinonasal diseases: differentiation of benign and malignant lesions. AJNR Am J Neuroradiol 2011; 32: 1100–6. doi: 10.3174/ajnr.A2434 [DOI] [PMC free article] [PubMed] [Google Scholar]
- 19.Fong D, Bhatia KS, Yeung D, King AD. Diagnostic accuracy of diffusion-weighted MR imaging for nasopharyngeal carcinoma, head and neck lymphoma and squamous cell carcinoma at the primary site. Oral Oncol 2010; 46: 603–6. doi: 10.1016/j.oraloncology.2010.05.004 [DOI] [PubMed] [Google Scholar]
- 20.Wang P, Yang J, Yu Q, Ai S, Zhu W. Evaluation of solid lesions affecting masticator space with diffusion-weighted MR imaging. Oral Surg Oral Med Oral Pathol Oral Radiol Endod 2010; 109: 900–7. doi: 10.1016/j.tripleo.2010.01.005 [DOI] [PubMed] [Google Scholar]
- 21.Abdel Razek AA, Nada N. Role of diffusion-weighted MRI in differentiation of masticator space malignancy from infection. Dentomaxillofac Radiol 2013; 42: 20120183. doi: 10.1259/dmfr.20120183. [DOI] [PMC free article] [PubMed] [Google Scholar]
- 22.Driessen JP, van Kempen PM, van der Heijden GJ, Philippens ME, Pameijer FA, Stegeman I, et al. Diffusion-weighted imaging in head and neck squamous cell carcinomas: a systematic review. Head Neck 2015; 37: 440–8. doi: 10.1002/hed.23575 [DOI] [PubMed] [Google Scholar]
- 23.Rylander S, Thörnqvist S, Haack S, Pedersen EM, Muren LP. Intensity profile based measurement of prostate gold markers influence on 1.5 and 3T diffusion-weighted MR images. Acta Oncol 2011; 50: 866–72. doi: 10.3109/0284186X.2011.590523 [DOI] [PubMed] [Google Scholar]
- 24.Sasaki M, Sumi M, Eida S, Ichikawa Y, Sumi T, Yamada T, et al. Multiparametric MR imaging of sinonasal diseases: time-signal intensity curve- and apparent diffusion coefficient-based differentiation between benign and malignant lesions. AJNR Am J Neuroradiol 2011; 32: 2154–9. doi: 10.3174/ajnr.A2675 [DOI] [PMC free article] [PubMed] [Google Scholar]


