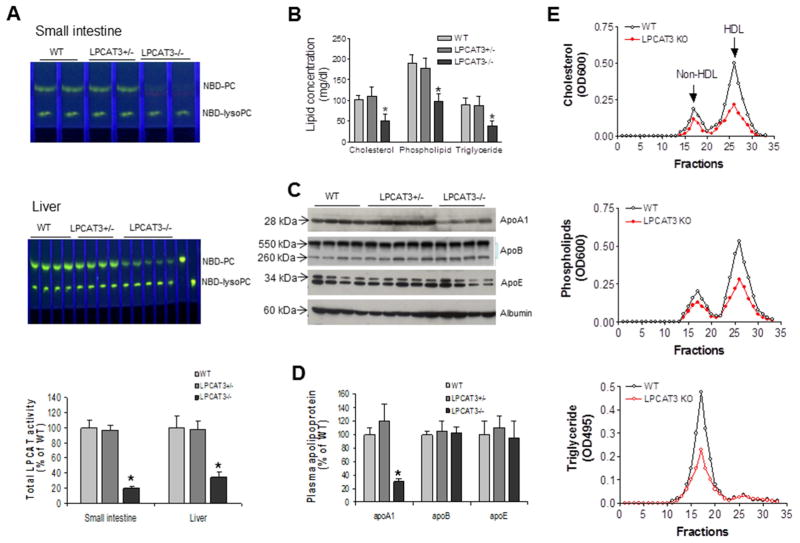
Figure 3. Measurements of total LPCAT activity and plasma lipoprotein levels in WT and LPCAT3 KO mice.
(A) Total LPCAT activity in small intestine and liver of WT and LPCAT3 KO male mice, measured as described in “Experimental Procedures”. (B) Total cholesterol, phospholipid, and triglyceride levels in plasma. (C) Fluorogram of plasma apolipoprotein levels by Western blotting. Plasma (0.2 μL) was separated by 4–15% SDS-PAGE, and immunoblotted with polyclonal antibodies against apoA-I, apoB, apoE, and albumin. (D) Quantitation of plasma apoA-I, apoB, and apoE levels. (E) Plasma lipoprotein distribution by fast protein liquid chromatography (FPLC). Total cholesterol, phospholipids, and triglycerides were determined in each fraction. Values are mean ± SD, n = 5, *P < 0.05.

