

Abstract
Background
As Kawasaki disease (KD) shares many clinical features with other more common febrile illnesses and misdiagnosis, leading to a delay in treatment, increases the risk of coronary artery damage, a diagnostic test for KD is urgently needed. We sought to develop a panel of biomarkers that could distinguish between acute KD patients and febrile controls (FC) with sufficient accuracy to be clinically useful.
Methods
Plasma samples were collected from three independent cohorts of FC and acute KD patients who met the American Heart Association definition for KD and presented within the first 10 days of fever. The levels of 88 biomarkers associated with inflammation were assessed by Luminex bead technology. Unsupervised clustering followed by supervised clustering using a Random Forest model was used to find a panel of candidate biomarkers.
Results
A panel of biomarkers commonly available in the hospital laboratory (absolute neutrophil count, erythrocyte sedimentation rate, alanine aminotransferase, gamma glutamyl transferase, concentrations of alpha-1-antitrypsin, C-reactive protein, and fibrinogen, and platelet count) accurately diagnosed 81 to 96% of KD patients in a series of three independent cohorts.
Conclusions
After prospective validation, this 8-biomarker panel may improve the recognition of KD.
Introduction
The etiology of Kawasaki disease (KD), the leading cause of acquired heart disease in children, remains unknown, and there is no definitive diagnostic test (1). The diagnosis rests upon clinical criteria that are shared by other common pediatric illnesses (2). Clinical confusion can lead to a missed or delayed diagnosis, which increases the risk of coronary artery aneurysms (3, 4). Between 15 to 30% of KD patients do not meet complete clinical criteria and are defined as having “incomplete” KD, which further contributes to delayed diagnosis (3, 5-8). Treatment with intravenous immunoglobulin (IVIG) is effective in reducing the cardiovascular complications if administered within the first 10 days after the onset of fever (9). Without prompt treatment, approximately 25% of children with KD will develop coronary artery aneurysms, which can lead to myocardial infarction and other cardiovascular sequelae later in life. Thus, a diagnostic test for KD is urgently needed to help identify patients who require treatment.
Endothelial cell and cardiomyocyte injury, platelet activation, acute phase response, and immune activation are hallmarks of acute KD. Previous studies have evaluated candidate biomarkers in each of these pathways as tools for diagnosing acute KD, including vascular endothelial growth factor (VEGF), amino-terminal pro brain natriuretic peptide (NT-proBNP), BNP, fibrinogen, alpha-1-antitrypsin (A1AT), thrombopoietin, matrix metalloproteinases, and eotaxin (10-15). No biomarker has demonstrated sufficient sensitivity or specificity when used alone to reliably identify KD patients. However, a combination of biomarkers representing different biologic pathways might improve diagnostic accuracy. Thus, our objective was to develop a panel of biomarkers that could distinguish between acute KD patients and febrile controls (FC) with sufficient accuracy to be clinically useful.
Results
Clinical Characteristics of the Study Population
There were no significant statistical differences in clinical and laboratory parameters among the KD subjects or among FC subjects in all 3 cohorts (Table 1). Compared to FC subjects, KD subjects had higher levels of inflammation based on standard clinical laboratory testing, although there was substantial overlap between the groups (Table 1).
Table 1.
Clinical and laboratory characteristics of acute Kawasaki disease (KD) and febrile control (FC) subjects in Cohorts 1, 2 and 3.
| Characteristics | KD Cohort 1 (n=28) | FC Cohort 1 (n=28) | P value | KD Cohort 2 (n=44) | FC Cohort 2 (n=44) | P value | KD Cohort 3 (n=30) | FC Cohort 3 (n=30) | P value |
|---|---|---|---|---|---|---|---|---|---|
|
| |||||||||
| Age in years, median (range) | 2.9 (0.4-11.0) | 2.9 (0.3-10.9) | NS | 2.4 (0.4-9.1) | 2.4 (0.1-8.8) | NS | 3.1 (0.4-6.4) | 3.1 (0.6-6.1) | NS |
|
| |||||||||
| Male, n (%) | 18 (64) | 18 (64) | NS | 26 (59) | 26 (59) | NS | 14 (47) | 14 (47) | NS |
|
| |||||||||
| Illness Day, median (range)a | 6(2-10) | 6(2-14) | NS | 6 (2-10) | 5 (2-9) | 0.03 | 5(3-10) | 5 (2-21) | NS |
|
| |||||||||
| Coronary artery status,n (%) | |||||||||
| Normal | 17(61) | NA | NA | 32 (73) | NA | NA | 24 (80) | NA | NA |
| Dilated | 6 (21) | 10 (22) | 4 (13) | ||||||
| Aneurysm | 5 (18) | 2 (5) | 2 (7) | ||||||
|
| |||||||||
| IVIG resistant, n (%) | 9 (32) | NA | NA | 11 (25) | NA | NA | 5 (17) | NA | NA |
|
| |||||||||
| CRP (mg/dL)b | 8.1 (4.3-15.7) | 3.4 (1.8-4.3) | <0.001 | 6.9 (3.7-16.5) | 2.6 (1.2-6) | <0.001 | 7.2 (4.1-13.7) | 2.9 (0.9-6.1) | <0.001 |
|
| |||||||||
| ESR (mm/h)b | 51 (36-72) | 31(17-38) | <0.001 | 62 (49-82) | 31 (18-45) | <0.001 | 57 (40-74) | 32 (17-62) | 0.004 |
|
| |||||||||
| WBC (x109/L)b | 12.8 (11.1-15.6) | 7.3 (6.2-12.1) | <0.001 | 13.5 (10-15.6) | 8.9 (6.9-12.2) | <0.001 | 13.1 (10.4-14.9) | 9.8 (7.2-15.7) | NS |
|
| |||||||||
| %Polymorpho-nuclear leukocytesb | 54 (46-67) | 42 (30-67) | NS | 52 (41-59) | 40 (28-59) | 0.05 | 58 (48-67) | 53 (29-60) | NS |
|
| |||||||||
| % Bandsb | 11 (5-17) | 5 (0-12) | NS | 11 (4-18) | 7 (3-15) | NS | 8 (5-17) | 3 (2-7) | 0.002 |
|
| |||||||||
| Absolute neutrophil countb | 8358 (6580-10839) | 4317 (2364-6847) | <0.001 | 6411 (4037-9737) | 4829 (2721-6847) | NS | 8056 (6067-11481) | 5198 (2836-9386) | 0.013 |
|
| |||||||||
| Age-adjusted Hgb, S.D. unitsb | -1.4 (-2.5 to -0.6) | -0.1 (-0.9 to 0.5) | 0.001 | -1.1 (-2.3 to -0.2) | -0.7 (-1.2 to 0.3) | 0.007 | -1.1 (-2.0 to -0.3) | -0.7 (-1.5 to 0.3) | NS |
|
| |||||||||
| Platelet count (x109/L)b | 403 (323-450) | 240 (200-328) | <0.001 | 402 (321-458) | 279 (215-335) | <0.001 | 367 (314-444) | 326 (203-373) | NS |
|
| |||||||||
| ALT (IU/L)b | 39 (26-89) | 22 (16-25) | 0.003 | 30 (20-61) | 27 (15-34) | NS | 35 (19-80) | 17 (12-25) | 0.002 |
|
| |||||||||
| GGT (IU/L)b | 43 (17-134) | 15 (11-17) | 0.001 | 28 (15-110) | 15 (13-20) | <0.001 | 49 (17-84) | 15 (13-18) | 0.001 |
|
| |||||||||
| A1ATb | 4.2 (3.8-4.9) | 2.8 (2.5-3.4) | <0.001 | 2.7 (2.3-3.3) | 2 (1.8-2.2) | <0.001 | 9.6 (7.5-11.3) | 6.4(5.0-8.4) | <0.001 |
|
| |||||||||
| Fibrinogenb | 5.9 (4.9-6.1) | 4 (3.2-4.6) | <0.001 | 8.2 (6.8-9.3) | 5.4 (4.6-6.5) | <0.001 | 4.5 (3.9-4.8) | 3.6 (3.1-4.6) | 0.004 |
First day of fever = Day 1
Laboratory data are presented as median (interquartile range); data analyzed using Wilcoxon rank sum; categorical data analyzed using Fisher's exact test and Chi-square test; significance at P<0.05; NS = not significant
IVIG = intravenous immunoglobulin, CRP = C-reactive protein, ESR = erythrocyte sedimentation rate, WBC = white blood cell count, Hgb = hemoglobin concentration, ALT = alanine amino transferase (nl< 48 IU/L), GGT = γ-glutamyl transferase (nl< 34 IU/L), A1AT = alpha 1 antitrypsin; NA = not available
Clustering and Pathway Analyses
Among the markers which discriminated between KD and FC in the univariate analysis of Cohorts 1 and 2 (Supplemental Table 1 (online)), 16 and 11 biomarkers, respectively, were identified by unsupervised clustering (Figure 1). The 16-biomarker panel (Figure 1A) correctly classified all but 1 febrile control, while the 11-biomarker panel misclassified five of the 44 KD subjects (11%). Unsupervised principal component analysis uncovered distinct groups corresponding to KD patients and FC subjects (Figure 2). Supervised classification with Random Forests with 16 significant biomarkers identified in Cohort 1 yielded an area under the curve (AUC) of 0.84 when tested in Cohort 2, while the 11 biomarkers identified in Cohort 2 yielded an AUC of 0.93 when tested in Cohort 1 (Figures 3A and B, red curve). Pathway analysis of the statistically significant markers revealed that these biomarkers pertained to several inflammatory pathways including IL-17, innate immunity, and T cell signaling (Table 3).
Figure 1.
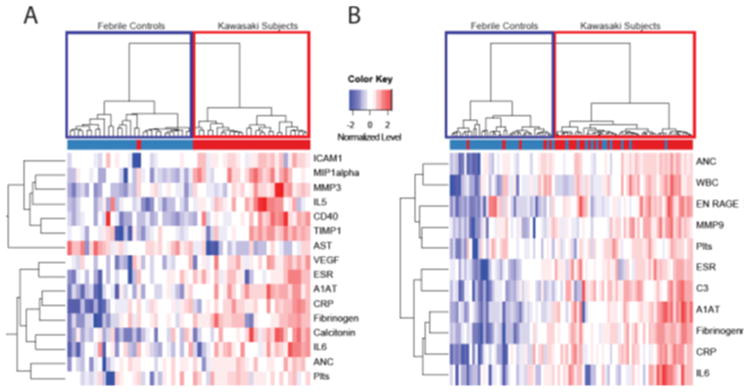
Unsupervised clustering analysis of inflammatory markers from Luminex platform with P≤ 0.05 for KD and FC in Cohort 1 (A) and Cohort 2 (B). ICAM1, intracellular adhesion molecule 1; MIP1 alpha, macrophage inflammatory protein 1 alpha; IL, interleukin; TIMP1, tissue inhibitor of metalloproteinase 1; AST, aspartate aminotransferase; VEGF, vascular endothelial growth factor; ESR, erythrocyte sedimentation rate; A1AT, alpha 1 antitrypsin; CRP, C-reactive protein; ANC, absolute neutrophil count; Plts, platelets; WBC, white blood cell count; ENRAGE, endothelial receptor for advanced glycation end products. Febrile controls are in blue and Kawasaki subjects are in red.
Figure 2.
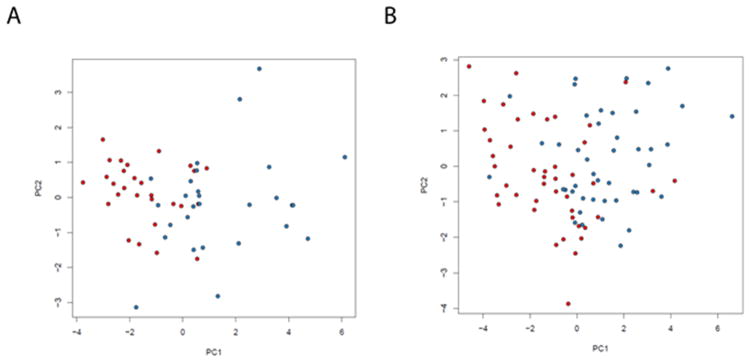
Principal component analysis demonstrating differentiation between KD patients (red) and febrile controls (blue) based on 16 markers selected on Cohort 1 and tested on Cohort 2 (A) and 11 markers selected on Cohort 2 and tested on Cohort 1 (B).
Figure 3.
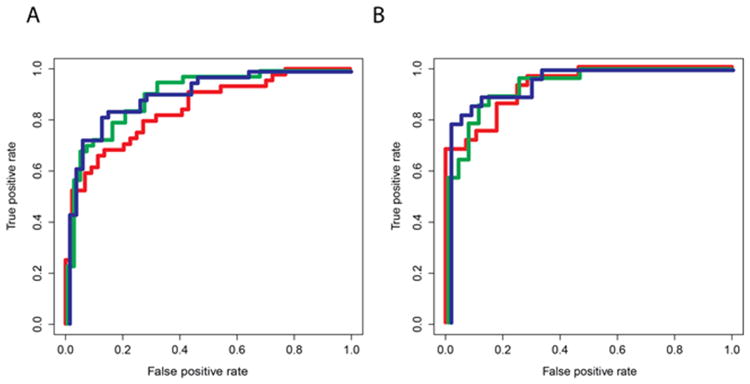
Receiver-operator characteristic curves for Random Forest models of the diagnostic performance of biomarkers derived and validated in Cohorts 1 and 2. A). Performance of 16 biomarkers derived from Cohort 1 and validated on Cohort 2 (red curve; AUC 0.84); performance of commonly available biomarkers (ANC, ESR, concentration of A1AT, CRP, and fibrinogen, and platelet count) validated on Cohort 2 (green curve; AUC 0.91); performance of extended set of clinically available biomarkers (commonly available biomarkers from green curve plus ALT and GGT) validated on Cohort 2 (blue curve; AUC 0.92) B). Performance of 11 biomarkers derived from Cohort 2 and validated on Cohort 1(red curve; AUC 0.93); performance of commonly available biomarkers validated on Cohort 1 (green curve; AUC 0.94); performance of extended set of clinically available biomarkers (commonly available biomarkers from green curve plus ALT and GGT) validated on Cohort 1 (blue curve; AUC 0.96).
Table 3. Pathway analysis of biomarkers that were significantly different (p<0.05) between KD and FC cohorts.
| Pathway | P value |
|---|---|
| Acute phase response | 5×10-11 |
| Hepatic cell activation | 1.1×10⁻⁷ |
| Coagulation system | 3.9×10⁻⁶ |
| IL-17 signaling | 3.5×10⁻⁵ |
| Communication between innate and adaptive immune cells | 6.9×10⁻⁵ |
| HIF1α signaling | 1×10⁻⁴ |
| Differential regulation of cytokine production in macrophages and T helper cell by IL-17 | 1.1×10⁻⁴ |
Reducing the panel size to six biomarkers to include only those analytes commonly available in the hospital laboratory (ANC, ESR, concentrations of A1AT, CRP, and fibrinogen, and platelet count) identified by the unsupervised clustering analyses of both Cohorts 1 and 2, the AUCs were 0.91 and 0.94 when tested on Cohorts 2 and 1 (Figures 3A and B, green curve). The addition of ALT and GGT, which are routinely acquired in the evaluation of possible KD patients, increased the AUC to 0.92 and 0.96, respectively (Figures 3A and B, blue curve). In a third, independent cohort (Cohort 3), the AUC was 0.80 if trained on Cohort 1 and 0.75 if trained on Cohort 2 using ANC, ESR, concentrations of A1AT, CRP, and fibrinogen and platelet count (Figure 4). This increased to an AUC of 0.83 and 0.81 when ALT and GGT were added.
Figure 4.
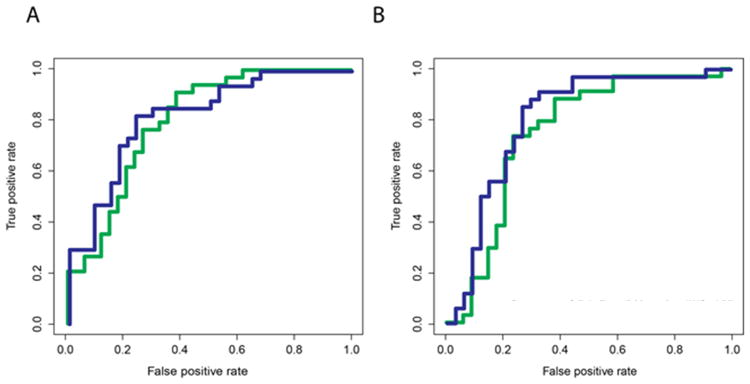
Receiver-operator characteristic curves for Random Forest models trained on Cohort 1 (A) or Cohort 2 (B) and validated on Cohort 3. Green curve: diagnostic performance of commonly available biomarkers (ANC, ESR, concentration of A1AT, CRP, and fibrinogen, and platelet count) (AUC 0.80 for Cohort 1 and AUC 0.83 for Cohort 2); Blue curve: diagnostic performance of commonly available biomarkers plus ALT and GGT (AUC 0.75 for Cohort 1 and 0.81 for Cohort 2).
Discussion
We found that a panel of biomarkers commonly available in the hospital laboratory (ANC, ESR, ALT, GGT, concentrations of A1AT, CRP, and fibrinogen, and platelet count) accurately diagnosed 81 to 96% of KD patients in a series of three independent cohorts. A central problem in the diagnosis of KD and the development of a diagnostic test is that the host response to inflammation involves pathways that are shared by many of the rash-fever illnesses that are in the differential diagnosis of KD, including adenovirus infection and scarlet fever (16). Thus, proper controls from children with rash-fever illnesses that mimic KD are essential to the development of a clinically useful diagnostic test. Previous studies have used either healthy children or children with febrile illnesses that do not mimic KD (such as pneumonia and bronchiolitis) as controls, thus ignoring the importance of pre-test probability in the evaluation of a diagnostic test. Indeed, 89-100% of the FCs used in the study were actually referred by outside medical providers for evaluation of possible KD. The selection of FCs with diseases that mimic KD is critical as it is this population in which the test will eventually be used in the clinical setting.
We focused on validating markers of inflammation that are readily available in most hospital laboratories. The goal is to have a panel of biomarkers with a rapid turn-around time in order to diagnose and treat KD in a timely fashion. The ANC, ESR, concentration of CRP, and platelet count, which were significant discriminators and common to both Cohorts 1 and 2, are routinely measured in children being evaluated for possible KD. To this group of markers we added ALT and GGT as our previous study demonstrated that ALT and GGT are associated with markers of cardiomyocte strain (NT-proBNP and ST-2) and thus in part related to oxidative stress during acute KD (17).
We recognize several strengths and weaknesses of this study. This is the first study to use unsupervised clustering of a panel of biomarkers to distinguish between febrile controls and children with acute KD. This study demonstrates promise for a group of commonly available laboratory tests in the diagnosis of KD, which will have wide applicability once validated. Limitations of this study include its small size and the absence of a gold standard for KD diagnosis. Echocardiography to rule out coronary artery dilatation in the FC subjects would be an additional safeguard against misclassification but was not practical in the ED setting (18, 19). While a Random Forest analysis reduces overfitting of the data and thus is thought to provide a highly accurate analysis of the data, the order of the variables that drives its predictions are not revealed and thus it is not possible to see how the biomarkers interrelate to lead to a diagnosis of KD. Thus, if validated, an online algorithm would have to be devised rather than a simple clinical decision rule.
Future studies will need to prospectively validate the 8- biomarker panel in additional independent cohorts and evaluate whether addition of other markers could improve the accuracy of diagnosing KD. Furthermore, future studies could assess if this panel can predict coronary artery abnormalities or IVIG-resistance. Thresholds for each individual marker will need to be determined that yield the best diagnostic accuracy. In addition, a prospective assessment of pre-test probability of KD will need to be included so that the positive and negative predictive value of the biomarker panel can be calculated.
Methods
Subjects
Acute KD samples were from children who met American Heart Association criteria and had banked acute plasma samples (EDTA and sodium citrate, obtained prior to IVIG) obtained within the first 10 days of illness (illness day 1 = first calendar day of fever) (2). The diagnosis of KD was established by one of two KD expert clinicians (AHT and JCB) at the KD Research Center according to an established protocol with standardized, prospective data collection.
FC subjects were previously healthy children who presented to the Emergency Department at Rady Children's Hospital San Diego with ≥ 3 days of fever and at least one of the clinical signs of KD: rash, conjunctival injection, cervical lymphadenopathy, erythematous oral mucosa, or erythematous or edematous hands or feet. The diagnoses of the FC subjects, adjudicated by chart review by two expert clinicians (JCB and JTK) after all culture and laboratory data were available, included viral and bacterial infections and systemic drug reactions (Table 2). We assembled 3 cohorts of sex- and age-matched (± 7 months, 1:1 matching) acute KD and FC subjects: 28, 44, and 30 subjects each in Cohorts 1, 2, and 3, respectively (Table 1). Of the FC subjects, 100% in Cohort 1, 91% in Cohort 2, and 89% in Cohort 3 were referred by primary care or non-pediatric emergency department physicians for evaluation of possible KD.
Table 2. Diagnoses of febrile controls.
| Diagnosis | Cohort 1 (n=28) | Cohort 2 (n=44) | Cohort 3 (n=30) |
|---|---|---|---|
| Bacterial infections | 4 | 6 | 11 |
| Scarlet fever | 3 | 1 | 0 |
| Staphylococcal scalded skin syndrome | 0 | 2 | 1 |
| Streptococcal pharyngitis | 1 | 1 | 1 |
| Pyelonephritis | 0 | 2 | 0 |
| Bacterial Adenitis | 0 | 0 | 5 |
| Othera | 0 | 0 | 4 |
| Viral infections | 24 | 38 | 17 |
| Measles | 0 | 1 | 0 |
| Adenovirus | 7 | 10 | 8 |
| Viral syndromeb | 16 | 22 | 0 |
| Epstein-Barr virus | 1 | 2 | 1 |
| Enterovirus | 0 | 3 | 1 |
| Influenza | 0 | 0 | 4 |
| Otherc | 0 | 0 | 3 |
| Drug reaction (total n) | 0 | 0 | 2 |
| Erythema multiforme | 0 | 0 | 1 |
| Steven Johnson syndrome | 0 | 0 | 1 |
Mycoplasma infection, sinusitis, MRSA bacteremia, pneumonia
Viral syndrome was defined as a self-limited, minor febrile illness with negative throat and/or rectal viral studies
Parainfluenza, primary herpes simplex infection, respiratory syncytial virus diagnosed by viral culture and direct fluorescence antibody detection.
Signed informed consent was obtained from the parents of all subjects, and child or adolescent assent was obtained as appropriate. The protocol was approved by the Institutional Review Board at UCSD and covered the use of all clinical data, the sampling of 12.5 ml of extra blood, and throat, nasopharyngeal, and rectal swabs for viral diagnosis.
For all subjects, we recorded age, sex, illness day at patient evaluation, and clinical laboratory data (Table 1). We normalized the hemoglobin concentration for age (zHgb) to allow valid comparisons across the age spectrum of our subjects (20). For KD subjects, we recorded response to IVIG and echocardiographic data. IVIG-resistance was defined as persistent or recrudescent fever (temperature ≥ 38°C) at least 36 hours after completion of the IVIG infusion (2 g/kg). Coronary artery status was defined by Z score normalized for body surface area for the left anterior descending and right coronary arteries, with normal defined as <2.5 standard deviation (SD) units and dilated as ≥ 2.5 SD from the mean, normalized for body surface area. An aneurysm was defined as focal dilation of an arterial segment >1.5 times the diameter of the adjacent segment (21).
Biomarker assay
A total of 88 protein analytes (Supplemental Table 1 (online)) in inflammatory and cardiovascular pathways were measured in Cohorts 1 and 2 using the Luminex antibody-coated bead system using a previously published methodology (Human Map, version 1.6, Rules Based Medicine Inc., Austin, TX). The dataset (Supplemental Table 1 (online)) used in this project can be downloaded from the iDASH repository (digital data repository based on open source MIDAS platform (San Diego, California)) by making a request to the authors for access (22). Enzyme-linked immunosorbent assays (ELISA) for human fibrinogen and alpha 1-antitrypsin (A1AT) were performed in Cohort 3 using commercially available kits (GenWay, San Diego, CA) following the manufacturer's instructions.
Statistical analysis
Demographic, clinical, and laboratory data were compared between KD and FC subjects using Wilcoxon rank sum test for continuous data and Fisher's exact and chi-square tests for categorical data. We assessed the differences in the demographic, clinical and laboratory data across the 3 KD cohorts and across the 3 FC cohorts using the Kruskal-Wallis test. We used two different approaches to devise a diagnostic test for KD: 1) unsupervised clustering of significant markers from the univariate analysis of the 88 candidate biomarkers or a smaller subset of markers commonly available from a hospital laboratory and 2) supervised clustering of these markers using a Random Forest model.
For each cohort, discriminating markers were selected using the Wilcoxon rank sum test setting the P value threshold at ≤0.05. A heatmap was created for each cohort using only the significant markers for that cohort. Unsupervised hierarchical clustering using Ward's method was performed on each cohort using the significant markers. Next, markers identified as significant from Cohort 2 were used to perform principal component analysis of Cohort 1 and, vice-versa. Supervised classification analysis was performed by training a Random Forest model, a machine-based learning method that works by constructing an ensemble of decision trees, on Cohort 1 and predicting the diagnosis of subjects in Cohort 2, and vice versa, and represented as receiver operator characteristic (ROC) curves (23). In each case, markers were selected for the training cohort from: a) all significant markers on heatmap or b) a subset of markers available in most hospital clinical laboratories that were significant in both cohorts (absolute neutrophil count (ANC), erythrocyte sedimentation rate (ESR), concentrations of A1AT, C-reactive protein (CRP), and fibrinogen, and platelet count). All analyses were performed using the R language and environment for statistical computing.
To characterize the canonical pathways in which the biomarkers were involved, protein biomarkers with P values <0.05 in the unsupervised clustering analysis from Cohorts 1 and 2 were mapped to known entries in the Ingenuity Pathway Analysis canonical pathway database.
Supplementary Material
Supplemental Table 2: List of 88 biomarkers
Acknowledgments
The authors wish to thank Nicki Daniels and the San Diego KD parents group who raised money to help fund this research.
Financial Support: This work was supported in part by grants from the David Gordon Louis Daniel Foundation (McLean, Virginia) to JCB, the Mario Battali Foundation (New York, New York) to JCB, the National Institutes of Health, National Heart, Lung, Blood Institute HL69413 (Bethesda, Maryland) to JCB, The Hartwell Foundation (Memphis, Tennessee) to AHT, and The Harold Amos Medical Faculty Development Program/Robert Wood Johnson Foundation (Indianapolis, Indiana) to AHT. Database supported by the National Institutes of Health (Betheseda, Maryland) through the NIH Roadmap for Medical Research, Grant U54HL108460.
References
- 1.Taubert KA, Rowley AH, Shulman ST. Nationwide survey of Kawasaki disease and acute rheumatic fever. J Pediatr. 1991;119:279–282. doi: 10.1016/s0022-3476(05)80742-5. [DOI] [PubMed] [Google Scholar]
- 2.Newburger JW, Takahashi M, Gerber MA, Gewitz MH, Tani LY, Burns JC, Shulman ST, Bolger AF, Ferrieri P, Baltimore RS, Wilson WR, Baddour LM, Levison ME, Pallasch TJ, Falace DA, Taubert KA. Diagnosis, treatment, and long-term management of Kawasaki disease: a statement for health professionals from the Committee on Rheumatic Fever, Endocarditis and Kawasaki Disease, Council on Cardiovascular Disease in the Young, American Heart Association. Circulation. 2004;110:2747–2771. doi: 10.1161/01.CIR.0000145143.19711.78. [DOI] [PubMed] [Google Scholar]
- 3.Wilder MS, Palinkas LA, Kao AS, Bastian JF, Turner CL, Burns JC. Delayed diagnosis by physicians contributes to the development of coronary artery aneurysms in children with Kawasaki syndrome. Pediatr Infect Dis J. 2007;26:256–260. doi: 10.1097/01.inf.0000256783.57041.66. [DOI] [PMC free article] [PubMed] [Google Scholar]
- 4.Tremoulet AH, Best BM, Song S, Wang S, Corinaldesi E, Eichenfield JR, Martin DD, Newburger JW, Burns JC. Resistance to intravenous immunoglobulin in children with Kawasaki disease. J Pediatr. 2008;153:117–121. doi: 10.1016/j.jpeds.2007.12.021. [DOI] [PMC free article] [PubMed] [Google Scholar]
- 5.Tsuchiya K, Imada Y, Aso S, Sonobe T. Diagnosis of incomplete Kawasaki disease. Nippon Rinsho. 2008;66:321–325. [PubMed] [Google Scholar]
- 6.Rowley AH. Incomplete (atypical) Kawasaki disease. Pediatr Infect Dis J. 2002;21:563–565. doi: 10.1097/00006454-200206000-00015. [DOI] [PubMed] [Google Scholar]
- 7.Sonobe T, Kiyosawa N, Tsuchiya K, Aso S, Imada Y, Imai Y, Yashiro M, Nakamura Y, Yanagawa H. Prevalence of coronary artery abnormality in incomplete Kawasaki disease. Pediatr Int. 2007;49:421–426. doi: 10.1111/j.1442-200X.2007.02396.x. [DOI] [PubMed] [Google Scholar]
- 8.Anderson MS, Todd JK, Glode MP. Delayed diagnosis of Kawasaki syndrome: an analysis of the problem. Pediatrics. 2005;115:e428–433. doi: 10.1542/peds.2004-1824. [DOI] [PubMed] [Google Scholar]
- 9.Newburger JW, Takahashi M, Beiser AS, Burns JC, Bastian J, Chung KJ, Colan SD, Duffy CE, Fulton DR, Glode MP, et al. A single intravenous infusion of gamma globulin as compared with four infusions in the treatment of acute Kawasaki syndrome. N Engl J Med. 1991;324:1633–1639. doi: 10.1056/NEJM199106063242305. [DOI] [PubMed] [Google Scholar]
- 10.Takeshita S, Kawamura Y, Takabayashi H, Yoshida N, Nonoyama S. Imbalance in the production between vascular endothelial growth factor and endostatin in Kawasaki disease. Clin Exp Immunol. 2005;139:575–579. doi: 10.1111/j.1365-2249.2005.02714.x. [DOI] [PMC free article] [PubMed] [Google Scholar]
- 11.Dahdah N, Siles A, Fournier A, Cousineau J, Delvin E, Saint-Cyr C, Spiegelblatt L, Bonny Y, Vartian M, Montigny M. Natriuretic peptide as an adjunctive diagnostic test in the acute phase of Kawasaki disease. Pediatr Cardiol. 2009;30:810–817. doi: 10.1007/s00246-009-9441-2. [DOI] [PubMed] [Google Scholar]
- 12.Yu HR, Kuo HC, Sheen JM, Wang L, Lin IC, Wang CL, Yang KD. A unique plasma proteomic profiling with imbalanced fibrinogen cascade in patients with Kawasaki disease. Pediatr Allergy Immunol. 2009;20:699–707. doi: 10.1111/j.1399-3038.2008.00844.x. [DOI] [PubMed] [Google Scholar]
- 13.Ishiguro A, Ishikita T, Shimbo T, Matsubara K, Baba K, Hayashi Y, Naritaka S, Nakahata T. Elevation of serum thrombopoietin precedes thrombocytosis in Kawasaki disease. Thromb Haemost. 1998;79:1096–1100. [PubMed] [Google Scholar]
- 14.Sakata K, Hamaoka K, Ozawa S, Niboshi A, Yahata T, Fujii M, Hamaoka A, Toiyama K, Nishida M, Itoi T. Matrix metalloproteinase-9 in vascular lesions and endothelial regulation in Kawasaki disease. Circ J. 2010;74:1670–1675. doi: 10.1253/circj.cj-09-0980. [DOI] [PubMed] [Google Scholar]
- 15.Kuo HC, Wang CL, Liang CD, Yu HR, Huang CF, Wang L, Hwang KP, Yang KD. Association of lower eosinophil-related T helper 2 (Th2) cytokines with coronary artery lesions in Kawasaki disease. Pediatr Allergy Immunol. 2009;20:266–272. doi: 10.1111/j.1399-3038.2008.00779.x. [DOI] [PubMed] [Google Scholar]
- 16.Barone SR, Pontrelli LR, Krilov LR. The differentiation of classic Kawasaki disease, atypical Kawasaki disease, and acute adenoviral infection: use of clinical features and a rapid direct fluorescent antigen test. Arch Pediatr Adolesc Med. 2000;154:453–456. doi: 10.1001/archpedi.154.5.453. [DOI] [PubMed] [Google Scholar]
- 17.Sato YZ, Molkara DP, Daniels LB, Tremoulet AH, Shimizu C, Kanegaye JT, Best BM, Snider JV, Frazer JR, Maisel A, Burns JC. Cardiovascular biomarkers in acute Kawasaki disease. Int J Cardiol. 2013;164:58–63. doi: 10.1016/j.ijcard.2011.06.065. [DOI] [PMC free article] [PubMed] [Google Scholar]
- 18.Bratincsak A, Reddy VD, Purohit PJ, Tremoulet AH, Molkara DP, Frazer JR, Dyar D, Bush RA, Sim JY, Sang N, Burns JC, Melish MA. Coronary Artery Dilation in Acute Kawasaki Disease and Acute Illnesses Associated with Fever. Pediatr Infect Dis J. 2012;31:924–926. doi: 10.1097/INF.0b013e31826252b3. [DOI] [PubMed] [Google Scholar]
- 19.Muniz JC, Dummer K, Gauvreau K, Colan SD, Fulton DR, Newburger JW. Coronary artery dimensions in febrile children without Kawasaki disease. Circ Cardiovasc Imaging. 2013;6:239–244. doi: 10.1161/CIRCIMAGING.112.000159. [DOI] [PubMed] [Google Scholar]
- 20.Gunn L, Nechyba C. The Harriet Lane Handbook. 16th. Mosby; Philadelphia: 2002. [Google Scholar]
- 21.Tremoulet AH, Jain S, Chandrasekar D, Sun X, Sato Y, Burns JC. Evolution of laboratory values in patients with Kawasaki disease. Pediatr Infect Dis J. 30:1022–1026. doi: 10.1097/INF.0b013e31822d4f56. [DOI] [PMC free article] [PubMed] [Google Scholar]
- 22.Ohno-Machado L, Bafna V, Boxwala AA, Chapman BE, Chapman WW, Chaudhuri K, Day ME, Farcas C, Heintzman ND, Jiang X, Kim H, Kim J, Matheny ME, Resnic FS, Vinterbo SA, i Dt iDASH: integrating data for analysis, anonymization, and sharing. J Am Med Inform Assoc. 2012;19:196–201. doi: 10.1136/amiajnl-2011-000538. [DOI] [PMC free article] [PubMed] [Google Scholar]
- 23.Breiman L. Random Forests. Machine Learning. 2001;45:5–32. [Google Scholar]
Associated Data
This section collects any data citations, data availability statements, or supplementary materials included in this article.
Supplementary Materials
Supplemental Table 2: List of 88 biomarkers