

Abstract
Background
Eating habits are developed during the preschool years and track into adulthood, but few studies have quantified dietary quality of meals packed by parents for preschool children enrolled in early care and education centers.
Objective
Our aim was to evaluate the dietary quality of preschoolers’ sack lunches using the Healthy Eating Index (HEI) 2010 to provide parents of preschool children with guidance to increase the healthfulness of their child’s lunch.
Design
This study is a cross-sectional analysis of baseline dietary data from the Lunch Is in the Bag trial.
Participants
A total of 607 parent–child dyads from 30 early care and education centers in Central and South Texas were included.
Main outcome measures
Total and component scores of the HEI were computed using data obtained from direct observations of packed lunches and of children’s consumption.
Statistical analysis
Three-level regression models with random intercepts at the early care and education center and child level were used; all models were adjusted for child sex, age, and body mass index (calculated as kg/m2).
Results
Mean HEI-2010 total scores were 58 for lunches packed and 52 for lunches consumed, out of 100 possible points. Mean HEI component scores for packed and consumed lunches were lowest for greens and beans (6% and 8% of possible points), total vegetables (33% and 28%), seafood and plant proteins (33% and 29%), and whole grains (38% and 34%); and highest for empty calories (85% and 68% of possible points), total fruit (80% and 70%), whole fruit (79% and 64%), and total protein foods (76% and 69%).
Conclusions
Parents of preschool children pack lunches with low dietary quality that lack vegetables, plant proteins, and whole grains, as measured by the HEI. Education of parents and care providers in early care and education centers is vital to ensure that preschoolers receive high dietary-quality meals that promote their preference for and knowledge of a healthy diet.
Keywords: Early care and education, Sack lunch, Preschool children, Healthy Eating Index (HEI), Parents
The high prevalence of overweight and obesity among young children is a public health concern. In the United States, one of every four children aged 2 to 5 years is overweight or obese.1 Dietary factors have been established as significant predictors of weight in preschool-aged children,2 where the diet of overweight and obese children is characterized by a high consumption of energy-dense snack foods and meals.3,4 Dietary intakes that include low-nutrient, high-energy-dense foods can limit children’s intake and preference for fruits, vegetables, and whole grains.3,5-7 In addition, research has shown that food preferences and eating habits developed during preschool years have a significant impact on diet quality in adulthood.4,8,9 Early food-related experiences could define future dietary patterns and health consequences, 4,10 and early food preferences are influenced by exposure to food.11-14 Therefore, experiences such as eating in early childhood education centers can play an important part in determining future food preferences.12,15
Compliance with nutritional guidelines can be used to evaluate and recommend food groups and portion sizes to parents of preschool children. Studies have reported that preschooler’s sack lunches do not meet the dietary recommendations of the Institute of Medicine’s Dietary Reference Intakes.16 Another study analyzed the foods offered by early care and education centers in North Carolina and found that preschoolers’ lunches, on average, did not meet dietary guidelines.17 Sweitzer and colleagues16 demonstrated that parents are aware that lunch provides an important opportunity to receive nutrients for the day; however, most packed lunches do not meet the dietary recommendations for preschool children.18,19
Preschoolers’ diets at early care and education centers can be evaluated by comparing the meals to guidelines such as Choose MyPlate from the US Department of Agriculture (USDA), the Dietary Reference Intakes from the Institute of Medicine, and dietary indices, such as the Healthy Eating Index (HEI).20-22 The HEI-2010 has proven to be a valid and reliable method to determine compliance with dietary guidelines.22 Specifically, using the HEI to evaluate the dietary quality of preschoolers’ lunches provides several advantages for research purposes. Dietary data are usually not easily represented by a normal curve; however, when diets and meals are analyzed with the HEI-2010, the resulting data resemble a Gaussian distribution. Several studies report the validity and reliability of the HEI-2010 as a measure of dietary quality for populations, thereby supporting the proposition that the HEI-2010 can be used to accurately measure dietary quality22 and is suitable for use with complicated statistical models, including hierarchical data. Several studies have used the HEI-2010 to evaluate the overall diets as well as particular meals for preschoolers, and have shown that it is a valid method in this context.17,23
The aim of this study was to measure and evaluate the dietary quality of preschoolers’ sack lunches using the HEI-2010. The individual food components of the lunches packed by parents and consumed by their child were analyzed to determine differences in dietary quality. To our knowledge, this was the first study to utilize the HEI-2010 to measure the dietary quality of lunches packed by parents and consumed by preschool children.
MATERIALS AND METHODS
Study Design
The present study is based on cross-sectional dietary data from the baseline measures in the Lunch Is in the Bag trial (D. M. Hoelscher, PhD, RD, LD, CNS, unpublished data, 2015). The objective of the multilevel behavior-based Lunch Is in the Bag intervention is to prompt parents to pack at least one serving each of fruits, vegetables, and whole grains in preschool children’s lunches. The Lunch Is in the Bag trial methodology and study design have been described in detail elsewhere (D.M. Hoelscher, PhD, RD, LD, CNS, and C. Roberts-Grey, unpublished data, 2015).24
Study Population
A total of 30 early care and education centers in three metropolitan areas of Central and South Texas that were licensed by the Texas Department of Family and Protective Services enrolled at least 15 preschool children and required parents to provide packed lunches participated in the study. Early care and education participation was confirmed with written consent from the center’s director. Parent–child dyads were the unit of analysis. The parent–child dyads were formed by the family member who is primarily responsible for packing the child’s lunch and the 3- to 5-year-old child who regularly ate lunch at a participating early care and education center. Parents provided written consent for their participation and their child’s participation in the study. One parent–child dyad per family was invited to join the study, and a total of 607 parent–child dyads participated in the study. All measurements and procedures were approved by the Institutional Review Boards at UTHealth/UT Health Science Center Houston and the University of Texas at Austin.
Measures and Data Collection
This study utilized baseline data from 607 parent–child dyads across the 30 early care and education centers. Baseline measures included demographic information for parents and children, child weight status, and the dietary observations of packed lunches and child consumption of the lunch foods on two randomly selected nonconsecutive weekdays.24
Demographic Measures
Each parent completed a demographic questionnaire, including race/ethnicity, sex, birthdate, and marital status. In addition, parents selfreported their own height and weight to enable researchers to calculate body mass index (BMI; calculated as kg/m2). Child height and weight were measured at the early care and education center by a trained research team using standardized methods and equipment.25
Lunchbox Observations
Observers were trained by a registered dietitian nutritionist to recognize foods commonly found in preschooler’s lunches and visually estimate amounts in standard measuring units (eg, cups, pieces, or ounces).24 Before lunchtime, and without the children present, the trained observers recorded in detail the type and amount of foods and beverages present in the lunchboxes. Observers collected the data in as much detail as possible; for example, the individual ingredients of “mixed dishes” were recorded with estimated amounts for each ingredient and for the total dish.
Child Lunch Observations
During lunchtime, the trained observers recorded the amount of each item consumed by the child, using a standard procedure.24 The amount consumed was reported with the same units as the amount packed and, when possible, as percent consumed. Both lunchbox observation and child lunch observation for each child were conducted for 2 randomly selected nonconsecutive days.24
The Food Intake and Analysis System (Millenium, UT-Houston School of Public Health, Houston TX, 2000) was used for coding, entering, and calculating the nutrient analysis from each food record. The Food Intake and Analysis System utilizes the Food and Nutrient Databases published by the USDA’s Food Surveys Research Group26 and uses the USDA food coding system that enables the linking of the food records from Lunch Is in the Bag trial with the MyPyramid Equivalents Database (version 2.0 for USDA Survey Foods, 2003-2004).22 The MPED coding system can in turn be used to calculate the HEI-2010 component and total scores.22,27 Research has shown that preschooler’s intake is directly correlated with the amount of food served.28,29 Analyzing meals that parents packed for their preschool children with the HEI-2010 automatically corrects for the amount of food present by using an energy density approach. For this study, the HEI-2010 was calculated for the 1,196 meals that were recorded at baseline and used to evaluate the dietary quality of the preschoolers’ sack lunches that parents packed, as well as the portion consumed by the child.
The HEI was developed to measure compliance of diets and meals with the USDA Dietary Guidelines.22 The current version, HEI-2010, has been updated from the HEI-2005 to reflect the 2010 Dietary Guidelines for Americans (DGA).27 This index uses an energy-density approach to evaluate diets and meals against set standards. To control for the size and amount of food present, all the HEI-2010 components are reported in functions of 1,000 kcal. The HEI-2010 total score (range=0 to 100) is computed by adding 12 component scores with different maximum values. The first nine components measure adequacy; higher component scores indicate larger amounts of each type of food or nutrient present per 1,000 kcal. The adequacy components are total fruit, whole fruit, total vegetables, greens and beans, whole grains, dairy, total protein foods, seafood and plant proteins, and fatty acid ratio. The remaining three components represent foods that should be served in moderation and are called moderation components; these are reverse-coded in order to reflect higher dietary quality when smaller portions of each type of food or nutrient are present per 1,000 kcal. The moderation components are refined grains, sodium, and empty calories. Calculations and codes for the correct allocation of food groups and computation of the HEI-2010 component scores are published by the US Department of Agriculture.30
Quality-Control Procedures
A registered dietitian nutritionist reviewed the data for all lunchbox observations and child lunch observations at baseline to ensure that types and amounts of foods were accurately coded; this process was done in four stages. First, lunchbox observation and child lunch observation raw data were reviewed and cleaned to ensure that serving sizes were accurate before initiating the data-entry process. Observers were also trained in the correct use of the database in order to accurately code and enter all food items. A second round of data cleaning was necessary to certify that all food items had been entered and categorized correctly. Third, quality-control checks were completed for 100% of all dietary measurements for baseline. Finally, all food items were pulled from the database and a separate Excel (2013, Microsoft) spreadsheet was created and reviewed to ensure consistent coding of food item names and serving sizes.
Data Analysis
All data were analyzed using SAS software (version 9.4, 2013, SAS Institute, Inc). Descriptive and central tendency statistics were obtained to describe the sample and examine the distribution of each variable. To account for nonindependence and potential clustering of observations, three-level regression models with random intercepts at the child and early care and education levels were employed to model outcomes. Regressions were also adjusted for possible confounding from child sex, age, and BMI. Regression-adjusted means for each HEI-2010 component score for packed in lunches (measured in lunchbox observation) were derived from these models. Similarly, regressed means for each HEI-2010 component score for food consumed (measured during child lunch observation) were determined. Subsequently, adjusted means for lunchbox observation and child lunch observation were compared to determine whether the HEI-2010 component and total scores of the lunch consumed were significantly different from those of the lunch packed.
RESULTS
The mean age of parents in the sample was 36.5 years; almost 90% of the parents included in the study were female, with 57% of the sample with an annual family income >$100,000 (Table 1). Mean age of children was 3.5 years, and most of the children (70%) were within the healthy BMI category (5th to 85th percentile).31
Table 1.
Parent and child demographicsa from the Lunch Is in the Bag Trial
| Demographics | |
|---|---|
| Child | |
| Age, y; mean±SDb | 3.51±0.69 |
| Calculated BMIc percentile; mean±SD | 56.79±29.99 |
| BMI categories; n (%) | |
| Underweightd | 32 (5.54) |
| Healthy weighte | 416 (71.97) |
| Overweightf | 75 (12.98) |
| Obeseg | 55 (9.52) |
| Race; n (%) | |
| White | 367 (66.01) |
| Hispanic | 105 (18.88) |
| Other | 84 (15.11) |
| Sex; n (%) | |
| Boy | 315 (52.33) |
| Parent | |
| Age, mean±SD | 36.51±5.42 |
| Calculated BMI; mean±SD | 24.76±5.07 |
| BMI categories; n (%) | |
| Underweighth | 15 (2.75) |
| Healthy weighti | 327 (60.00) |
| Overweightj | 127 (23.30) |
| Obesek | 76 (13.94) |
| Sex; n (%) | |
| Female | 499 (89.75) |
| Race; n (%) | |
| White | 396 (71.74) |
| Hispanic | 98 (17.75) |
| Other | 58 (10.51) |
| Annual family income, $; n (%) | |
| <59,999 | 92 (17.43) |
| 60,000 to 79,999 | 52 (9.85) |
| 80,000 to 99,999 | 83 (15.72) |
| >100,000 | 301 (57.01) |
| Highest level of education; n (%) | |
| Some college or less | 96 (13.30) |
| Associate or bachelor’s degree | 274 (49.37) |
| Masters or doctorate degree | 185 (33.33) |
| Marital status; n (%) | |
| With partner | 503 (91.12) |
Numbers for different outcome measures may vary due to missing values.
SD=standard deviation.
BMI=body mass index; calculated as kg/m2.
<5th BMI percentile.
≥5th to <85th BMI percentile.
≥85th to <95th BMI percentile.
≥95th BMI percentile.
BMI >18.5.
BMI 18.5 to 24.9.
BMI 25 to 29.9.
BMI ≥30.
The HEI-2010 component scores were derived from lunchbox observation and child lunch observation dietary data as mean HEI total and component scores, estimated from multilevel regression models adjusted for confounders (Table 2). Across the 607 children, the HEI-2010 mean total score for lunches packed was 58 of 100 possible points, with a range from 14 to 92; the HEI-2010 mean total score for lunches consumed was 52 and ranged from 0 to 95. Mean scores for each of the HEI-2010 component scores of lunches packed were different from those of the meals consumed except for fatty acids and sodium (P<0.05).
Table 2.
Regressed means for Healthy Eating Index 2010 component and total scores for lunches from in the Lunch Is in the Bag trial that were packed by parents and consumed by their preschool child (n=607 children)
| HEIa-2010 component (maximum points) | HEI standard for maximum score | Packed | Consumed |
|---|---|---|---|
| ←meanb±standard error→ | |||
| Adequacy | |||
| Total vegetablesc (5) | ≥1.1-c equivalent per 1,000 kcal | 1.67±0.09 | 1.39±0.09** |
| Greens and beansc (5) | ≥0.2-c equivalent per 1,000 kcal | 0.39±0.04 | 0.29±0.04* |
| Total fruitd (5) | ≥0.8-c equivalent per 1,000 kcal | 4.02±0.14 | 3.5±0.14** |
| Whole fruite (5) | ≥0.4-c equivalent per 1,000 kcal | 3.94±0.17 | 3.21±0.17** |
| Whole grains (10) | ≥1.5-oz equivalent per 1,000 kcal | 3.82±0.25 | 3.36±0.25** |
| Dairyf (10) | ≥1.3-c equivalent per 1,000 kcal | 6.22±0.2 | 5.73±0.2** |
| Total protein foodsg (5) | ≥2.5-oz equivalent per 1,000 kcal | 3.79±0.11 | 3.46±0.11** |
| Seafood and plantg proteinsh (5) | ≥0.8-oz equivalent per 1,000 kcal | 1.67±0.15 | 1.45±0.15** |
| Fatty acidsi (10) | (PUFAsj+MUFAsk)/SFAsl >2.5 | 4.34±0.17 | 4.56±0.17 |
| Moderation | |||
| Sodium (10) | ≤1.1 g per 1,000 kcal | 5.13±0.21 | 5.37±0.21 |
| Refined grains (10) | 0≤1.8-oz equivalent per 1,000 kcal | 6.05±0.18 | 6.36±0.18* |
| Empty caloriesm (20) | ≤19% of energy | 16.94±0.2 | 13.59±0.2** |
| Total score (100) | Sum of component scores=100 | 58.01±0.93 | 52.32±0.93** |
HEI=Healthy Eating Index.
Regressed mean and standard error adjusted to control for cluster effect at the school and child level; as well as child age, sex, and body mass index.
Includes any beans and peas not counted as total protein foods.
Includes fruit juice.
Includes all forms except juice.
Includes all milk products and derivatives.
Beans and peas included when the total protein foods standards was not met.
Includes seafood, nuts, seeds, and soy products; also beans and peas counted as total protein foods.
Ratio of polyunsaturated fatty acids and monounsaturated fatty acids to saturated fatty acids.
PUFA=polyunsaturated fatty acid.
MUFA=monounsaturated fatty acid.
SFA=saturated fatty acid.
Calories from solid fats and added sugars.
Significant at the P<0.05 level.
Significant at the P<0.001 level.
The HEI-2010 standards used to determine whether a meal or diet should receive the maximum total and component scores as well as the standard used to determine which would receive a score of 0 are available elsewhere. 27 The number and percent of meals (packed and consumed) that achieved the maximum possible scores for each of the HEI-2010 individual components, as well as maximum total score, are reported in Figure 1. All HEI-2010 scores are expressed in units per 1,000 kcal. Only 1 in 10 of the meals packed and consumed had the recommended amount of greens and beans. More than 80% of the sample did not provide or consume the recommended amount of vegetables. Approximately 70% of the sample did not pack or eat enough whole grains and seafood and plant proteins to achieve the maximum scores, and 60% to 70% of the meals (packed and consumed) included higher than the recommended amounts of refined grains, sodium, and saturated fats. In contrast, 50% of the lunches packed and consumed included the recommended amounts of dairy and total protein foods and achieved a perfect score for empty calories (<19% of energy from empty calories), and most of the meals packed (70%) included the recommended amounts of total and whole fruits.
Figure 1.
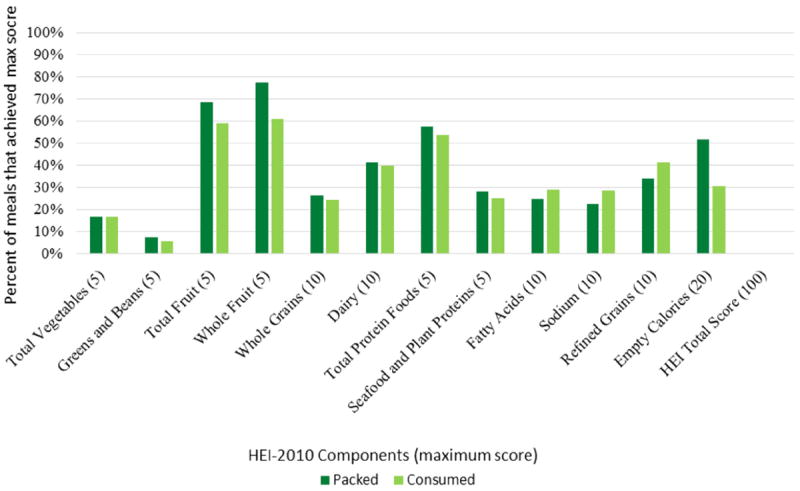
Percent of meals from the Lunch Is in the Bag trial packed by parents and consumed by their preschool child that achieved maximum score for Health Eating Index 2010 components or total scores (n=1,196 meals).
Similarly, the number and percent of meals with a score of 0 for each HEI-2010 individual component and total score are reported in Figure 2. Where 49% of meals packed did not include any vegetables, >90% did not include any greens, beans, or peas. Parents were likely to pack fruit, because only 7% of parents packed no fruit at all; however, when only whole fruit (not fruit juice) was evaluated, 14% of parents did not pack fruit. Almost half of the meals packed (48%) did not include any whole grains, and 18% of the meals packed had no dairy items included. Only 14% of the meals packed did not include any protein foods, but 60% of the meals did not include any seafood and plant proteins specifically. Poly-and monounsaturated-to-saturated fat ratio compliance was also low, with 30% of lunches packed with a ratio <1.2. For the HEI components that represent nutrients and foods to consume in moderation, 25% of lunches packed had >2 g sodium/1,000 kcal, 17% had >4.3 equivalents of refined grains/1,000 kcal, and only 1.2% of the meals packed included >50% of energy from empty calories. Percent of meals consumed with a score of 0 for each HEI-2010 individual component and total scores were consistently higher than the percent of meals packed.
Figure 2.
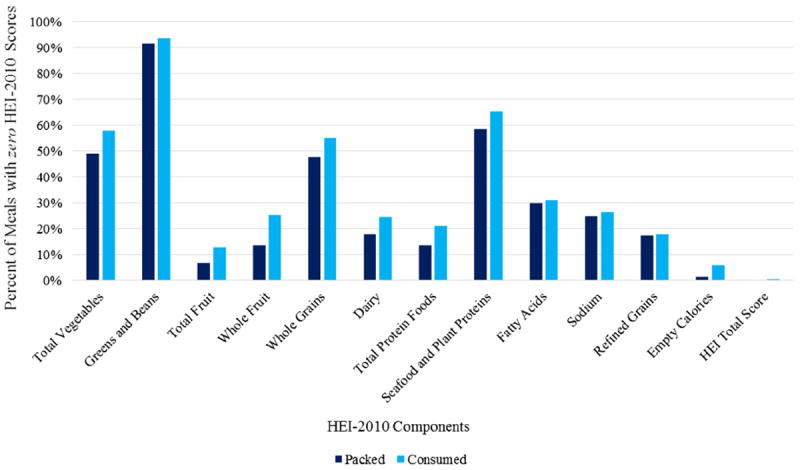
Percent of meals from the Lunch Is in the Bag trial packed by parents and consumed by their preschool child that scored zero for Health Eating Index 2010 component or total scores (n=1,196 meals).
Table 3 illustrates examples of lunches and their individual food items that represent the highest HEI-2010 total scores, the mean HEI-2010 total scores, and the lowest HEI-2010 total scores. Individual food items packed for lunches with high, mean, and low HEI-2010 total and component scores provide an insight into the type of foods that parents pack, as well as the corresponding HEI-2010 score. As evidenced by the HEI-2010 total score of the meals in Table 3, the lunch for a preschool child with a high score includes food items usually associated with foods readily consumed by preschool-aged children. Although Lunch 1 included mostly healthful foods, the child who was offered this lunch only consumed 50% of some items, therefore reducing the HEI-210 total score from 90.21 to 78.97. In turn, Lunch 2 was an example of a packed lunch with a score of 86.93, which was increased to 91.11, given the foods that the child chose to consume. Lunches 3 and 4 illustrate how missing one or two food groups in a child’s lunch would significantly decrease the HEI-2010 total score. Examples of the lowest HEI-2010 total scores include Lunches 5 and 6. Lunch 5 includes convenience foods in individual packaging, which is a trend seen in parentpacked sack lunches. Those food items are high in energy density and low in nutrient density. Lunch 5 also lacked fruits, vegetables, and whole grains. All the examples in Table 3 demonstrate the individual HEI-2010 components that can be improved in the lunches packed by parents, which would in turn increase the nutritional quality of the overall diet of these children.
Table 3.
Examples of individual food items packed in lunches from the Lunch Is in the Bag trial with high, mean, and low Healthy Eating Index 2010 total scores
| Food item | Amount packed | % Consumed | HEIa Total Score
|
HEI Total Score
|
|---|---|---|---|---|
| Packed | Consumed | |||
| Lunches with high HEI scores | ||||
| Lunch 1 | ||||
| Banana | 1 large (8 to 8.8 in) | 0 | ||
| Sandwich | ||||
| Whole-grain bread | 1 slice | 50 | ||
| Nut butter | 1 tbsp | 50 | ||
| Jelly | 1 tbsp | 50 | 90.21 | 78.97 |
| Applesauce | 4 oz | 0 | ||
| Crackers | 2 pieces | 50 | ||
| Milk | 8 fl oz | 50 | ||
| Carrots, raw | 1 c | 0 | ||
| Lunch 2 | ||||
| Turkey, deli | 0.5 slices | 10 | ||
| Mozzarella stick | 0.5 oz | 0 | ||
| Apple, raw | 3 slices | 33 | ||
| Corn, cooked | 0.5 c | 80 | 86.93 | 91.11 |
| Sandwich | ||||
| Whole-grain bread | 2 slices | 25 | ||
| Nut butter | 2 tbsp | 25 | ||
| Milk | 9 fl oz | 11 | ||
| Lunches with mean HEI scores | ||||
| Lunch 3 | ||||
| Fruit cup, cocktail | 4 oz | 100 | ||
| Sandwich | ||||
| Whole-grain bread | 2 slices | 75 | ||
| 57.97 | 57.38 | |||
| Turkey, deli | 3 slices | 75 | ||
| Cheese | 1 slices | 75 | ||
| 100% Fruit juice | 4.23 fl oz | 100 | ||
| Potato chips, baked | 0.74 oz | 100 | ||
| Lunch 4 | ||||
| Whole-grain bread | 1 slice | 100 | ||
| Pear, raw | 0.5 c | 0 | ||
| Multigrain cracker | 0.5 c | 90 | ||
| 57.97 | 46.34 | |||
| Weiner | 1.5 pieces | 100 | ||
| Mozzarella stick | 1 stick | 100 | ||
| Hummus | 2 tbsp | 75 | ||
| Fruit-flavored drink | 6.75 fl oz | 100 | ||
| Lunches with low HEI scores | ||||
| Lunch 5 | ||||
| Fruit-flavored drink | 6.75 fl oz | 100 | ||
| Beef jerky | 0.28 oz | 100 | ||
| Tomato ketchup | 1 tbsp | 100 | ||
| Pita wrap | ||||
| 20.63 | 20.63 | |||
| Pita bread | 1 large piece | 100 | ||
| Egg | 0.25 c | 100 | ||
| Bacon | 1 tbsp | 100 | ||
| Cheese | 1 tbsp | 100 | ||
| Fruit snacks (gummy) | 0.8 oz | 100 | ||
| Lunch 6 | ||||
| Yogurt-covered pretzels | 5 pieces | 100 | ||
| Milk, low-fat | 1 c | 100 | ||
| Fried cheese sticks | 5 pieces | 100 | 15.42 | 15.42 |
| Handi-Snackb | ||||
| Bread sticks, hard | 8 pieces | 100 | ||
| Cheese | 2 tbsp | 100 |
HEI=Healthy Eating Index.
Kraft Foods.
DISCUSSION
In this cross-sectional analysis of lunches packed by parents and consumed by their preschool children at early care and education centers, we found shortfalls of key food groups and nutrients recommended by the DGA and the Scientific Report of the 2015 Dietary Guidelines Advisory Committee. The HEI-2010 component scores for this sample (Table 2) are comparable to the component scores reported for the diets of the National Health and Nutrition Examination Survey data.22 Erinosho and colleagues17 found that schools offered meals lacking vegetables (dark and green, orange vegetables and legumes), total grains and whole grains, meats and beans, oils, and foods low in saturated fat, solid fat, and added sugars.17 Measurement of dietary quality with the HEI-2010 allows for the comparison of parent-packed lunches to those provided by early care and education centers. In the current study, the mean component scores suggest that parents are packing lunches that lack total vegetables, greens and beans, whole grains, and seafood and plant proteins, and include foods high in saturated fat, sodium, and empty calories. Although the mean total score of this sample at lunch is similar to the population mean score for the overall diet, previous studies suggest that parent-packed sack lunches are an easy target to improve preschooler’s diets.19 With knowledge of the specific components for which parents are scoring high or low, health providers can craft messages that can promote the availability of specific foods in order to increase the dietary quality of the lunch.
Results from this study demonstrate that, when compared to the scores for lunches packed by parents, children are consuming lunches that have significantly lower component scores for total vegetables, greens and beans, total and whole fruit, whole grains, dairy, total protein, and seafood and plan proteins, as well as significantly lower scores for empty calories. Because sodium, refined grains, and empty-calorie components are reverse-coded, lunches with lower amounts of those foods per 1,000 kcal have higher scores for those HEI-2010 components. The overall dietary quality of the meals consumed by preschoolers is significantly lower than that of the meals packed. These data suggest that nutrition education for teachers and parents is necessary to increase the dietary quality of the meals offered and consumed at lunch in early care and education centers.
In order to further illustrate parent-packing behavior, the number of meals that achieved the maximum score for each of the HEI-2010 components and total scores were evaluated. Findings suggest that parents need more guidance regarding the types and amounts of foods they are packing in their preschooler’s sack lunches. None of the parent-packed lunches and, consequently, none of the meals consumed, achieved 100 of 100 points in the HEI-2010 total score. The number of consumed meals that scored full points for the different HEI-2010 component scores differs, depending on type and amount of individual food items that children choose to consume. Evaluating lunches with the HEI-2010 individual components is an accurate way to determine areas of opportunity to increase the dietary quality of preschooler’s sack lunches. The evaluation of the HEI-2010 total and component scores demonstrates that the dietary quality of the meal can be significantly impacted by the type and amount of food consumed. A lunch with a high total packed score can be recorded as lower consumed score if the child does not consume a particular food group, such as dairy, or chooses to consume items that equate to >50% of energy from empty calories.
Parents are responsible for packing nutritious lunches that are adequate for their child’s consumption. But other factors influence the food that is ultimately offered to the child; for example, the early care and education center policies. We found that some early care and education centers banned items, such as sugar-sweetened beverages, and teachers would not offer those items if they were present in the lunch. We also observed that some teachers chose which food items to present to their students or would sometimes encourage the child to eat or finish certain foods.
Two components of the HEI-2010 that are easy to miss, as evidenced by this sample, are greens and beans and seafood and plant proteins. The reason derives from the calculation of the HEI, where beans are allocated first to total protein and seafood and plant protein, until total protein=5 and seafood and plant protein=5: then beans count toward total vegetables and greens and beans. Therefore, the component score for greens and beans depends on the total amount of protein present in the meal or diet. The same method is applied to seafood and plant proteins, where a nut butter would only count toward this component until total protein=5. This knowledge can be used to determine that parents might not be aware that replacing animal proteins with plant proteins would result in a lower HEI-2010 total score unless they add enough to meet both the total protein and total vegetable requirements. To illustrate: 1 oz of meat, 1 egg, 1 tablespoon of nut butter, ¼ cup of cooked dry beans, or ¼ oz of nuts or seeds represent a 1-oz equivalent. A 1,000-kcal lunch with 2 tablespoons of nut butter or ½ cup of cooked dry beans or ½ oz of nuts or seeds would have enough to achieve a perfect score for total protein and seafood and plant protein.
Examples of meals with the highest, mean, and lowest scores were analyzed to clarify the specific food items and amounts that parents pack for their preschool child. These data are vital to demonstrate to parents of preschool children that it is not impossible, but actually quite easy, to pack a high-quality lunch that meets the recommendations for a healthy diet. Educated care providers could guide parents on the food items that will provide the highest dietary quality. For example, food items that deducted points because of the sodium and saturated fat content should be discouraged. The proportion of food groups and nutrients per 1,000 kcal is modified depending on the child’s consumption of the items in the lunch. Therefore, teacher’s input could increase the overall HEI-2010 score of the meal packed resulting in a higher dietary quality of the meal consumed. Lunches where the child consumed 100% of the food packed might encourage parents to continue sending the same food items. But continuous exposure to other food would increase the likelihood of the child eventually consuming them.13 Parents should be advised to pack a healthful lunch and not be discouraged if the child does not consume all of it.
The large variability of center policies and teacher behaviors are limitations of this study, because they are not accounted for in the analysis. Given the large datacollection burden from the Lunch Is in the Bag trial, dietary records could not include differences between food items intentionally packed for snacks vs lunch or whether or not the child was presented with all food items at lunch. In addition, the presence and use of refrigerators and microwaves in the classroom varied from center to center as well as from classroom to classroom. Nevertheless, careful training and evaluation of trained observers ensured a high level of accuracy and the detail of observed food records, and the results and conclusions of this study should be robust. Collaboration between early care and education centers, parents, and teachers would be beneficial to promote children’s consumption of healthier lunches. Early care and education center policies could guide parents on foods to pack and teachers could enforce said policies. An informal survey was conducted in Central and South Texas to determine which early care and education centers could be invited to participate in the Lunch Is in the Bag trial. In our experience, early care and education centers that cared for children with lower socioeconomic status would have supplemental assistance, such as the Child and Adult Care Food Program or Head Start. Therefore, these centers would not require parents to send complete lunches from home. More research on lower-income populations is needed to determine the generalizability of this study.
CONCLUSIONS
The dietary quality of preschoolers’ sack lunches packed by their parents is low when measured with the HEI-2010. The HEI-2010 can be used to research the areas of opportunity where parents need reinforcement in order to follow the DGA. Even though these lunches are not hot meals, such as prepared by many early care and education centers, parents can easily follow the HEI-2010 components. For example, it is very common to find fruit in preschooler’s lunches, but there seems to be a lack of knowledge or motivation to pack vegetables, greens and beans, and seafood and plant proteins, among other things. Vegetables can easily be served to children as either raw or as leftovers from the previous night’s dinner meal. These findings illustrate the need for more information about the DGA, as well as examples of meals that would represent high dietary quality. Education of parents, educators, and care providers in early care and education centers is vital to ensure that preschoolers receive high-dietary-quality meals that will promote their preference and knowledge of a healthy diet they grow and develop.
Acknowledgments
FUNDING/SUPPORT
Funding for this study was made possible by the National Cancer Institute (National Cancer Institute/National Institutes of Health grant R01CA149643) and the Michael and Susan Dell Foundation through the Michael and Susan Dell Center for Healthy Living. The content is solely the responsibility of the authors and does not necessarily represent the official views of the National Cancer Institute, the National Institutes of Health, or the Michael and Susan Dell Foundation.
Footnotes
STATEMENT OF POTENTIAL CONFLICT OF INTEREST
No potential conflict of interest was reported by the authors.
References
- 1.Ogden CL, Carrol MD, Kit BK, Flegal KM. Prevalence of childhood and adult obesity in the United States, 2011-2012. JAMA. 2014;311(8):806–814. doi: 10.1001/jama.2014.732. [DOI] [PMC free article] [PubMed] [Google Scholar]
- 2.Te Velde S, Van Nassau F, Uijtdewilligen L, et al. Energy balance-related behaviours associated with overweight and obesity in preschool children: A systematic review of prospective studies. Obes Rev. 2012;13(suppl 1):56–74. doi: 10.1111/j.1467-789X.2011.00960.x. [DOI] [PubMed] [Google Scholar]
- 3.Kranz S, Smiciklas-Wright H, Siega-Riz AM, Mitchell D. Adverse effect of high added sugar consumption on dietary intake in American preschoolers. J Pediatr. 2005;146(1):105–111. doi: 10.1016/j.jpeds.2004.08.077. [DOI] [PubMed] [Google Scholar]
- 4.Singer MR, Moore LL, Garrahie EJ, Ellison RC. The tracking of nutrient intake in young children: The Framingham Children’s Study. Am J Public Health. 1995;85(12):1673–1677. doi: 10.2105/ajph.85.12.1673. [DOI] [PMC free article] [PubMed] [Google Scholar]
- 5.Haire-Joshu D, Elliott MB, Caito NM, et al. High 5 for Kids: The impact of a home visiting program on fruit and vegetable intake of parents and their preschool children. Prev Med. 2008;47(1):77–82. doi: 10.1016/j.ypmed.2008.03.016. [DOI] [PMC free article] [PubMed] [Google Scholar]
- 6.Dehghan M, Akhtar-Danesh N, Merchant AT. Childhood obesity, prevalence and prevention. Nutr J. 2005;2(4):24. doi: 10.1186/1475-2891-4-24. [DOI] [PMC free article] [PubMed] [Google Scholar]
- 7.O’Connor TM, Yang SJ, Nicklas TA. Beverage intake among preschool children and its effect on weight status. Pediatrics. 2006;118(4):e1010–e1018. doi: 10.1542/peds.2005-2348. [DOI] [PubMed] [Google Scholar]
- 8.Birch L. Effects of peer models’ food choices and eating behaviors on preschoolers’ food preferences. Child Dev. 1980;51:489–496. [Google Scholar]
- 9.Cooke LJ, Wardle J, Gibson EL, Sapochnik M, Sheiham A, Lawson M. Demographic, familial and trait predictors of fruit and vegetable consumption by pre-school children. Public Health Nutr. 2004;7(2):295–302. doi: 10.1079/PHN2003527. [DOI] [PubMed] [Google Scholar]
- 10.Nicklaus S, Boggio V, Chabanet C, Issanchou S. A prospective study of food variety seeking in childhood, adolescence and early adult life. Appetite. 2005;44(3):289–297. doi: 10.1016/j.appet.2005.01.006. [DOI] [PubMed] [Google Scholar]
- 11.Sigman-Grant M, Christiansen E, Branen L, Fletcher J, Johnson SL. About feeding children: Mealtimes in child-care centers in four western states. J Am Diet Assoc. 2008;108(2):340–346. doi: 10.1016/j.jada.2007.09.006. [DOI] [PubMed] [Google Scholar]
- 12.Cooke L. The importance of exposure for healthy eating in childhood: A review. J Hum Nutr Diet. 2007;20(4):294–301. doi: 10.1111/j.1365-277X.2007.00804.x. [DOI] [PubMed] [Google Scholar]
- 13.Skinner JD, Carruth BR, Wendy B, Ziegler PJ. Children’s food preferences: A longitudinal analysis. J Am Diet Assoc. 2002;102(11):1638–1647. doi: 10.1016/s0002-8223(02)90349-4. [DOI] [PubMed] [Google Scholar]
- 14.Matheson D, Spranger K, Saxe A. Preschool children’s perceptions of food and their food experiences. J Nutr Educ Behav. 2002;34(2):85–92. doi: 10.1016/s1499-4046(06)60073-0. [DOI] [PubMed] [Google Scholar]
- 15.Story M, Kaphingst KM, French S. The role of child care settings in obesity prevention. Future Child. 2006;16(1):143–168. doi: 10.1353/foc.2006.0010. [DOI] [PubMed] [Google Scholar]
- 16.Sweitzer SJ, Briley ME, Robert-Gray C. Do sack lunches provided by parents meet the nutritional needs of young children who attend child care? J Am Diet Assoc. 2009;109(1):141–144. doi: 10.1016/j.jada.2008.10.010. [DOI] [PubMed] [Google Scholar]
- 17.Erinosho T, Ball SC, Hanson PP, Vaughn AE, Ward DS. Assessing foods offered to children at child-care centers using the Healthy Eating Index-2005. J Acad Nutr Diet. 2013;113(8):1084–1089. doi: 10.1016/j.jand.2013.04.026. [DOI] [PMC free article] [PubMed] [Google Scholar]
- 18.Sweitzer SJ, Briley ME, Roberts-Gray C, Hoelscher DM, Staskel DM, Almansour FD. How to help parents pack better preschool sack lunches: Advice from parents for educators. J Nutr Educ Behav. 2011;43(3):194–198. doi: 10.1016/j.jneb.2010.09.002. [DOI] [PMC free article] [PubMed] [Google Scholar]
- 19.Sweitzer SJ, Briley ME, Roberts-Gray C, et al. Lunch is in the bag: Increasing fruits, vegetables, and whole grains in sack lunches of preschool-aged children. J Am Diet Assoc. 2010;110(7):1058–1064. doi: 10.1016/j.jada.2010.04.010. [DOI] [PMC free article] [PubMed] [Google Scholar]
- 20.US Department of Agriculture. [January 3, 2015];ChooseMyPlate.gov website. http://www.choosemyplate.gov/preschoolers.html.
- 21.National Academies, Institute of Medicine, Food and Nutrition Board. [January 3, 2015];Dietary Reference Intakes: Recommended Intakes for Individuals. 2011 http://www.nal.usda.gov/fnic/DRI/DRI_Tables/recommended_intakes_individuals.pdf.
- 22.Guenther PM, Kirkpatrick SI, Reedy J, et al. The Healthy Eating Index-2010 is a valid and reliable measure of diet quality according to the 2010 Dietary Guidelines for Americans. J Nutr. 2014;144(3):399–407. doi: 10.3945/jn.113.183079. [DOI] [PMC free article] [PubMed] [Google Scholar]
- 23.Hanson KL, Olson CM. School meals participation and weekday dietary quality were associated after controlling for weekend eating among US school children aged 6 to 17 years. J Nutr. 2013;143(5):714–721. doi: 10.3945/jn.112.170548. [DOI] [PubMed] [Google Scholar]
- 24.Sweitzer SJ, Byrd-Williams C, Ranjit N, Briley ME, Roberts-Gray C, Hoelscher DM. Development of a method to observe preschoolers’ packed lunches in child care centers. J Acad Nutr Diet. doi: 10.1016/j.jand.2015.03.012. [published online ahead of print May 12, 2015]. http://dx.doi.org/10.1016/j.jand.2015.03.012. [DOI] [PubMed]
- 25.Hoelscher DM, Day RS, Lee ES, et al. Measuring the prevalence of overweight in Texas schoolchildren. Am J Public Health. 2004;94(6):1002–1008. doi: 10.2105/ajph.94.6.1002. [DOI] [PMC free article] [PubMed] [Google Scholar]
- 26.Food Intake and Analysis System (FIAS) Food Intake and Analysis System. Houston, TX: The University of Texas School of Public Health; 2010. [August 22, 2014]. https://sph.uth.edu/research/centers/dell/fias-food-intake-and-analysis-system/ [Google Scholar]
- 27.Guenther PM, Casavale KO, Reedy J, et al. Update of the Healthy Eating Index: HEI-2010. J Acad Nutr Diet. 2013;113(4):569–580. doi: 10.1016/j.jand.2012.12.016. [DOI] [PMC free article] [PubMed] [Google Scholar]
- 28.Nicklas TA, Liu Y, Stuff JE, Fisher JO, Mendoza JA, O’Neil CE. Characterizing lunch meals served and consumed by pre-school children in Head Start. Public Health Nutr. 2013;16(12):2169–2177. doi: 10.1017/S1368980013001377. [DOI] [PMC free article] [PubMed] [Google Scholar]
- 29.Nicklas TA, O’Neil CE, Stuff JE, Hughes SO, Liu Y. Characterizing dinner meals served and consumed by low-income preschool children. Child Obes. 2012;8(6):561–571. doi: 10.1089/chi.2011.0114. [DOI] [PubMed] [Google Scholar]
- 30.National Cancer Institute. Applied Research Program website. Healthy Eating Index. [September 12, 2014];HEI Tools for Researchers. Last modified April 11, 2014. http://appliedresearch.cancer.gov/hei/tools.html.
- 31.Centers for Disease Control and Prevention, Division of Nutrition, Physical Activity, and Obesity, National Center for Chronic Disease Prevention and Health Promotion. [January 3, 2015];About BMI for children and teens. 2014 Jul; http://www.cdc.gov/healthyweight/assessing/bmi/childrens_bmi/about_childrens_bmi.html#normal%20weight%20ranges.