

Abstract
Carcinoembryonic antigen-related cell adhesion molecule 1 (CEACAMl), a substrate of the insulin receptor tyrosine kinase, regulates insulin action by promoting insulin clearance. Global null mutation of Ceacam1 gene (Cc1−/−) results in features of the metabolic syndrome, including insulin resistance, hyperinsulinemia, visceral adiposity, elevated blood pressure, and albuminuria. It also causes activation of the renal renin-angiotensin system (RAS). In the current study, we tested the hypothesis that high-fat diet enhances the expression of RAS components. Three-month-old wild-type (Cc1+/+) and Cc1−/− mice were fed either a regular or a high-fat diet for 8 wk. At baseline under regular feeding conditions, Cc1−/− mice exhibited higher blood pressure, urine albumin-to-creatinine ratio (UACR), and renal expression of angiotensinogen, renin/prorenin, angiotensin-converting enzyme, (pro)renin receptor, angiotensin subtype AT1 receptor, angiotensin II, and elevated PI3K phosphorylation, as detected by p85α (Tyr508) immunostaining, inflammatory response, and the expression of collagen I and collagen III. In Cc1+/+ mice, high-fat diet increased blood pressure, UACR, the expression of angiotensin-converting enzyme and angiotensin II, PI3K phosphorylation, inflammatory response, and the expression of collagen I and collagen III. In Cc1−/− mice, high-fat intake further amplified these parameters. Immunohistochemical staining showed increased p-PI3K p85α (Tyr508) expression in renal glomeruli, proximal, distal, and collecting tubules of Cc1−/− mice fed a high-fat diet. Together, this demonstrates that high-fat diet amplifies the permissive effect of Ceacam1 deletion on renal expression of all RAS components, PI3K phosphorylation, inflammation, and fibrosis.
Keywords: kidney, carcinoembryonic antigen-related cell adhesion molecule 1, renin-angiotensin system, high-fat diet, phosphatidylinositol 3′-kinase
the role of renin-angiotensin system (RAS) in the regulation of blood pressure and organ function has been well documented. Local RAS components are synthesized and secreted in many tissues (27). All RAS components are produced by the kidney, including angiotensinogen (AGT), renin, (pro)renin receptor (PRR), angiotensin I (Ang I), angiotensin-converting enzymes (ACE), angiotensin II (Ang II), the angiotensin subtype 1 receptor (AT1R), and the angiotensin subtype 2 receptor (AT2R) (10, 32). Increased local tissue RAS activity was linked to the development of kidney disease, hypertension, diabetes, metabolic syndrome, and heart disease (9, 48).
Carcinoembryonic antigen-related cell adhesion molecule 1 (CEACAM1), a substrate of the insulin receptor kinase (37, 45), is ubiquitously expressed. It exerts several functions, including the regulation of tumor development (6, 17, 25, 47) and cell growth (1). In a phosphorylation-dependent manner, it promotes receptor-mediated insulin endocytosis and degradation (46) that constitutes the main mechanism of insulin clearance, which occurs mostly in liver and, to a lower extent, in kidney (36). Consistently, mice lacking the Ceacam1 gene (Cc1−/−) develop insulin resistance resulting from impaired insulin clearance and hyperinsulinemia (16). In addition, they exhibit an increase in blood pressure with the activation of RAS components, including PRR (22). The increase in PRR expression is mediated by a positive cell-autonomous effect of Ceacam1 deletion on phosphatidylinositol 3′-kinase (PI3K) activity, as demonstrated by siRNA-mediated downregulation of Ceacam1 in murine renal inner medullary-collecting duct epithelial cells (22).
Increased energy supply causes insulin resistance through several mechanisms, including induction of inflammatory pathways, activation of PKC-δ, and others (38). Thus, the current study evaluated whether subjecting Cc1−/− mice to a high-fat (HF) diet amplifies the permissive effect of Ceacam1 deletion on blood pressure and renal RAS expression and whether this involves changes in PI3K activation.
MATERIALS AND METHODS
Animals.
Cc1−/− mice were generated and back-crossed 12 times onto the C57BL/6 (BL6) genetic background, as described previously (31). Mice were kept on a 12-h dark-light cycle and fed a standard chow ad libitum. The University of Virginia Animal Care and Use Committee approved all procedures. Three-month-old male Cc1−/− mice were fed ad libitum either a regular diet (RD; 12% fat content) or a HF diet (45% fat content, catalog no. D12451; Research Diets, New Brunswick, NJ) for 2 mo. One day before euthanasia, body weight, blood glucose, plasma insulin, systolic blood pressure, and 24-h urinary levels of albumin and creatinine were evaluated. Systolic blood pressure was measured in nonanesthetized mice using a tail-cuff noninvasive multichannel blood pressure system (IITC Life Sciences, Woodland Hills, CA), as done previously (35). Renal interstitial fluid (RIF) was collected using a microdialysis technique to measure renal levels of II, as we have described previously (49, 50). Renal tissues were harvested for expression of renin, angiotensinogen, and ACE as well as morphological examinations.
Urine albumin-to-creatinine ratio.
For urine collection, mice were placed in individual metabolic cages for a period of 24 h, and urine samples were kept at −80°C until they were assayed. Urinary albumin was determined by commercial ELISA kit (Exocell, Philadelphia, PA), and urine creatinine was assessed by ELISA kit (Cayman Chemical, Ann Arbor, MI). Urinary albumin-to-creatinine ratio (UACR) was used as a marker for renal dysfunction.
Real-time reverse transcription polymerase chain reaction.
Total RNA was extracted from isolated whole kidney using TRIzol reagent (Invitrogen, Carlsbad, CA) per the manufacturer's instructions. Aliquots of total RNA (1 μg) were reverse transcribed into cDNA using the first-strand cDNA synthesis kit (Bio-Rad, Hercules, CA). Equal amounts of the reverse transcriptional products were subjected to PCR amplification, using SYBR Green as the fluorescence indicator on a Bio-Rad iCycler system (Bio-Rad). mRNA levels were normalized to GAPDH mRNA levels. Results are expressed in fold change as means ± SE. Primers (Table 1) were synthesized by Operon (Huntsville, AL).
Table 1.
Primers used for real-time RT-PCR
| Gene | Forward (5′-3′) | Reverse (5′-3′) |
|---|---|---|
| AGT | AATGGACTGTAGCAGGGGTG | CTGTGAAGGAGGGAGACTGC |
| PRR | TTTGGATGAACTTGGGAAGC | CACAAGGGATGTGTCGAATG |
| Renin | GTGAATCCCACAAGCAAGGT | AGGCCTTCCTTGACCAATCT |
| ACE | GGAGTACTTCCAACCGGTCA | GCCTTGGCTTCATCAGTCTC |
| AT1R | TAATAGATGATGGCTGCCCC | TGGAAATCAAAAGGAGACCG |
| TNFα | ACGGCATGGATCTCAAAGAC | CGGACTCCGCAAAGTCTAAG |
| IL-1β | CCCTGCAGCTGGAGAGTGTGG | TATTCTGTCCATTGAGGTGGAG |
| IL-6 | GGCCTTCCCTACTTCACAAG | ATTTCCACGATTTCCCAGAG |
| IFNγ | ATGAACGCTACACACTGCATC | CCATCCTTTTGCCAGTTCCTC |
| TGFβ | CAACAATTCCTGGCGTTACCTTGG | GAAAGCCCTGTATTCCGTCTCCTT |
| Smad7 | TCAGGTGGCCGGATCTCA | GGTTGATCTTCCCGTAAGATTCA |
| α-SMA | GTGCTATGTCGCTCTGGACTTTGA | ATGAAAGATGGCTGGAAGAGGGTC |
| Collagen I | TGCCGTGACCTCAAGATGTG | CACAAGCGTGCTGTAGGTGA |
| Collagen III | GCGGAATTCCTGGACCAAAAGGTGATGCTG | GCGGGATCCGAGGACCACGTTCCCCATTATG |
| Gapdh | CCAGGTTGTCTCCTGCGACT | ATACCAGGAAATGAGCTTGACAAAGT |
AGT, angiotensinogen; PRR, (pro)renin receptor; ACE, angiotensin-converting enzyme; AT1R, angiotensin subtype 1 receptor; TGFβ, transforming growth factor-β; α-SMA, α-smooth muscle actin.
Western blot analysis.
Western blot analysis was performed as described previously (32). In brief, whole kidney homogenates were lysed in the presence of protease inhibitors, and 40 μg of protein was subjected to 4–12% gradient SDS-PAGE, transferred onto a PVDF membrane, and subjected at 4°C to an overnight incubation with primary antibodies that included anti-AGT (1:200, sc-7419; Santa Cruz Biotechnology), anti-PRR (1:1,000, ab40790; Abcam), anti-renin (1:200, sc-22752; Santa Cruz Biotechnology), anti-ACE (1:200, sc-23908; Santa Cruz Biotechnology), anti-AT1R (1:200, sc-31181; Santa Cruz Biotechnology), a custom-made CEACAM1 antibody (16), or anti-β-actin (1:5,000, A5441; Sigma), with the latter being used in reprobing to normalize per total amount of loaded proteins. Following incubation with horseradish peroxidase-labeled IgG (1:5,000), immunoreactive bands were detected by chemiluminescence methods and visualized on Kodak Omat X-ray films. Densitometric analysis of the images obtained from X-ray films was performed using ImageJ software (National Institutes of Health, Bethesda, MD).
Measurement of renal Ang II production.
Ang II levels in RIF were measured by Ang II EIA kit per the manufacturer's instructions (Cayman Chemical).
Immunohistochemical staining.
Immunohistochemical staining was performed to determine renal cellular expression of phospho-PI3K p85α (Tyr508) as well as that of collagen I and collagen III. To this end, 4-μm-thick sections were cut, deparaffinized, and rehydrated. Heat-induced antigen retrieval was conducted in 10 mM sodium citrate (pH 6.0). Endogenous peroxide activity was suppressed by 0.3% peroxide-methanol solution. Vectastain ABC Kit (Vector Laboratories, Burlingame, CA) was used for blocking and color reaction. Immunostaining was performed by incubating overnight at 4°C with polyclonal rabbit anti-phospho-PI3K p85α (Tyr508) antibody (Santa Cruz Biotechnology), collagen I, and collagen III (Abcam), followed by 1 h of incubation with a secondary antibody conjugated with biotin at room temperature (Vector Laboratories).
Statistical analysis.
Data analysis was carried out using Statistica version 5.0 (StatSoft, Tulsa, OK). Values are expressed as means ± SE. Significant differences among multiple groups were examined using two-way analysis of variance with repeated measurements and the Bonferroni correction method as a post hoc test. P < 0.05 was considered statistically significant.
RESULTS
Blood pressure and UACR in response to HF diet.
At baseline and under standard feeding conditions, Cc1−/− mice exhibited higher blood pressure (P < 0.05; Fig. 1A) and UACR (P < 0.01; Fig. 1B) than Cc1+/+ mice [knockout-type mice fed regular diet (RD) vs. WT mice fed RD]. HF diet significantly increased blood pressure (P < 0.01; Fig. 1A) and UACR (P < 0.01; Fig. 1B) in both the Cc1+/+ and Cc1−/− mouse groups, causing UACR to remain higher in HF-fed Cc1−/− than in HF-fed Cc1+/+ mice (P < 0.01; Fig. 1B).
Fig. 1.

Effect of high-fat (HF) diet on blood pressure and urine albumin-to-creatinine ratio in carcinoembryonic antigen-related cell adhesion molecule 1 (CEACAM1) wild-type (Cc1+/+) and CEACAM1 KO mice (Cc1−/−) mice. A: blood pressure. B: urine albumin/creatinine ratio. WTRD, wild-type (WT) mice fed regular diet (RD); WTHF, WT mice fed HF diet; KORD, knockout-type (KO) mice fed regular diet (RD); KOHF, KO-type mice fed HF diet. Values are means ± SE; n = 6 mice/group.
Renal AGT, renin, prorenin, and ACE expression in response to HF diet.
mRNA levels of AGT (P < 0.001; Fig. 2A) and renin (P < 0.01; Fig. 2C) were significantly higher in RD-fed Cc1−/− than in RD-fed Cc1+/+ mice. Similarly, protein levels of AGT (P < 0.01; Fig. 2B) and renin (P < 0.01; Fig. 2A) were significantly increased in RD-fed Cc1−/− mice compared with RD-fed Cc1+/+ mice. HF intake did not affect either renal AGT or renin mRNA (Fig. 2, A and C) or protein levels (Fig. 2, C and D).
Fig. 2.

Effect of HF diet on mRNA and protein levels of angiotensinogen (AGT) and renin (REN) in the kidney of Cc1+/+ and Cc1−/− mice. A: real-time PCR analysis of AGT mRNA expression in whole kidney lysates. B: Western blot analysis of AGT protein expression in whole kidney lysates. C: real-time PCR analysis of renin mRNA expression in whole kidney lysates. D: Western blot analysis of renin protein in whole kidney lysates. Values are means ± SE; n = 6 mice/group.
HF diet had no significant effect on renal PRR mRNA (Fig. 3A) or protein levels (Fig. 3B) in Cc1+/+ mice. In Cc1−/− mice, however, it induced a significant increase in PRR mRNA (P < 0.01; Fig. 3A) and protein (P < 0.05; Fig. 3B) levels. This caused PRR levels to be significantly higher in HF-fed Cc1−/− than in HF-fed Cc1+/+ mice (P < 0.05).
Fig. 3.

Effect of HF diet on (pro)renin receptor (PRR) mRNA and protein levels in the kidneys of Cc1+/+ and Cc1−/− mice. A: real-time PCR analysis of PRR mRNA expression in whole kidney lysates. B: reconstructed Western blot analysis as representative of PRR protein expression in whole kidney lysates; 1 band was chosen randomly from each treatment group. Values are means ± SE; n = 6 mice/group.
ACE mRNA (P < 0.01; Fig. 4A) and protein (P < 0.01; Fig. 4B) levels were significantly higher in the kidneys of Cc1−/− than Cc1+/+ mice. HF diet caused a further increase in ACE mRNA (P < 0.01; Fig. 4A) and protein (P < 0.05; Fig. 4B) levels in Cc1−/− mice.
Fig. 4.
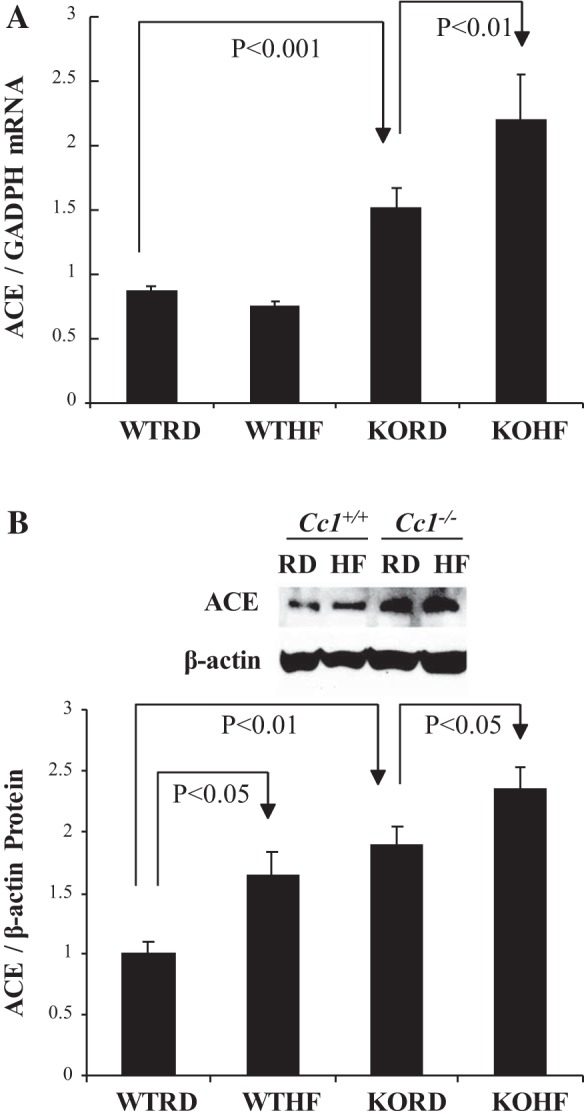
Effect of HF diet on angiotensin-converting enzyme (ACE) mRNA and protein levels in the kidneys of Cc1+/+ and Cc1−/− mice. A: real-time PCR analysis of ACE mRNA expression in kidney lysates. B: Western blot analysis of ACE protein expression in whole kidney lysates. Values are means ± SE; n = 6 mice/group.
Ang II in RIF and renal AT1R in response to HF diet.
RIF (Ang II) levels were significantly higher in RD-fed Cc1−/− than in RD-fed Cc1+/+ mice (P < 0.01; Fig. 5). HF significantly increased RIF Ang II in Cc1+/+ (P < 0.05; Fig. 5) but not Cc1−/− mice.
Fig. 5.

Effect of HF diet on renal interstitial fluid (RIF) angiotensin (Ang) levels in Cc1+/+ and Cc1−/− mice. A: RIF Ang II. Values are means ± SE; n = 6 mice/group.
In Cc1+/+ mice, HF diet had no significant effect on renal AT1R mRNA (Fig. 6A) or protein (Fig. 6B) levels. In contrast, Cc1−/− mice exhibited significant elevation in AT1R mRNA (P < 0.01; Fig. 6A) and protein (P < 0.01; Fig. 6B) compared with Cc1+/+ mice, regardless of diet. HF diet did not increase renal AT1R mRNA (Fig. 6A) or protein (Fig. 6B) levels significantly in Cc1−/− mice.
Fig. 6.

Effect of HF diet on angiotensin subtype 1 receptor (AT1R) mRNA and protein levels in the kidneys of Cc1+/+ and Cc1−/− mice. A: real-time PCR analysis of AT1R mRNA expression in whole kidney lysates. B: Western blot analysis of AT1R protein expression in whole kidney lysates. Values are means ± SE; n = 6 mice/group.
Renal PI3K p85α phosphorylation in response to HF diet.
Immunohistochemical staining showed higher basal phosphorylation of PI3K p85α (Tyr508) in the renal glomeruli, proximal tubules, distal tubules, and collecting ducts of RD-fed Cc1−/− than of RD-fed Cc1+/+ mice. HF intake increased PI3K p85α phosphorylation in all kidney segments of Cc1+/+ and Cc1−/− mice (Fig. 7).
Fig. 7.

Immunostaining of phosphorylated (phospho) phospatidylinositol 3′-kinase (PI3K) p85α in the kidneys of Cc1+/+ and Cc1−/− mice. Immunostaining of phospho-PI3K p85α (Tyr508) in the kidneys of Cc1+/+ and Cc1−/− mice fed RD or HF diet; n = 6 mice/group. PT, proximal tubule; DT, distal tubule; CD, collecting ducts.
Hyperinsulinemia in response to HF diet.
Because HF-mediated reduction of CEACAM1 is associated with hyperinsulinemia caused by impaired insulin clearance (2), we then examined whether hyperinsulinemia develop in HF-fed mice. As expected, HF caused hyperinsulinemia in wild-type mice (Table 2), likely owing to a reduction in hepatic CEACAM1 protein content, followed by impaired insulin clearance, as assessed by steady-state C-peptide/insulin molar ratio (Table 2). As published previously (16, 19), Cc1−/− mice exhibited impaired insulin clearance and hyperinsulinemia under both feeding conditions (Table 2). Sustained HF intake induced fed hyperglycemia in wild types (Table 2), consistent with the development of insulin resistance in wild-type mice under HF feeding conditions. In Cc1−/− mutants that already manifested hyperinsulinemia (Table 2) on a RD (16), HF diet caused fasting hyperglycemia (Table 2), which was likely due to increased hepatic glucose production, as occurred in L-SACC1 mice with liver-specific inactivation of CEACAM1 (29).
Table 2.
Plasma and blood biochemistry
|
Cc1+/+ |
Cc1−/− |
|||
|---|---|---|---|---|
| RD | HF | RD | HF | |
| Fasting plasma insulin, pM | 76.71 ± 9.034 | 144.1 ±10.04* | 123.3 ±4.001† | 287.2 ±30.05*† |
| Fasting C/I molar ratio | 9.282 ± 0.501 | 6.023 ± 0.233* | 5.122 ± 0.603† | 5.451 ± 0.252 |
| Fasting blood glucose, mg/dl | 70.22 ± 1.112 | 72.42 ± 3.133 | 68.32 ± 2.533 | 104.1 ±4.432*† |
| Fed blood glucose, mg/dl | 83.42 ± 4.052 | 120.3 ± 5.323* | 115.3 ± 4.702† | 125.1 ± 6.623 |
Values are expressed as means ± SE. Cc−/−, global Ceacam1 null mouse; Cc+/+, wild-type mouse from the same genetic background as Cc−/− mice; RD, regular diet; HF, high-fat diet; C/I molar ratio, C-peptide-to-insulin molar ratio at a steady state is a measurement of insulin clearance. Male mice (n > 7, 3 mo of age) were fed RD or HF for 2 mo.
P < 0.05, HF vs. RD;
P < 0.05, Cc1−/− vs. Cc1+/+ in the same feeding group.
Renal inflammation and fibrosis in response to HF diet.
RD-fed Cc1−/− mice exhibited an increase in the mRNA content of inflammatory markers such as TNFα, IL-1β, IL-6, and IFNγ (Table 3). Despite the increase in the mRNA levels of the anti-fibrogenic gene IFNγ (7), mRNA (Table 3) and protein content of collagen I (Fig. 8A) and collagen III (Fig. 8B) were markedly elevated, whereas the increase in α-SMA mRNA did not reach statistical significance. The mRNA levels of Smad7 are reduced in RD-fed Cc1−/− mice. Sustained HF feeding exacerbated these fibrogenic changes in Cc1−/− mice, as assessed by the higher production of TNFα, α-SMA, collagen I, and collagen III relative to RD-fed Cc1−/− mice (Table 3 and Fig. 8). IL-6 and TGF-β mRNA levels in Cc1−/− mice were not modified further by HF feeding.
Table 3.
Effect of HF intake on the expression of selected genes related to inflammation and fibrosis in kidney
|
Cc1+/+ |
Cc1−/− |
|||
|---|---|---|---|---|
| RD | HF | RD | HF | |
| TNF-α (×10−1) | 0.08 ± 0.01 | 0.25 ± 0.02* | 0.15 ± 0.02† | 0.42 ± 0.06*† |
| IL-1β (×10−1) | 0.82 ± 0.16 | 1.63 ± 0.11* | 2.30 ± 0.28† | 2.71 ± 0.30† |
| IL-6 (×10−1) | 0.05 ± 0.00 | 0.06 ± 0.01 | 0.11 ± 0.01† | 0.12 ± 0.02† |
| IFNγ (×10−1) | 0.06 ± 0.00 | 0.11 ± 0.02* | 0.12 ± 0.01† | 0.10 ± 0.00 |
| TGFβ | 0.55 ± 0.04 | 0.80 ± 0.30* | 0.84 ± 0.04† | 0.80 ± 0.10 |
| Smad7 | 0.60 ± 0.08 | 0.40 ± 0.03* | 0.35 ± 0.01† | 0.41 ± 0.02 |
| α-SMA | 1.52 ± 0.23 | 1.63 ± 0.11 | 1.94 ± 0.24 | 3.23 ± 0.05*† |
| Collagen I | 0.34 ± 0.04 | 0.50 ± 0.05* | 1.67 ± 0.11† | 3.92 ± 0.07*† |
| Collagen III | 1.82 ± 0.30 | 3.03 ± 0.84 | 8.34 ± 1.22† | 16.3 ± 2.00*† |
Values are normalized to Gapdh and expressed as means ± SE. Male mice (n > 4, 3 mo of age) were fed RD or HF for 2 mo. mRNA was analyzed by semiquantitative real-time PCR in duplicate.
P < 0.05, HF vs. RD;
P < 0.05, Cc1−/− vs. Cc1+/+ in the same feeding group.
Fig. 8.

Immunostaining of collagen I and collagen III in the kidneys of male Cc1+/+ and Cc1−/− mice. A: immunostaining of collagen I in the kidneys of Cc1+/+ and Cc1−/− mice fed RD or HF diet. B: typical immunostaining of collagen III in the kidneys of Cc1+/+ and Cc1−/− mice fed RD or HF diet; n = 6 mice/group.
In Cc1+/+ wild-type mice, HF elevated renal mRNA levels of TGFβ and TNFα (Table 3) without altering IL-6 mRNA levels (Table 3). This translated into a minor increase in collagen I mRNA levels without a significant change in the mRNA levels of α-SMA or collagen III (Table 3). HF diet increased collagen staining in the kidney of both mouse groups (Fig. 8).
DISCUSSION
As in our previous report (22), we herein observed that a HF diet increased blood pressure and UACR, a marker of renal dysfunction, in mice with null mutation of Ceacam1 together with an underlying increase in the expression of all renal RAS components, PI3K activation, inflammation, and fibrosis. Thus, these studies confirmed that CEACAM1 prevents elevation in blood pressure and UACR, and this is mediated by curtailing renal PI3K p85α phosphorylation, RAS activity, and inflammation and kidney fibrosis.
Consistent with reports on induction of blood pressure and renal dysfunction by HF feeding (13, 18, 21), we have herein observed that prolonged HF intake caused elevation in blood pressure and UACR in wild-type as well as Cc1−/− mice. In support of the role for insulin resistance and leptin in enhancing renal sodium reabsorption and promoting obesity-related hemodynamic changes (4, 12, 28), HF elevated blood pressure and caused kidney dysfunction in wild-type mice in parallel to insulin resistance and repression of renal CEACAM1 level. Because HF induced blood pressure and UACR to a much higher extent in wild-types than Cc1−/− mice, this suggests that other factors play an additional role(s) in the loss of CEACAM1 in amplifying these hemodynamic changes. These secondary factors could include the rise in the levels of plasma leptin, a cytokine released from white adipose tissue, in HF-fed relative to RD-fed mice (19). Among its multiple effects, leptin acts centrally to activate renal sympathetic nerve and cause hypertension (34). Because HF diet induced plasma leptin more strongly in wild-type than in Cc1−/− mice (27-fold vs. 9-fold in mutants) (19), it is likely that leptin contributes to the differential potentiating effect of HF diet on blood pressure and kidney function in wild-type and Cc1−/− mice.
Moreover, HF diet amplified the effect of Ceacam1 deletion on renal dysfunction and RAS expression, particularly as it pertains to elevated renal ACE and PRR levels. Consistent with the key role of PI3K activation in mediating the upregulatory effect of Ceacam1 deletion on renal PRR expression (22), HF diet further induced PI3K phosphorylation in mice devoid of Ceacam1 and caused PI3K activation in wild-type mice in parallel with repressing its renal CEACAM1 content. This suggests that PI3K activation contributes mechanistically to diet-induced potentiation of PRR and ACE induction by Ceacam1 deletion. This notion is supported at least in part by the observation that HF diet induced renal ACE expression in wild-type mice while markedly reducing their CEACAM1 levels.
In addition to renal ACE, HF diet elevated Ang II in RIF of wild-type mice together with blood pressure and UACR, as was observed previously (5). The importance of RAS in the regulation of blood pressure and development of albuminuria is well recognized (20, 26, 41–42). Ang II is the principal RAS peptide regulating blood pressure and contributing to increased urinary albumin. Both PRR and ACE can increase Ang II production (39). ACE activation causes more Ang I to Ang II conversion (9, 27). Although the cause-effect relationship was not established in this study, it is intriguing that Ang II elevation by HF diet in wild-type mice was associated with a marked loss of renal CEACAM1 content, simulating the established effect of Ceacam1 null deletion on the levels of Ang II and other RAS components (22).
As reported previously (22), the current data showed that Ceacam1 deletion caused PI3K activation, pointing to a role for loss of renal CEACAM1 in diet-induced activation of PI3K p85α (Tyr508) in renal glomeruli, proximal, distal, and collecting tubules in RD-fed wild-type mice. This agrees with other reports showing reduction of PI3K/Akt pathways by CEACAM1 in response to different signals (22, 45, 53). Poy et al. (45) showed that upon its phosphorylation by the insulin receptor tyrosine kinase, CEACAM1 binds to Shc and positions it to compete more efficiently with the insulin receptor substrate 1 for the receptor-binding, downregulating, downstream PI3K/Akt pathway. Activation of PI3K/Akt pathway by Ceacam1 deletion increased PRR production via CREB family and NF-kB transcription factors (22), whereas increased PRR production enhanced PI3K phosphorylation (33). These results suggest that PI3K activation contributes to upregulation of PRR, which may mediate an additional increase in PI3K phosphorylation of prorenin that binds to PRR, leading to increased Ang II formation both in vitro and in vivo (15, 40).
Activation of RAS induces tissue inflammation and fibrosis (14, 23, 24, 44, 51), which are important contributors to development of hypertension and renal damage (8). Like the liver (19), Ceacam1 null mutation leads to higher inflammation response and fibrosis in the kidney. This is probably due to the profibrogenic effect of IL-6 and TGFβ (7), which were elevated in the null mouse under normal feeding conditions. The mRNA level of Smad7, which inhibits TGFβ activation (52), was reduced in RD-fed Cc1−/− mice, likely owing to the countervailing effect of TNFα (52). Sustained HF feeding exacerbated these inflammation and fibrogenic changes in Cc1−/− mice, suggesting HF induced kidney damage through both Ceacam1-dependent and -independent signaling pathways such as oxidative stress (3) and inducible nitric oxide synthase-derived nitric oxide (43). Surprisingly, IL-6 and TGFβ levels were not further induced by HF feeding in Cc1−/− mice, attributing the profibrogenic effect to increased levels of TNFα, which mediate progression of fibrosis in addition to inflammation (11).
In summary, we demonstrated that Ceacam1 null mutation caused an elevation in blood pressure and increased UACR through RAS and PI3K pathway activation, which is magnified by HF diet. To our knowledge, this is the first report demonstrating the involvement of CEACAM1 in regulating blood pressure and renal dysfunction in response to HF intake. Given that hepatic CEACAM1 level is reduced in obese subjects (30) and that local RAS activation contributes to kidney dysfunction induced by hypertension, diabetes, metabolic syndrome, and heart disease (9, 48), the current studies promote an important role for CEACAM1 reduction in the development of hypertension associated with metabolic syndrome. Thus, inducing CEACAM1 activity or its signaling pathways could be beneficial in managing hypertension and renal dysfunction.
GRANTS
This study was supported by National Institutes of Health Grants DK-078757 and HL-091535 to H. M. Siragy and DK-054254, DK-083850, HL-112248, and HL-036573-26 to S. M. Najjar.
DISCLOSURES
No conflicts of interest, financial or otherwise, are declared by the authors.
AUTHOR CONTRIBUTIONS
C.L., S.A.C., S.Q., and H.M.S. conception and design of research; C.L., S.Q., K.J.L., Q.Y.A.-S., H.E.G., and H.M.S. performed experiments; C.L., S.A.C., S.Q., K.J.L., Q.Y.A.-S., H.E.G., S.M.N., and H.M.S. analyzed data; C.L., S.A.C., S.Q., K.J.L., Q.Y.A.-S., H.E.G., S.M.N., and H.M.S. interpreted results of experiments; C.L., S.A.C., S.Q., K.J.L., Q.Y.A.-S., H.E.G., and S.M.N. prepared figures; C.L., S.A.C., S.Q., S.M.N., and H.M.S. drafted manuscript; S.M.N. and H.M.S. edited and revised manuscript; S.M.N. and H.M.S. approved final version of manuscript.
REFERENCES
- 1.Abou-Rjaily GA, Lee SJ, May D, Al-Share QY, Deangelis AM, Ruch RJ, Neumaier M, Kalthoff H, Lin SH, Najjar SM. CEACAM1 modulates epidermal growth factor receptor-mediated cell proliferation. J Clin Invest 114: 944–952, 2004. [DOI] [PMC free article] [PubMed] [Google Scholar]
- 2.Al-Share QY, DeAngelis AM, Lester SG, Bowman TA, Ramakrishnan SK, Abdallah SL, Russo L, Patel PR, Kaw MK, Raphael CK, Kim AJ, Heinrich G, Lee AD, Kim JK, Kulkarni RN, Philbrick WM, Najjar SM. Forced Hepatic Overexpression of CEACAM1 Curtails Diet-Induced Insulin Resistance. Diabetes 64: 2780–2790, 2015. [DOI] [PMC free article] [PubMed] [Google Scholar]
- 3.Alcala M, Sánchez-Vera I, Sevillano J, Herrero L, Serra D, Ramos MP, Viana M. Vitamin E reduces adipose tissue fibrosis, inflammation, and oxidative stress and improves metabolic profile in obesity. Obesity (Silver Spring) 23: 1598–1606, 2015. [DOI] [PubMed] [Google Scholar]
- 4.Antic V, Dulloo A, Montani JP. Multiple mechanisms involved in obesity-induced hypertension. Heart Lung Circ 12: 84–93, 2003. [DOI] [PubMed] [Google Scholar]
- 5.Barton M, Carmona R, Morawietz H, d'Uscio LV, Goettsch W, Hillen H, Haudenschild CC, Krieger JE, Munter K, Lattmann T, Luscher TF, Shaw S. Obesity is associated with tissue-specific activation of renal angiotensin-converting enzyme in vivo: evidence for a regulatory role of endothelin. Hypertension 35: 329–336, 2000. [DOI] [PubMed] [Google Scholar]
- 6.Beauchemin N, Arabzadeh A. Carcinoembryonic antigen-related cell adhesion molecules (CEACAMs) in cancer progression and metastasis. Cancer Metastasis Rev 32: 643–671, 2013. [DOI] [PubMed] [Google Scholar]
- 7.Bhogal RK, Bona CA. B cells: no longer bystanders in liver fibrosis. J Clin Invest 115: 2962–2965, 2005. [DOI] [PMC free article] [PubMed] [Google Scholar]
- 8.Blasi ER, Rocha R, Rudolph AE, Blomme EA, Polly ML, McMahon EG. Aldosterone/salt induces renal inflammation and fibrosis in hypertensive rats. Kidney Int 63: 1791–1800, 2003. [DOI] [PubMed] [Google Scholar]
- 9.Carey RM, Siragy HM. The intrarenal renin-angiotensin system and diabetic nephropathy. Trends Endocrinol Metab 14: 274–281, 2003. [DOI] [PubMed] [Google Scholar]
- 10.Carey RM, Siragy HM. Newly recognized components of the renin-angiotensin system: potential roles in cardiovascular and renal regulation. Endocr Rev 24: 261–271, 2003. [DOI] [PubMed] [Google Scholar]
- 11.Carter-Kent C, Zein NN, Feldstein AE. Cytokines in the pathogenesis of fatty liver and disease progression to steatohepatitis: implications for treatment. Am J Gastroenterol 103: 1036–1042, 2008. [DOI] [PubMed] [Google Scholar]
- 12.Chan NN, Tong PC, Kong AP, Chan JC. Obesity hypertension: the rationale for renin-angiotensin system blockade. Hong Kong Med J 11: 217–220, 2005. [PubMed] [Google Scholar]
- 13.Chung S, Park CW, Shin SJ, Lim JH, Chung HW, Youn DY, Kim HW, Kim BS, Lee JH, Kim GH, Chang YS. Tempol or candesartan prevents high-fat diet-induced hypertension and renal damage in spontaneously hypertensive rats. Nephrol Dial Transplant 25: 389–399, 2010. [DOI] [PubMed] [Google Scholar]
- 14.Clavreul N, Sansilvestri-Morel P, Magard D, Verbeuren TJ, Rupin A. (Pro)renin promotes fibrosis gene expression in HEK cells through a Nox4-dependent mechanism. Am J Physiol Renal Physiol 300: F1310–F1318, 2011. [DOI] [PubMed] [Google Scholar]
- 15.Danser AH, Deinum J. Renin, prorenin and the putative (pro)renin receptor. J Renin Angiotensin Aldosterone Syst 6: 163–165, 2005. [DOI] [PubMed] [Google Scholar]
- 16.DeAngelis AM, Heinrich G, Dai T, Bowman TA, Patel PR, Lee SJ, Hong EG, Jung DY, Assmann A, Kulkarni RN, Kim JK, Najjar SM. Carcinoembryonic antigen-related cell adhesion molecule 1: a link between insulin and lipid metabolism. Diabetes 57: 2296–2303, 2008. [DOI] [PMC free article] [PubMed] [Google Scholar]
- 17.Estrera VT, Chen DT, Luo W, Hixson DC, Lin SH. Signal transduction by the CEACAM1 tumor suppressor. Phosphorylation of serine 503 is required for growth-inhibitory activity. J Biol Chem 276: 15547–15553, 2001. [DOI] [PubMed] [Google Scholar]
- 18.Foster MC, Hwang SJ, Porter SA, Massaro JM, Hoffmann U, Fox CS. Fatty kidney, hypertension, and chronic kidney disease: the Framingham Heart Study. Hypertension 58: 784–790, 2011. [DOI] [PMC free article] [PubMed] [Google Scholar]
- 19.Ghosh S, Kaw M, Patel PR, Ledford KJ, Bowman TA, McInerney MF, Erickson SK, Bourey RE, Najjar SM. Mice with null mutation of Ceacam I develop nonalcoholic steatohepatitis. Hepat Med 2010: 69–78, 2010. [DOI] [PMC free article] [PubMed] [Google Scholar]
- 20.Hall JE. The renin-angiotensin system: renal actions and blood pressure regulation. Compr Ther 17: 8–17, 1991. [PubMed] [Google Scholar]
- 21.Hall ME, do Carmo JM, da Silva AA, Juncos LA, Wang Z, Hall JE. Obesity, hypertension, and chronic kidney disease. Int J Nephrol Renovasc Dis 7: 75–88, 2014. [DOI] [PMC free article] [PubMed] [Google Scholar]
- 22.Huang J, Ledford KJ, Pitkin WB, Russo L, Najjar SM, Siragy HM. Targeted deletion of murine CEACAM 1 activates PI3K-Akt signaling and contributes to the expression of (Pro)renin receptor via CREB family and NF-κB transcription factors. Hypertension 62: 317–323, 2013. [DOI] [PMC free article] [PubMed] [Google Scholar]
- 23.Huang J, Siragy HM. Glucose promotes the production of interleukine-1beta and cyclooxygenase-2 in mesangial cells via enhanced (Pro)renin receptor expression. Endocrinology 150: 5557–5565, 2009. [DOI] [PMC free article] [PubMed] [Google Scholar]
- 24.Ichihara A, Kaneshiro Y, Takemitsu T, Sakoda M, Suzuki F, Nakagawa T, Nishiyama A, Inagami T, Hayashi M. Nonproteolytic activation of prorenin contributes to development of cardiac fibrosis in genetic hypertension. Hypertension 47: 894–900, 2006. [DOI] [PubMed] [Google Scholar]
- 25.Izzi L, Turbide C, Houde C, Kunath T, Beauchemin N. cis-Determinants in the cytoplasmic domain of CEACAM1 responsible for its tumor inhibitory function. Oncogene 18: 5563–5572, 1999. [DOI] [PubMed] [Google Scholar]
- 26.Kobori H, Kamiyama M, Harrison-Bernard LM, Navar LG. Cardinal role of the intrarenal renin-angiotensin system in the pathogenesis of diabetic nephropathy. J Investig Med 61: 256–264, 2013. [DOI] [PMC free article] [PubMed] [Google Scholar]
- 27.Kobori H, Nangaku M, Navar LG, Nishiyama A. The intrarenal renin-angiotensin system: from physiology to the pathobiology of hypertension and kidney disease. Pharmacol Rev 59: 251–287, 2007. [DOI] [PubMed] [Google Scholar]
- 28.Kotsis V, Stabouli S, Papakatsika S, Rizos Z, Parati G. Mechanisms of obesity-induced hypertension. Hypertens Res 33: 386–393, 2010. [DOI] [PubMed] [Google Scholar]
- 29.Lee SJ, Heinrich G, Fedorova L, Al-Share QY, Ledford KJ, Fernstrom MA, McInerney MF, Erickson SK, Gatto-Weis C, Najjar SM. Development of nonalcoholic steatohepatitis in insulin-resistant liver-specific S503A carcinoembryonic antigen-related cell adhesion molecule 1 mutant mice. Gastroenterology 135: 2084–2095, 2008. [DOI] [PMC free article] [PubMed] [Google Scholar]
- 30.Lee W. The CEACAM1 expression is decreased in the liver of severely obese patients with or without diabetes. Diagn Pathol 6: 40, 2011. [DOI] [PMC free article] [PubMed] [Google Scholar]
- 31.Leung N, Turbide C, Olson M, Marcus V, Jothy S, Beauchemin N. Deletion of the carcinoembryonic antigen-related cell adhesion molecule 1 (Ceacam1) gene contributes to colon tumor progression in a murine model of carcinogenesis. Oncogene 25: 5527–5536, 2006. [DOI] [PubMed] [Google Scholar]
- 32.Li C, Siragy HM. High glucose induces podocyte injury via enhanced (pro)renin receptor-Wnt-beta-catenin-snail signaling pathway. PLoS One 9: e89233, 2014. [DOI] [PMC free article] [PubMed] [Google Scholar]
- 33.Li C, Siragy HM. (Pro)renin receptor regulates autophagy and apoptosis in podocytes exposed to high glucose. Am J Physiol Endocrinol Metab 309: E302–E310, 2015. [DOI] [PMC free article] [PubMed] [Google Scholar]
- 34.Lim K, Burke SL, Head GA. Obesity-related hypertension and the role of insulin and leptin in high-fat-fed rabbits. Hypertension 61: 628–634, 2013. [DOI] [PubMed] [Google Scholar]
- 35.Matavelli LC, Huang J, Siragy HM. In vivo regulation of renal expression of (pro)renin receptor by a low-sodium diet. Am J Physiol Renal Physiol 303: F1652–F1657, 2012. [DOI] [PMC free article] [PubMed] [Google Scholar]
- 36.Najjar SM. Regulation of insulin action by CEACAM1. Trends Endocrinol Metab 13: 240–245, 2002. [DOI] [PubMed] [Google Scholar]
- 37.Najjar SM, Philippe N, Suzuki Y, Ignacio GA, Formisano P, Accili D, Taylor SI. Insulin-stimulated phosphorylation of recombinant pp120/HA4, an endogenous substrate of the insulin receptor tyrosine kinase. Biochemistry 34: 9341–9349, 1995. [DOI] [PubMed] [Google Scholar]
- 38.Najjar SM, Russo L. CEACAM1 loss links inflammation to insulin resistance in obesity and non-alcoholic steatohepatitis (NASH). Semin Immunopathol 36: 55–71, 2014. [DOI] [PMC free article] [PubMed] [Google Scholar]
- 39.Nguyen G. Renin, (pro)renin and receptor: an update. Clin Sci (Lond) 120: 169–178, 2011. [DOI] [PubMed] [Google Scholar]
- 40.Nguyen G, Burckle CA, Sraer JD. Renin/prorenin-receptor biochemistry and functional significance. Curr Hypertens Rep 6: 129–132, 2004. [DOI] [PubMed] [Google Scholar]
- 41.Niarchos AP, Pickering TG, Case DB, Sullivan P, Laragh JH. Role of the renin-angiotensin system in blood pressure regulation. The cardiovascular effects of converting enzyme inhibition in normotensive subjects. Circ Res 45: 829–837, 1979. [DOI] [PubMed] [Google Scholar]
- 42.Nicholl DD, Hemmelgarn BR, Turin TC, MacRae JM, Muruve DA, Sola DY, Ahmed SB. Increased urinary protein excretion in the “normal” range is associated with increased renin-angiotensin system activity. Am J Physiol Renal Physiol 302: F526–F532, 2012. [DOI] [PubMed] [Google Scholar]
- 43.Nozaki Y, Fujita K, Wada K, Yoneda M, Kessoku T, Shinohara Y, Imajo K, Ogawa Y, Nakamuta M, Saito S, Masaki N, Nagashima Y, Terauchi Y, Nakajima A. Deficiency of iNOS-derived NO accelerates lipid accumulation-independent liver fibrosis in non-alcoholic steatohepatitis mouse model. BMC Gastroenterol 15: 42, 2015. [DOI] [PMC free article] [PubMed] [Google Scholar]
- 44.Pacurari M, Tchounwou PB. Role of MicroRNAs in Renin-Angiotensin-Aldosterone System-Mediated Cardiovascular Inflammation and Remodeling. Int J Inflam 2015: 101527, 2015. [DOI] [PMC free article] [PubMed] [Google Scholar]
- 45.Poy MN, Ruch RJ, Fernstrom MA, Okabayashi Y, Najjar SM. Shc and CEACAM1 interact to regulate the mitogenic action of insulin. J Biol Chem 277: 1076–1084, 2002. [DOI] [PubMed] [Google Scholar]
- 46.Poy MN, Yang Y, Rezaei K, Fernstrom MA, Lee AD, Kido Y, Erickson SK, Najjar SM. CEACAM1 regulates insulin clearance in liver. Nat Genet 30: 270–276, 2002. [DOI] [PubMed] [Google Scholar]
- 47.Simeone DM, Ji B, Banerjee M, Arumugam T, Li D, Anderson MA, Bamberger AM, Greenson J, Brand RE, Ramachandran V, Logsdon CD. CEACAM1, a novel serum biomarker for pancreatic cancer. Pancreas 34: 436–443, 2007. [DOI] [PubMed] [Google Scholar]
- 48.Siragy HM. The angiotensin II type 2 receptor and the kidney. J Renin Angiotensin Aldosterone Syst 11: 33–36, 2010. [DOI] [PMC free article] [PubMed] [Google Scholar]
- 49.Siragy HM, Carey RM. The subtype-2 (AT2) angiotensin receptor regulates renal cyclic guanosine 3′, 5′-monophosphate and AT1 receptor-mediated prostaglandin E2 production in conscious rats. J Clin Invest 97: 1978–1982, 1996. [DOI] [PMC free article] [PubMed] [Google Scholar]
- 50.Siragy HM, Carey RM. The subtype 2 (AT2) angiotensin receptor mediates renal production of nitric oxide in conscious rats. J Clin Invest 100: 264–269, 1997. [DOI] [PMC free article] [PubMed] [Google Scholar]
- 51.Weber KT, Brilla CG. Myocardial fibrosis and the renin-angiotensin-aldosterone system. J Cardiovasc Pharmacol 20, Suppl 1: S48–S54, 1992. [PubMed] [Google Scholar]
- 52.Yan X, Liu Z, Chen Y. Regulation of TGF-beta signaling by Smad7. Acta Biochim Biophys Sin (Shanghai) 41: 263–272, 2009. [DOI] [PMC free article] [PubMed] [Google Scholar]
- 53.Yu Q, Chow EM, Wong H, Gu J, Mandelboim O, Gray-Owen SD, Ostrowski MA. CEACAM1 (CD66a) promotes human monocyte survival via a phosphatidylinositol 3-kinase- and AKT-dependent pathway. J Biol Chem 281: 39179–39193, 2006. [DOI] [PubMed] [Google Scholar]