

Abstract
Elevated blood fructose concentrations constitute the basis for organ dysfunction in fructose-induced metabolic syndrome. We hypothesized that diet-induced changes in blood fructose concentrations are regulated by ketohexokinase (KHK) and the fructose transporter GLUT5. Portal and systemic fructose concentrations determined by HPLC in wild-type mice fed for 7 days 0% free fructose were <0.07 mM, were independent of time after feeding, were similar to those of GLUT5−/−, and did not lead to hyperglycemia. Postprandial fructose levels, however, increased markedly in those fed isocaloric 20% fructose, causing significant hyperglycemia. Deletion of KHK prevented fructose-induced hyperglycemia, but caused dramatic hyperfructosemia (>1 mM) with reversed portal to systemic gradients. Systemic fructose in wild-type and KHK−/− mice changed by 0.34 and 1.8 mM, respectively, for every millimolar increase in portal fructose concentration. Systemic glucose varied strongly with systemic, but not portal, fructose levels in wild-type, and was independent of systemic and portal fructose in KHK−/−, mice. With ad libitum feeding for 12 wk, fructose-induced hyperglycemia in wild-type, but not hyperfructosemia in KHK−/− mice, increased HbA1c concentrations. Increasing dietary fructose to 40% intensified the hyperfructosemia of KHK−/− and the fructose-induced hyperglycemia of wild-type mice. Fructose perfusion or feeding in rats also caused duration- and dose-dependent hyperfructosemia and hyperglycemia. Significant levels of blood fructose are maintained independent of dietary fructose, KHK, and GLUT5, probably by endogenous synthesis of fructose. KHK prevents hyperfructosemia and fructose-induced hyperglycemia that would markedly increase HbA1c levels. These findings explain the hyperfructosemia of human hereditary fructosuria as well as the hyperglycemia of fructose-induced metabolic syndrome.
Keywords: diabetes, fructosuria, glucose transporter 5, ketohexokinase, metabolic syndrome
ever since alexander the great “discovered” table sugar made by drying sugar cane juice in India in 326 BC, Europe initially and the entire world eventually increased their consumption of sweeteners, especially fructose. As their sugars are converted to high-fructose syrups, sugar cane and corn are now the most cultivated crops in the world (7). The estimated fructose concentration in human diets worldwide has increased over 10-fold since the Industrial Revolution (12), a dietary switch so dramatic that the human body has been unable to adapt, as indicated by the numerous metabolic diseases now associated with excessive fructose consumption (6). Average fructose consumption rates have increased markedly in the United States, from 37 in 1978 to 49 g/day in 2004, with the top 10% of the population now consuming 75 g/day, from 64 g/day 25 yr ago (35).
Fructose is absorbed by the fructose transporter GLUT5 into the small intestinal cell and exits to the portal blood via GLUT2 in the basolateral membrane (12). Hepatic GLUT2 then mediates fructose entry from the portal blood into hepatocytes where it is metabolized by ketohexokinase (KHK or fructokinase) (18, 38). There are two KHK isoforms, KHK-C and -A, and both can metabolize fructose, but KHK-C is considered the primary enzyme involved in fructose metabolism because of its lower Michaelis constant (Km) (10). Fructolysis, unlike glycolysis, is not regulated by feedback inhibition; hence, excess fructose consumption leads to the accumulation of three-carbon metabolites in hepatocytes (36), and to elevated rates of lipogenesis. Although excessive fructose intake is now associated with nonalcoholic fatty liver disease, there have only been very few studies determining portal fructose concentrations (43), and none using the range of feeding durations and fructose doses used in this work.
While the association between high-fructose intakes and lipogenesis seems clear (32), that between dietary fructose and blood glucose is not. Fasting plasma glucose and insulin levels increased, and insulin sensitivity decreased, in humans consuming fructose but not in those consuming glucose (42). Others observed, however, that fructose has a low glycemic index, improves long-term glycemic control, does not increase blood glucose and hemoglobin A1c (HbA1c), and does not generate an insulin response in humans (8, 32). The association between fructose intake and diabetes is also unclear in animal models, but rat hyperglycemia seems associated with hyperfructosemia (43).
The half-life of intravenously administered fructose in humans is 18 min, as opposed to 43 min for glucose (18), due to KHK being 10-fold faster than glucokinase in phosphorylating their substrates (4). Estimates of blood concentrations of fructose in humans and laboratory rodents range from 0.008 to as high as 16 mM (12). Thus, there is an enormous variation in published estimates of normal systemic serum fructose concentrations. Because blood glucose is 10- to 1,000-fold greater than fructose concentration, we and others have found that enzyme-based kits, compared with chemistry-based methods like high-performance liquid chromatography (HPLC) and gas chromatography-mass spectrometry (GCMS), may overestimate low fructose concentrations (11, 44) but may be useful at ∼0.1 mM, depending on the enzyme. Postprandial fructose concentrations in the portal vein of sucrose-fed rats, analyzed by GCMS, are ∼1 mM but decrease in the systemic circulation to ∼0.2 mM (43). Fructose concentrations in the rat systemic circulation are therefore very low but may increase to ∼1 mM, analyzed by enzyme-based kits, during consumption of high-fructose diets (11). Blood fructose concentrations of fasting type 1 [0.016 mM (23)] and type 2 [0.009–0.013 mM (24)] diabetic humans are even much lower, and could only be reliably determined by GCMS or HPLC (11, 44). In contrast to that for fructose, the range of normal fasting blood glucose concentrations in all mammals only varies by <10-fold. Just as chronically high blood glucose concentrations indicate a physiological derangement in glucose homeostasis that eventually manifests itself as a metabolic disease, consistently high blood fructose concentrations may indicate derangements in fructose homeostasis as well.
Because hepatic KHK clears portal blood of most of its fructose after the first pass (30), we hypothesized that dietary fructose increases portal but not systemic serum fructose concentrations in wild-type mice. We then tested the hypotheses that KHK-A/C deletion (KHK−/−) increases, and that GLUT5 deletion (GLUT5−/−) decreases, both portal and systemic serum fructose concentrations. We also hypothesized that serum glucose is correlated with serum fructose concentrations in a KHK-dependent manner. We then fed wild-type and KHK−/− mice experimental diets with higher fructose concentrations to examine the effect of dose on serum fructose, and repeated the experiments in rats to confirm findings in another species. Finally, we tested the hypothesis that feeding habits affect blood fructose concentrations by examining representative mammalian carnivores and herbivores. We used a series of “feeding” durations that ranged from brief (in vivo perfusions of fructose solutions) to chronic (consumption of experimental diets for 12 wk, a time span roughly equivalent to 6 human years). We also used 20 (similar to the top 5% of American consumers)-63% free fructose concentrations in the diet. In light of the expected wide range of blood fructose concentrations, we analyzed all serum samples by HPLC.
MATERIALS AND METHODS
Animals and Experimental Designs
There were five sets of studies (Table 1). All procedures conducted in these studies were approved by the Institutional Animal Care and Use Committee, New Jersey Medical School, Rutgers University (Protocol No. 13001). Fructose concentrations in the sera were analyzed at the Osaka Prefecture University. In study I, three experiments were conducted. In study IA, ∼50 young adult (7-wk-old) male C57BL6 wild-type mice (∼18 g; Taconic) were divided into 10 cages and acclimatized to a reversed light cycle because our earlier work (15) showed that rodents eat <20% of their total daily food intake during daytime (light) hours, and this circadian feeding rhythm was tightly correlated with the weight of stomach contents. Mice were fed a nonpurified commercial diet ad libitum for the first 4 days. On the 5th day and then throughout the experiment, diets were removed at 2001 (lights on) and returned at 0801 (lights off). For days 8-14, diets were switched to pellets containing either 0% fructose, 10% sucrose, 20% glucose (termed as “0% fructose”) or 20% fructose, 10% sucrose, or 0% glucose (20% fructose) (Table 2). On the 15th day, mice were killed at 0800 before feeding and 0900, 1030, 1200, and 1530 during the dark phase, with n = 5 for each time point and diet. After 7.5 h, mice consumed ∼80% of what they would otherwise eat over 24 h.
Table 1.
Overview of different experimental approaches to studies of serum fructose concentrations
| Model | Purpose | Dieta | |
|---|---|---|---|
| Study I | |||
| IA | Wild-type mice | Role of transport and metabolism on postprandial fructose levels in the portal and systemic circulations | 20% Free fructose with 10% sucrose |
| IB | KHK−/− mice | ||
| IC | GLUT5−/− mice | ||
| Study II | Wild-type and KHK−/− mice | Chronic effects of diet on HbA1c and glycemia in systemic | 20% Free fructose with 10% sucrose |
| Study III | |||
| IIIA | Wild-type and KHK−/− mice | Effect of fructose dose | 40% Free fructose |
| IIIB | Wild type | Effect of fructose dose over 7 days | 40% Free fructose |
| Study IV | |||
| IVA | Rats | Effect of duration, 5 and 30 days; comparative | 63% Free fructose |
| IVB | Rats | Effect of dose; compare with mice | 40% Free fructose |
| IVC | Rats | Effect of intestinal fructose perfusion on portal and systemic | 50 mM fructose in modified Ringer solution |
| Study V | Horse, cat, goat | Effect of feeding habit on fasting fructose | Regular diet before overnight fast |
KHK, ketohexokinase.
The control diet was always isocaloric, isonitrogenous, and isosmotic (where applicable) glucose.
Table 2.
Composition and energy content of the experimental diet used in studies I and II (Figs. 2–6)
| Glucose | Fructose | |
|---|---|---|
| Ingredients, g/kg | ||
| Casein | 140 | 140 |
| l-Cystine | 1.8 | 1.8 |
| Corn starch | 295.7 | 295.7 |
| Maltodextrin 10 | 125 | 125 |
| Dextrose (glucose) | 200 | 0 |
| Fructose | 0 | 200 |
| Sucrose | 100 | 100 |
| Cellulose, BW200 | 70.7 | 70.7 |
| Soybean oil | 40 | 40 |
| t-Butylhydroquinone | 0.008 | 0.008 |
| Mineral Mix S10022Ma | 35 | 35 |
| Vitamin Mix V10037b | 10 | 10 |
| Choline bitartrate | 2.5 | 2.5 |
| Total weight, g | 1029.3 | 1029.3 |
| %Energy | ||
| Protein | 15 | 15 |
| Carbohydrate | 76 | 76 |
| Fat | 9 | 9 |
In studies III and IVB, the experimental diet had 40% free fructose and the control diet 40% free glucose, with all other ingredients being exactly the same. In study IVA, the experimental diet had 63% free fructose (63% free glucose as control), with all other ingredients also being exactly the same.
The mineral mix composition (AIN-93M) was as follows (amount in 35 g): 5.0 g Ca, 2.0 g Pi, 0.5 g Mg, 3.6 g K, 0.3 g S, 1.0 g Na, 1.6 g Cl, 6.0 mg Cu, 0.2 mg I, 45.0 mg Fe, 10.5 mg Mn, 0.2 mg Se, and 30.0 mg Zn.
The vitamin mixture composition (AIN-93) was as follows (amount in 10 g): 4,000 IU vitamin A palmitate, 1,000 IU cholecalciferol, 75 IU vitamin E acetate, 0.75 mg phylloquinone, 0.2 mg biotin, 25 μg cyanocobalamin, 2 mg folic acid, 30 mg nicotinic acid, 16 mg calcium pantothenate, 7 mg pyridoxine hydrochloride, 6 mg riboflavin, 6 mg thiamin HCl.
In study IB, the experiment was repeated using KHK−/− mice. Generation of KHK−/− (background: C57BL6) mice donated by R. J. Johnson, University of Colorado, was described previously (10). We simultaneously bred 10 male and 20 female KHK−/− mice in 10 breeding cages and then selected litters (6–8 pups in each litter) born ± 3 days of each other. After being weaned, 30 male mice were distributed into 10 cages. Mice were fed chow to satiety for an additional 4 wk (body wt ∼18 g) at which time the light cycle was reversed for 1 wk. The protocol described for wild-type mice was then followed. Briefly, mice in five cages were fed with 0% free fructose, the other five with 20%. On the last day, one mouse from each cage was killed at 0800, 1030, and 1530, for a total of n = 5 mice/diet for each time point.
Study IC was conducted using GLUT5−/− mice (background: C57BL6) donated by J. Zuo, St. Jude's Children's Research Hospital (47). Because the breeding of GLUT5−/− produced small litters (2–4 pups) that were disproportionately female, only 10 male mice of similar age were produced from a large number of breeders. These were fed 0 or 20% fructose. Because GLUT5−/− mice cannot tolerate fructose (1), these mice were provided the experimental diets at 0801 and then killed at 1530 the day of the experiment. The absence of KHK and GLUT5 mRNA expression in various tissues from KHK−/− and GLUT5−/− mice, respectively, has been shown previously (45) and confirmed (data not shown).
In study II, the same 20% free fructose or glucose diets were fed ad libitum to KHK−/− and wild-type mice (n = 5–6 each diet) under reversed light cycle, for 12 wk before death and blood collection (n = 5–6 each diet) when mice were in the dark. Wild-type C57BL mice were obtained from heterozygous descendants of KHK−/− and wild-type matings.
Because our 20% free fructose diets contained 10% sucrose, we made diets containing 40% fructose or glucose [without sucrose (13) to evaluate the effect of higher fructose concentrations (study III)]. Because preliminary work (data not shown) indicated that intake of 40% fructose tended to decrease in KHK−/− mice after a few days, KHK−/− and wild-type mice adapted to reversed light cycle were killed 7.5 h after initial intake (n = 5 each diet). In study IIIB, wild-type but not KHK−/− mice were fed these same diets for 7 days.
In study IV, we used in vivo (feeding) and ex vivo (intestinal perfusion) methods in young adult male F344 rats (8 wk old). In study IVA, rats were fed (n = 4) an isocaloric, isonitrogenous 63% fructose or glucose diet for 5 and 30 days. In study IVB, rats were fed an isocaloric, isonitrogenous 40% fructose or glucose diet for 5 days (n = 6). In study IVC, 10 rats were perfused with either 50 mM fructose or 50 mM glucose (control) Ringer solutions. These concentrations were chosen because luminal fructose concentration is ∼30 mM, and 50 mM fructose upregulates within 3–4 h the expression of genes involved in fructose transport and metabolism (21, 38).
In study V, we obtained sera (fasted, males, n = 4 each species) of different mammalian species [carnivorous cat (Felis catus), herbivorous nonruminant horse (Equus ferus), and herbivorous ruminant goat (Capra aegagrus)] from BioChemed Services (Winchester, VA).
Experimental Fructose Diets
We used dietary constituents and concentrations that are well tolerated and consumed at similar rates by wild-type rodents (13, 21) (Table 2). Preliminary work estimated that the 20% free fructose diet used in studies I and II is the maximum that can be chronically tolerated by KHK−/− mice (data not shown). This should not come as a surprise, since humans with fructosuria can readily tolerate dietary fructose (18, 29). In studies III and IVB, the experimental diet had 40% free fructose with no other sugar (13). In study IVA, the experimental diet had 63% free fructose (13, 21). In all experiments, glucose isocalorically replaced fructose in control diets, with all other ingredients being exactly the same.
The American Institute of Nutrition recommends either 73% [AIN-93M (maintenance) diet] or 63% [AIN-93G (growth) diet] carbohydrate, levels higher than the average for humans (54%) consuming a high-carbohydrate diet (25). Fructose constitutes ∼10% of the total energy intake of the average American (35), although the top 5% consumers have energy intakes from fructose reaching ∼20%. Thus, rodents consuming 20% fructose have similar dietary levels as the high-fructose consumers. Rodents consuming 30–40% sugars are actually eating about one-half of the recommended carbohydrate concentration in a standard adult rodent diet, whereas humans eating 20% sugars are consuming less than one-half of recommended carbohydrate concentrations (25). Lower fructose concentrations readily induce metabolic syndrome if glucose is present in equimolar concentrations (22) and cause similar deleterious effects as higher fructose concentrations if consumed for a longer time period (3, 13).
Intestinal Perfusion
Briefly, rats were anesthetized (20% ketamine and 12.5% xylazine in saline, 2.5 ml/kg body wt ip), and the abdominal cavity was opened (21). About 10 cm distal to the stomach, a small incision was made, and a catheter inlet was inserted in the lumen and then secured. After the contents were flushed, the intestine was continuously perfused with sugar solution (50 mM fructose or glucose in Ringer, 37°C, 30 ml/h).
Analysis of Blood HbA1c and Glucose and Serum Fructose
After animals were anesthetized, blood was collected from the heart only (if portal blood was not sampled), or from the portal vein initially (∼0.25 ml) and then the heart (∼0.5–1 ml) if portal and systemic concentrations were being compared. Blood glucose was determined by an Omnis Embrace glucometer (Nashville, TN) calibrated with 0, 10, and 20 mM glucose and glycated hemoglobin (HbA1c) by Contour A1cNow (Bayer, Pittsburgh, PA).
Serum fructose was analyzed by HPLC as previously described (44). Briefly, blood was allowed to clot and centrifuged gently (500 g), and serum was collected. Aliquots (50–100 μl) for fructose assays were treated 1:1 (vol/vol) with acetonitrile, and the supernatant was stored in −70°C after centrifugation at 10,000 g for 1 min at 4°C. Each sample was analyzed two to four times. The sample solution was filtered through a 0.45-μm membrane just before analysis. Briefly, HPLC was performed using a GL-7400 series system (GL Sciences, Tokyo, Japan) equipped with a polymer-based amino column Shodex Asahipak NH2P-50 4E (4.6 mm ID × 250 mm; Showa Denko, Tokyo, Japan) with a guard column at an injection volume of 5 μl. When initial analysis determines that concentration of fructose was <50 μM, samples were reanalyzed at an injection volume of 20 μl again. The separation of fructose was performed with a linear gradient as previously described (44) in hydrophilic interaction chromatography mode. The flow rate and column temperature were 1.0 ml/min and 40°C, respectively. Postcolumn labeling of fructose with phenylhydrazine was taken at 150°C in a reactor 522 (Flom, Tokyo, Japan), and the flow rate of reaction reagent (mixture with 180 ml of acetic acid, 6 ml of phenylhydrazine, and 220 ml of phosphoric acid) was 0.4 ml/min. The fluorescence detector GL-7453 (GL Sciences) was set at 330 nm excitation wavelength and 470 nm emission wavelength. Data were analyzed using EZChrom Elite version 3.1.5J (Agilent Technologies).
Statistical Analysis
Data are presented as means ± SE. A three-way ANOVA analyzed the effects of dietary fructose, of time after feeding, and of sample location (portal or systemic) in wild-type and KHK−/− mice, as well as the effects of genotype, dietary fructose, and sample location (study IA to C). A one- or two-way ANOVA was used to analyze the effect of diet and/or genotype and/or sample location. If higher-level ANOVAs yielded significant treatment or interaction effects, a one-way ANOVA followed by least-significant difference test (STATVIEW; Abacus Concepts) determined differences among means, and was used to portray differences among bars or points in Figs. 1–7. Simple linear regressions analyzed the relationship between portal and systemic sugar concentrations.
Fig. 1.

Portal and systemic serum fructose and blood glucose concentrations in wild-type (A and C) and KHK−/− (B and D) mice fed isocaloric 0 or 20% free fructose diets for 1 wk. Symbols and error bars are means ± SE (n = 4–5 mice). Statistical analyses (*) are described in the text. The free fructose diet increased serum fructose levels in both wild-type and KHK−/− mice, and blood glucose levels only in wild-type mice.
Fig. 7.

Food intake over the 7.5-h sampling period (A) of wild-type and KHK−/− mice used in studies 1A and B. Nos. of KHK−/− mice were sufficient only for the 0-, 2.5-, and 7.5-h time points. The amount of food was determined after death at each time point. Mean daily food intake (B) and initial (C) as well as final (D) body weights of mice fed experimental diets for 12 wk in study 2.
RESULTS
Effect of Dietary Fructose and Time After Feeding
Serum fructose.
When analyzed by a three-way ANOVA, there was a highly significant effect of diet (P < 0.0001) but not of time (P = 0.072) and sample location (portal vs. systemic, P = 0.068) on serum fructose concentrations in wild-type mice (Fig. 1A). There were no significant interactions among treatments. In mice fed 0% fructose, portal (0.060 ± 0.006 mM, overall mean for all time points) and systemic (0.030 ± 0.003 mM) fructose concentrations did not vary with time after feeding. In contrast, portal concentrations in wild-type mice consuming 20% fructose increased by more than twofold from time (t) = 0 to t = 1 h after feeding (∼0.13 mM). Likewise, systemic serum fructose went from 0.037 at t = 0 to 0.13 mM 1 h after feeding. Fasted (t = 0) serum fructose in the 20% group was similar to postprandial concentrations in the 0% mice for both portal and systemic levels, suggesting that the baseline fructose concentration during fasting is not affected by diet. Mean fructose concentration in all serum samples at t ≥ 1 h from mice fed 20% fructose was about threefold greater than that in mice fed 0%.
Serum fructose concentrations in KHK−/− mice were 5- to 100-fold greater than those in wild-type mice for the same diet, time, and sample location. The effects of diet, time, and sample location on serum fructose were very highly significant (P < 0.0001 for each factor) and interacted significantly with one another (P < 0.001 in all cases, Fig. 1B). Except at t = 0, systemic was always approximately twofold greater than portal fructose concentrations in both diets. Postfeeding fructose levels in the portal and systemic circulations each increased by 1.5- to 3-fold with dietary fructose. Serum fructose was <0.5 mM at t = 0 h, but then increased markedly with time, and the magnitude of increases depended on diet.
Blood glucose.
There was a significant effect of dietary fructose (P = 0.01), time after feeding (P = 0.001), and sample location (P = 0.05) on blood glucose concentrations in wild-type mice (Fig. 1C). The interaction between diet and time was significant (P = 0.04). Mean (for all time points) portal and systemic glucose concentrations in mice fed 20% fructose were ∼3 (P = 0.004) and ∼2 (P = 0.04) mM greater, respectively, than those in mice fed 0%. Because our 0% fructose diet had 20% free glucose while our 20% fructose diet had 0% free glucose (both had 10% sucrose), it was interesting to note that the diet containing 20% fructose resulted in higher portal and systemic glucose concentrations in feeding mice! Thus mice fed fructose consistently had higher glucose concentrations than mice fed glucose, except at t = 0 h after an overnight fast.
In the fasted state at 0 h, portal was similar to systemic glucose concentrations (both ∼15.5 mM) in mice fed 0% fructose, and was also similar (both ∼11.2 mM) in mice fed 20% fructose. Upon initiation of feeding, portal and systemic glucose levels decreased significantly in mice fed 0% fructose and then increased gradually. This initial decrease may be due to insulin released by dietary free glucose. In mice fed 20% fructose, there was no corresponding decrease in blood glucose, only a gradual increase to ∼20 mM.
In stark contrast to serum fructose in KHK−/−, and to glucose concentrations in wild-type mice, which varied markedly with diet, time, and sample location, serum glucose concentrations in KHK−/− mice were independent of these factors (P = 0.61 for diet, 0.08 for time, and 0.54 for sample location) (Fig. 1D). There were no significant interactions (P ≥ 0.43) among the factors being studied.
Sugar Levels in Fed and Fasted Mice
At t = 0 h (before feeding, Fig. 2A), genotype (P < 0.0001) and diet (P = 0.002) but not sample location (P = 0.28) had significant effects on serum fructose concentrations. There were significant interactions among these factors (P = 0.0003–0.03) because portal concentrations were always greater than systemic in wild-type mice fed both diets and in KHK−/− mice fed 0% fructose. In sharp contrast, systemic fructose levels were surprisingly fourfold greater than portal in KHK−/− mice fed 20% fructose. Thus, the effect of diet on fasting serum fructose level depended on genotype and sample location.
Fig. 2.

Portal and systemic serum fructose and blood glucose concentrations in mice killed at 0800 after an overnight fast (A and C) and at 1530 while actively feeding (B and D). Bars [means ± SE (n = 4–5)] with different superscript letters are significantly different. When fasted, mouse serum fructose levels were generally higher in KHK−/− compared with wild-type mice, but dietary fructose level had no major effect. When fed, serum fructose levels were dramatically higher in KHK−/− compared with wild-type and GLUT5−/− mice, and in 20% compared with 0% fructose diets. Blood glucose levels did not vary significantly with genotype, diet, and sample location. Because GLUT5−/− mice cannot tolerate fructose for an extended time, these mice were provided the experimental diets at 0801 and then killed at 1530 the day of the experiment. Moreover, these mice produce infrequent small litters; thus, getting male mice of the same age was very limited, despite a remarkable effort at mating a large number of breeders.
At t = 7.5 h after initial feeding (Fig. 2B), genotype, diet, and sample location each had highly significant effects on serum fructose levels (P < 0.0005 in all cases). There were significant interactions between genotype and diet (P < 0.0001), between genotype and sample location (P < 0.0001), but not between diet and sample location (P = 0.16). KHK−/− had 10- to 45-fold more serum fructose than wild-type and GLUT5−/− mice. Dietary fructose increased serum fructose by 2- to 3-fold in wild-type and KHK−/− mice and by 5- to 10-fold in GLUT5−/− mice. For the same diet, portal was generally similar to systemic fructose concentrations in GLUT5−/−, twofold greater than systemic in wild-type, and paradoxically twofold less than systemic in KHK−/− mice.
At t = 0, serum glucose concentrations were independent of genotype, diet, and sample location (P ≥ 0.15) (Fig. 2C). Thus, these various factors had no effect on serum glucose concentrations after an overnight fast. At 7.5 h postfeeding, genotype and diet had no effect on serum glucose (P > 0.10), but sample location had a modest effect (P = 0.02) (Fig. 2D). The interactions among factors were each not significant. Across all treatments, portal glucose concentrations were typically ∼3 mM greater than systemic in fed wild-type, GLUT5−/−, and KHK−/− mice, in contrast to those of fasting mice (Fig. 2C) in which portal were always similar to systemic glucose levels.
Interactions between Portal and Systemic
Although concentrations were typically very low in wild-type mice, systemic fructose changed (P = 0.05, Fig. 3A) by 0.34 ± 0.17 mM for every 1 mM change in portal fructose levels. Systemic glucose also varied highly significantly by 0.68 ± 0.07 mM for every 1 mM change in portal glucose (P < 0.0001, Fig. 3B).
Fig. 3.

Systemic serum fructose and blood glucose concentrations as a function of portal serum fructose (A) and blood glucose (B) concentrations, respectively, in wild-type mice. Systemic fructose was not significantly linked to portal fructose, but systemic glucose varied strongly with portal glucose. Similar analyses were conducted using KHK−/− mice (C and D). Systemic fructose was significantly linked to portal fructose in KHK−/− mice. Unlike wild-type mice, systemic was independent of portal glucose in KHK−/− mice.
Systemic fructose levels in KHK−/− mice also increased highly significantly (P < 0.0001) by 1.8 ± 0.2 mM for every 1 mM increase in portal fructose (Fig. 3C). Thus, without KHK, not only were serum fructose concentrations relatively high, but also a small change in portal fructose level affected systemic fructose markedly.
In sharp contrast to that of wild-type mice, systemic was independent of portal glucose concentrations in KHK−/− mice (P = 0.17, Fig. 3D). Because systemic glucose was directly regulated by portal glucose level in wild-type but not KHK−/− mice, fructose metabolism by KHK must contribute significantly to blood glucose levels, as will be further established below.
The correlations between serum glucose and fructose are even more interesting. Systemic glucose was tightly correlated with systemic fructose in wild-type mice, and it changed by 35 ± 9 mM for each millimolar change in fructose (P = 0.001, Fig. 4A). Thus, a small change in systemic serum fructose concentration profoundly affected glycemia in wild-type mice. However, there was no effect of portal fructose on systemic glucose (P = 0.38, data not shown), and of portal fructose on portal glucose levels (P = 0.13, data not shown) in wild-type mice. In KHK−/− mice, systemic glucose was independent of systemic fructose concentrations (P = 0.87, Fig. 4B), suggesting that the link between fructosemia and glycemia in wild-type mice may be dependent on KHK-mediated fructose metabolism in peripheral organs. There was also no effect of portal fructose levels on portal glucose (P = 0.25, data not shown) and on systemic glucose (P = 0.81) in KHK−/− mice.
Fig. 4.
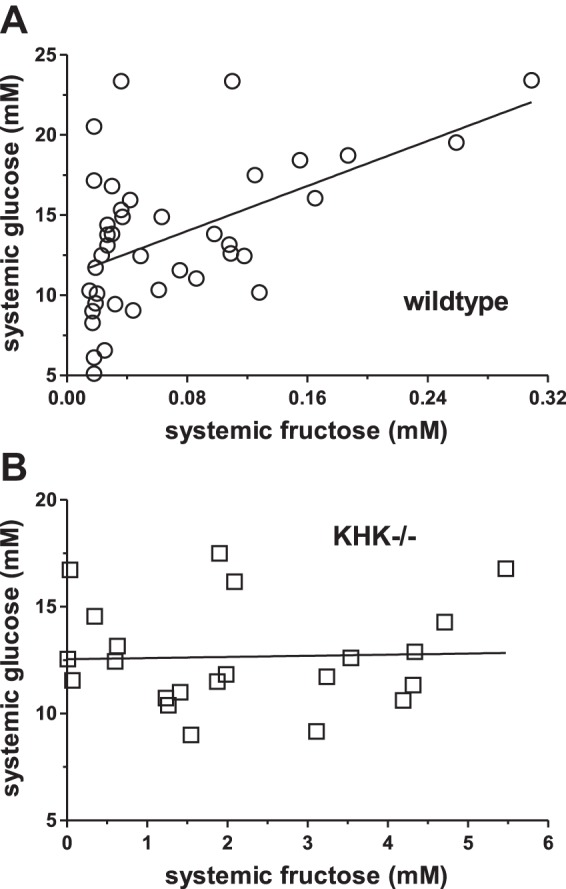
Systemic blood glucose concentrations as a function of systemic serum fructose concentrations in wild-type (A) and KHK−/− (B) mice. Systemic glucose was significantly linked to systemic fructose concentrations in wild-type but not in KHK−/− mice.
Chronic Effects of Dietary Fructose on Serum Sugar
After 12 wk of feeding, genotype (P < 0.001 by 2-way ANOVA) and diet (P = 0.04) continued to have significant effects on systemic serum fructose levels (Fig. 5A); the interaction was significant, since diet effects depended on genotype (P = 0.05). Systemic fructose concentrations were approximately threefold greater in KHK−/− mice fed fructose compared with those fed glucose, but were similar between glucose- and fructose-fed wild-type mice. Systemic serum fructose levels were 30- to 80-fold greater in KHK−/− compared with wild-type mice, regardless of diet.
Fig. 5.
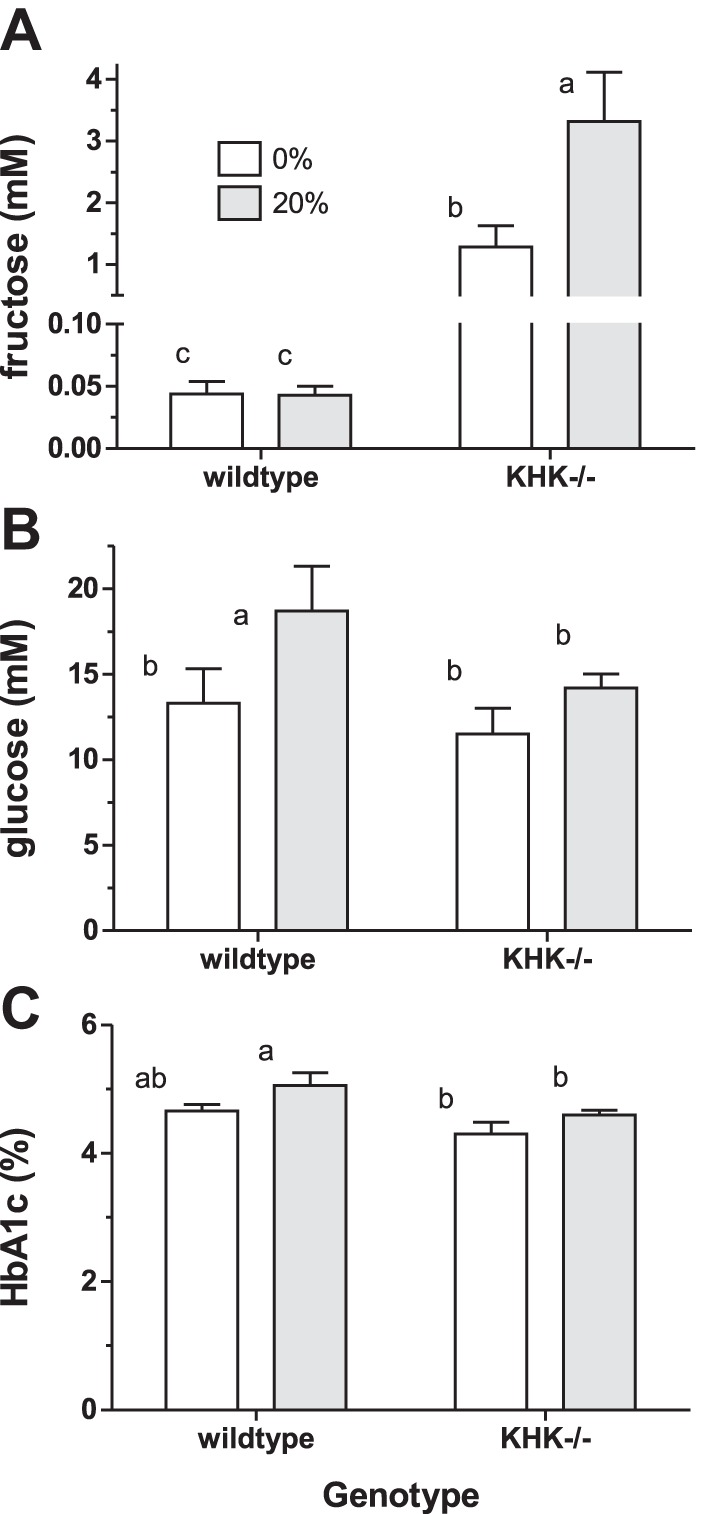
Systemic serum fructose (A), blood glucose (B), and HbA1c (C) concentrations in wild-type and KHK−/− mice fed fructose for 12 wk. Bars [means ± SE (n = 4–5)] with different superscript letters are significantly different. Serum fructose concentrations are high in KHK−/− mice and increase with dietary fructose. Chronic fructose consumption affects blood glucose and HbA1c levels in wild-type but not KHK−/− mice.
Genotype (P = 0.09 and 0.01) and diet (P = 0.04 and 0.02) had modest effects on blood glucose (Fig. 5B) and HbA1c (Fig. 5C) levels, respectively. Blood glucose and HbA1c levels were greater in wild-type but not KHK−/− mice chronically fed 20% fructose. HbA1c levels were 1.3-fold (∼0.40% in absolute amounts) greater in wild-type compared with KHK−/− mice, regardless of diet.
Acute Effects of Increased Dietary Fructose
About 8 h after wild-type and KHK−/− mice were acutely fed 40% fructose, we found highly significant genotype (P < 0.0001), diet (P < 0.0001), and location (P = 0.002) effects on serum fructose and significant interactions among treatments (P < 0.0001–0.04). Fructose concentrations in wild-type mice fed 0% fructose were very low, <0.07 mM, in both portal and systemic circulations, and, when fed 40% fructose, increased by 10- to 20-fold (Fig. 6A). KHK ablation further increased serum fructose, by five- to eightfold, depending on diet. It is interesting to note that serum fructose concentration was already >0.5 mM in KHK−/− mice fed 0% fructose, even though these mice were only previously fed chow and thus have never consumed fructose. When compared with mice fed 20% fructose as depicted in Fig. 2B, consumption of increasing levels of dietary fructose seems to increase serum fructose in both KHK−/− and wild-type mice.
Fig. 6.
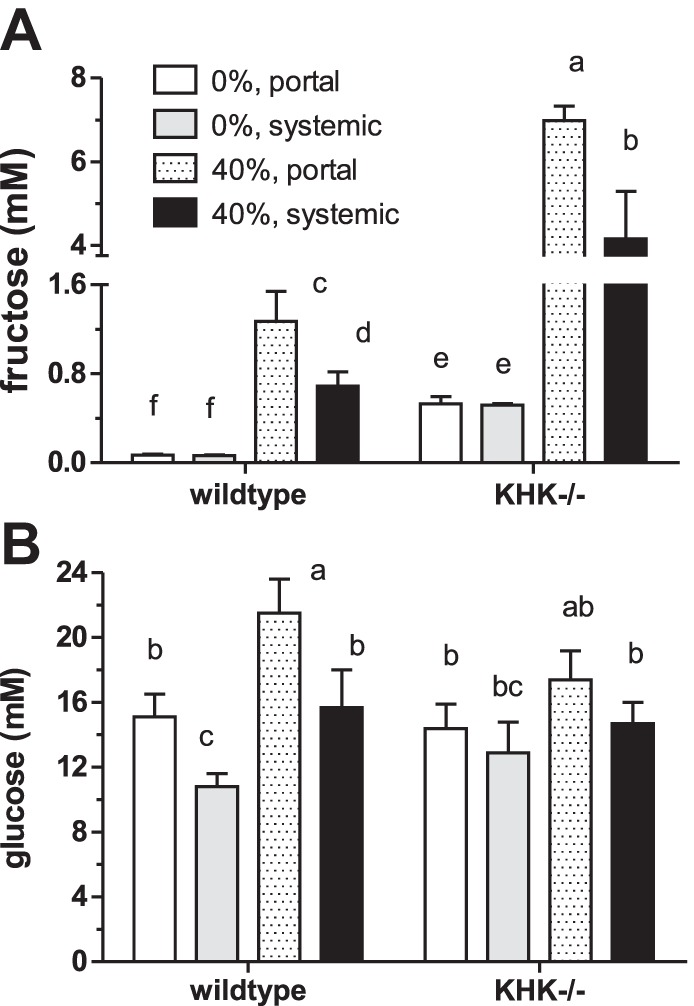
Serum fructose (A) and blood glucose (B) concentrations in wild-type and KHK−/− mice fed isocaloric 0 and 40% fructose diets for 7.5 h. Bars [means ± SE (n = 5)] with different superscript letters are significantly different. Serum fructose concentrations are much higher in KHK−/− mice and increase with dietary fructose.
Diet (P = 0.002) and sample location (P < 0.001) but not genotype had significant effects on serum glucose (Fig. 6B). Dietary fructose dramatically increased serum glucose, and portal was always greater than systemic glucose levels.
When wild-type mice were fed the same 40% fructose diets for 1 wk [KHK−/− mice could not tolerate this much fructose (data not shown)], systemic serum fructose levels decreased to 0.011 ± 0.003 for those fed 0% and to 0.039 ± 0.008 mM for those fed 40% fructose (compare with Fig. 6A), suggesting some adaptation to diet.
Serum Fructose in Rats Fed or Perfused with Fructose
Dietary fructose at 63% levels (P = 0.02) but not feeding duration (P = 0.17) increased by three- to sixfold systemic fructose concentrations in rats (Table 3). Serum glucose concentrations increased by 25% with dietary fructose (P = 0.01) and with feeding duration (P = 0.02). Thus, as in wild-type mice, fructose feeding induces hyperglycemia that becomes worse with length of time of feeding.
Table 3.
Effect of dietary fructose and intestinal fructose perfusion on systemic serum fructose and glucose concentrations in young adult male rats
| Diet or Perfusion Solution | Duration (days) or Location | Serum Fructose, mM | Serum Glucose, mM |
|---|---|---|---|
| Study IVA | |||
| Glucose (63%) | 5 | 0.025 ± 0.010a | 15.0 ± 1.2x |
| Fructose (63%) | 5 | 0.154 ± 0.045b | 18.8 ± 0.8y |
| Glucose (63%) | 30 | 0.020 ± 0.003a | 18.5 ± 1.3x,y |
| Fructose (63%) | 30 | 0.070 ± 0.031b | 23.4 ± 2.4z |
| Study IVB | |||
| Glucose (40%) | 5 | 0.010 ± 0.003a | 20.8 ± 1.5x |
| Fructose (40%) | 5 | 0.077 ± 0.025b | 25.4 ± 1.2y |
| Study IVC | |||
| Glucose (50 mM) | Portal | 0.111 ± 0.030a | 34.6 ± 2.7x |
| Systemic | 0.070 ± 0.044a | 40.6 ± 4.3x | |
| Fructose (50 mM) | Portal | 0.534 ± 0.041c | 20.8 ± 2.2y |
| Systemic | 0.319 ± 0.075b | 24.2 ± 3.0y | |
Values are means ± SE. Means with different superscripts are statistically different (P < 0.05).
Rats fed dietary fructose at 40% concentrations for 5 days increased by sevenfold their systemic serum fructose concentrations (P = 0.04). Serum glucose was 25% greater in fructose- compared with glucose-fed rats, confirming earlier findings. When we perfused intestines with 50 mM fructose or glucose, there was a highly significant effect on serum fructose concentrations (P < 0.0001), and there was a modest difference between portal and systemic fructose levels (P = 0.01) (Table 3). There was no significant interaction between these two factors (P = 0.09).
Continuous glucose perfusion for 4 h likely swamped insulin regulation, resulting in marked hyperglycemia by 70% (P = 0.0002) compared with fructose perfused. Portal and systemic circulations were similar to one another (P = 0.15).
Comparative Serum Fructose Concentrations
Serum fructose concentration was generally similar between rats fed 40 and 63% fructose, as well as between rats fed 40 and 63% glucose. Wild-type mice fed 40% fructose for a similar length of time (5 days) had similar levels of systemic serum fructose (0.011 mM) as those (0.010 mM) in rats fed the same diet. Serum fructose concentration was below 0.01 mM in sera obtained from the horse, cat, and goat, likely because these animals were not fed dietary fructose and were also fasted overnight. Serum glucose concentrations for these fasted horses, cats, and goats were 4.96 ± 0.28, 11.8 ± 1.2, and 2.50 ± 0.19 mM (n = 4), respectively.
Food Intake and Body Weight
In study I, total food consumed after 7.5 h of feeding on the day of death was similar among groups (P = 0.9 by 1-way ANOVA) (Fig. 7A). There was also no effect of genotype (P = 0.57 by 2-way ANOVA) and diet (P = 0.71) on final body weights (data not shown); there was no interaction (P = 0.43). Chronic feeding of fructose, while causing hyperinsulinemia, does not significantly alter food intake or cause weight gain in rodents (41).
In study II, average daily food consumption over time did not differ significantly between diets (P = 0.39 by 2-way ANOVA) and between genotypes (P = 24) with insignificant interaction (P = 0.61) (Fig. 7B). Initial body weights did not differ between diets (P = 0.83) but did differ slightly (∼5%) between wild-type and KHK−/− mice (P = 0.04) (Fig. 7C); there was no interaction (P = 0.85). Final body weights were not affected by genotype (P = 0.09) but were modestly affected by diet (P = 0.03) and with modest interaction (P = 0.02) (Fig. 7D). This finding could be explained by differences in caloric intake, since KHK−/− mice could use 20% glucose but could not metabolize 20% fructose. As will be discussed below, the 5- to 100-fold increase in serum fructose level in KHK−/− mice may reach concentrations high enough as to allow other low-affinity enzymes to catabolize fructose for use as energy source by these mice. Balancing caloric intake and evaluating fructose effects are not possible when using KHK−/− mice (20, 34).
In study IVA and -B, isocaloric 63 and 40% glucose or fructose diets were consumed at equal rates by rats, as we showed many times previously (13).
DISCUSSION
Our main findings are that portal and systemic fructose concentrations in wild-type mice, rats, and other mammals are typically lower than 0.1 mM when fasting or consuming fructose-free, low-sucrose diets, but increase modestly to only ∼0.2–1 mM when fed 20 to 40% fructose. Because its deletion causes dramatic increases in blood fructose, KHK clearly prevents hyperfructosemia. Because high-fructose intakes are associated with hyperglycemia that ultimately increases HbA1c levels, KHK also prevents fructose-induced hyperglycemia. A low but consistently significant concentration of fructose is detected in the portal and systemic circulations of rats as well as wild-type, KHK−/− and GLUT5−/− mice fed no fructose, suggesting endogenous synthesis independent of KHK and GLUT5.
Ketohexokinase is Essential in Preventing Hyperfructosemia
Like our findings, Ishimoto et al. (20) observed hyperfructosemia in chow-fed KHK−/− mice drinking 30% fructose solutions. The enormous difference in their findings of fructose-induced hyperfructosemia (1.5-fold more fructose) from ours (∼5- to 100-fold) may be due to differences in fructose intake, or to differences in analytical methods, since they used enzyme-based kits that can overestimate low blood fructose.
In wild-type mice, hepatic KHK clears fructose from the blood as evidenced by small changes in systemic as a function of portal fructose levels (0.3 mM/1 mM portal) compared with large increases in KHK−/− mice (1.8 mM systemic/1 mM portal). Thus, KHK removes fructose from portal blood in wild-type mice. Hepatic fructose uptake is a function of portal concentration, since the liver clears over 70% of portal fructose in fasted but only 55% in fed rats (30). Because systemic is always less than portal fructose levels in all wild-type mice regardless of diet, KHK deletion seems to lead to the accumulation of fructose in the systemic circulation. This is observed mainly after chronic consumption by KHK−/− mice of a high-fructose diet, suggesting that, under these conditions, fructose is added by the liver to the portal blood, or that a systemic fructose “sink” is saturated.
The KHK−/− mice used in this study are missing both KHK-C and KHK-A isoforms (10). While KHK-C is considered more physiological because its Km for fructose is <1 mM, KHK-A, whose Km is 8 mM, may be recruited when fructose intake is excessive, because fructose-induced metabolic syndrome is exacerbated in mice lacking KHK-A (20). Thus, removal of KHK-A from skeletal muscle and adipose tissue prevents fructose metabolism by these large organ systems that acted as a fructose sink, resulting in accumulation of fructose in the systemic circulation. Targeted deletions of KHK should increase our understanding of the role of these various organ systems in fructosemia.
Because serum concentrations in KHK−/− mice chronically fed fructose did not increase beyond ∼8 mM, where did fructose go? Although skeletal muscle, adipose tissue, and other organ systems have various hexokinase isoforms, their Km for fructose is 10- to 100-fold greater than that for glucose (18, 30). Thus, hexokinase-mediated fructose metabolism in KHK-expressing wild-type mice is negligible. However, at serum fructose concentrations found in KHK−/− mice, GLUT5 (Km = 8 mM) can absorb fructose into skeletal muscle and adipose tissue (31). Hexokinase I-mediated fructolysis in skeletal muscle and adipose tissue can then occur at rates 20–70% that of glycolysis in wild-type mice (18). In fact, in fructosuric patients, up to 90% of intravenously administered fructose can be metabolized by adipocyte hexokinase into fructose 6-phosphate (17). Thus, it is possible that hexokinase prevents hyperfructosemia above 10 mM.
We were quite surprised at the reversed portal to systemic fructose concentrations in KHK−/− mice, since it is not clear how higher fructose concentrations can be chronically maintained in the systemic relative to the portal circulation. Recall, however, that in KHK−/− mice, the liver seems to add fructose to portal blood, but adipocytes and skeletal muscle may be limited in their ability to metabolize fructose (18, 31). In humans, concentrations of leptin produced mainly by subcutaneous adipose tissue are typically greater in the systemic compared with portal concentrations (16). Large, 2- to 60-fold differences in insulin concentrations between portal and systemic circulations are also sustained in humans even as glucose concentrations remain similar (19), suggesting that anatomic location of regulatory organs influences portal and systemic differences in concentrations. There are also significant differences in steady-state fructose and pyruvate concentrations maintained among maternal, umbilical, and fetal circulations (46).
Essential Fructosuria and Caloric Intake
Because they cannot metabolize fructose, the caloric intakes of KHK−/− and GLUT5−/− are less than that of wild-type mice consuming the same fructose-containing diet. This is a potential confounding factor in all of our results. However, while diarrhea is a potential consequence of fructose feeding in GLUT5−/− mice (1), KHK deletion in mice, up to a total dietary concentration of 20–25% fructose, seems asymptomatic, probably because of hexokinase-mediated fructose metabolism as explained above. In humans, essential or hereditary fructosuria, which is caused by a mutation of the KHK structural gene (5), is a benign, asymptomatic metabolic anomaly and differs from the potentially lethal hereditary fructose intolerance disease caused by absence of aldolase B (18). Given its benign character, essential fructosuria may be undetected in many individuals whose systemic serum fructose concentrations can remain at 2–3 mM as long as they consume fructose-containing foods (29). Essential fructosuria, and its consequent fructosemia, has been reported in many countries, and, in 1961, 18 of 50 Jewish individuals were found to have fructosuria, although a frequency of 1:130,000 has also been reported (see review in Ref. 18).
Role of GLUT5
Because 10% sucrose was present in both the 20% fructose and 20% glucose diets consumed by GLUT5−/− mice, the fourfold increase in serum fructose concentrations must come from the 20% free fructose in the diet (Fig. 2B). The diet-induced increase in concentration of portal serum fructose in GLUT5−/− mice suggests that some fructose transport may be paracellular at high luminal fructose concentrations. We have recently confirmed that GLUT5 is the primary intestinal fructose transporter and that intestinal GLUT5 is rapidly inducible by dietary fructose (37). In contrast, GLUT7, -8, and -12 expression in mouse small intestine is vanishingly low, is not regulated by dietary fructose, and does not compensate when GLUT5 is ablated.
Although GLUT5 is modestly expressed in skeletal muscle (26), it may play an important role in whole body fructose homeostasis because of its large mass. GLUT5 is also expressed in adipocytes (31) where it is required for differentiation (14). Without muscle and adipocyte GLUT5, fructose that otherwise would be transported into and then metabolized by these cells could remain in circulation, causing hyperfructosemia.
Systemic Fructose Concentrations and Endogenous Fructose Synthesis
We and others found GLUT5−/− mice fed fructose-free diets to have systemic serum fructose levels similar to those of wild-type mice (1), suggesting that fructose must be synthesized and subsequently transported out of fructose-synthesizing cells to the blood via transporters other than GLUT5 (12). In support of this suggestion, we and others observed that KHK−/− mice that were not fed fructose have serum fructose concentrations much greater than those of wild-type mice also fed no fructose (20). All of our wild-type mice and rats also have 0.01–0.05 mM serum fructose levels even if consuming fructose-free diets. These findings suggest that rodents synthesize fructose, that endogenous synthesis is KHK independent, and that export of endogenous fructose from cells to the blood is GLUT5 independent.
Fructose can be synthesized from glucose in mammalian tissues by the polyol pathway (36), first by the rate-limiting enzyme aldose reductase, which converts glucose to sorbitol, and then by sorbitol dehydrogenase, which converts sorbitol to free fructose. The polyol pathway is an important source of endogenous fructose in the fetal circulation (46). Hyperglycemia and intracellular glucose significantly increase fructose concentrations and the expression of aldose reductase in the liver and kidney (27). Expression of aldose reductase is also significant in adipose and nervous tissues as well as in skeletal and smooth muscles.
Fructosemia and Glycemia
The observations that a high-fructose intake can lead to hyperglycemia and hyperinsulinemia in normal humans (28) but cannot affect blood glucose levels in humans with essential fructosuria (18) can now be explained by our findings on KHK-dependent, fructose-induced hyperglycemia. The KHK-dependent hyperglycemia may be due in part to excess fructose consumption inducing gluconeogenesis but not glycogenesis (30, 36). Our previous work found intestinal gluconeogenic enzymes to increase markedly in expression in fructose-fed mice and rats (9, 38).
Fructose-Mediated Glycation
Although C57BL6 as an inbred strain is hyperglycemic relative to humans [previously determined fasting glucose concentrations in C57BL6 (10 mM, see Ref. 2) are similar to our results], in this study, the hyperglycemic wild-type mice are not diabetic since HbA1c are <5%. Fructose and its specific metabolic intermediate glyceraldehyde are chemically ∼10-fold more reactive than glucose when forming advanced glycation products (40). However, because blood fructose is normally 10- to 1,000-fold less than glucose concentrations in wild-type mice, the cumulative glycating effect of blood glucose is still expected to be greater than that of fructose in vivo. Thus, the high HbA1c levels in fructose-fed wild-type mice likely reflect fructose-induced, KHK-dependent hyperglycemia because HbA1c was lower and independent of dietary fructose in KHK−/− mice exhibiting marked hyperfructosemia. The half-life of mouse erythrocytes is ∼10 days (33); thus, the influence of dietary fructose on HbA1c levels in that 12-wk chronic fructose feeding study is likely reflective of the chronic hyperglycemia.
Relevance and Future Work
Small (∼0.04 mM) increases in systemic fructose concentrations resulting from ingesting modest amounts of dietary fructose significantly enhances, in a KHK-dependent manner, blood glucose levels. KHK clearly is essential in maintaining low systemic fructose concentrations and in moderating fructose-induced hyperglycemia that increases HbA1c levels. These small changes in blood fructose concentration may be beyond the resolution of many enzyme-based kits. Dramatic KHK-dependent differences in portal and systemic fructose concentrations suggest important contributions of fructose metabolism by peripheral organs. The polyol pathway implicated in damage to nerve, renal, and retinal microvasculature (27, 39) seems KHK, GLUT5, and dietary fructose independent. These findings are highly relevant because they reveal the mechanisms underlying the hyperfructosemia of human hereditary fructosuria and the hyperglycemia in fructose-induced metabolic syndrome.
Targeted deletion of important transporters and enzymes of fructose metabolism, gluconeogenesis, and the polyol pathway from strategic organ systems should markedly increase our understanding of fructose homeostasis. Specifically, ablation of KHK or the hepatic fructose transporter GLUT2 from the liver should provide important information regarding the roles of the liver in modulating systemic fructose levels, in fructose-induced hyperglycemia, and in nonalcoholic hepatic steatosis. Ablation of KHK from adipocytes and/or skeletal muscle should also markedly enhance our understanding not only of their role(s) in regulating blood fructose levels but, more importantly, also of their contribution(s) to fructose-induced metabolic syndrome, since visceral adiposity is prevented in fructose-fed, global KHK−/− mice (34).
Because high-fructose intake can result in hyperglycemia without hyperfructosemia, GCMS and HPLC methods are highly recommended for more accurate analysis of low blood fructose levels prevailing in wild-type mice and in humans (44) because these methods, although laborious, can readily separate fructose from large amounts of sugars and sugar metabolites in the blood. Moreover, it is imperative that highly sensitive methods be used to assay for fructose in mammals that are fasting or consuming fructose-free diets, since these have serum fructose concentrations <100 μM (38).
GRANTS
This work was supported by National Science Foundation Grants IOS-1121049 and -1456673. R. P. Ferraris also received support from National Institute of Diabetes and Digestive and Kidney Diseases Grant R01-DK-102934.
DISCLOSURES
Dr. K. Sugimoto is employed by while Prof. H. Inui received funding from the Nagaoka Perfumery Co., Ltd., Japan.
AUTHOR CONTRIBUTIONS
C.R.P., V.D., and R.P.F. conception and design of research; C.R.P., K.S., A.S., and R.P.F. performed experiments; C.R.P., K.S., V.D., A.S., H.I., T.Y., and R.P.F. analyzed data; C.R.P., K.S., V.D., H.I., T.Y., and R.P.F. interpreted results of experiments; C.R.P., K.S., H.I., T.Y., and R.P.F. edited and revised manuscript; C.R.P., K.S., V.D., A.S., H.I., T.Y., and R.P.F. approved final version of manuscript; R.P.F. prepared figures; R.P.F. drafted manuscript.
ACKNOWLEDGMENTS
We thank Drs. Elmer David, Iona Monteiro, and Phuntila Tharabenjasin and Kazuhiro Ishii, Kana Kogou, Snehal Parikh, Atit Raval, Dylan Simon, and Megana Murugesh for help with experiments. We also thank Prof. Malcolm Watford for valuable discussion, and to Profs. Richard Johnson and Jian Zuo for sharing the KHK−/− and GLUT5−/− mice, respectively.
Present address for V. Douard: Food and Microbiota Research, UMR1913-MICALIS, INRA, Domaine de Vilvert, Jouy-en-Josas, France.
REFERENCES
- 1.Barone S, Fussell SL, Singh AK, Lucas F, Xu J, Kim C, Wu X, Yu Y, Amlal H, Seidler U, Zuo J, Soleimani M. Slc2a5 (Glut5) is essential for the absorption of fructose in the intestine and generation of fructose-induced hypertension. J Biol Chem 284: 5056–5066, 2009. [DOI] [PMC free article] [PubMed] [Google Scholar]
- 2.Berglund ED, Li CY, Poffenberger G, Ayala JE, Fueger PT, Willis SE, Jewell MM, Powers AC, Wasserman DH. Glucose metabolism in vivo in four commonly used inbred mouse strains. Diabetes 57: 1790–1799, 2008. [DOI] [PMC free article] [PubMed] [Google Scholar]
- 3.Blakely SR, Hallfrisch J, Reiser S, Prather ES. Long-term effects of moderate fructose feeding on glucose tolerance parameters in rats. J Nutr 111: 307–314, 1981. [DOI] [PubMed] [Google Scholar]
- 4.Bontemps F, Hue L, Hers HG. Phosphorylation of glucose in isolated rat hepatocytes. Sigmoidal kinetics explained by the activity of glucokinase alone. Biochem J 174: 603–611, 1978. [DOI] [PMC free article] [PubMed] [Google Scholar]
- 5.Bonthron DT, Brady N, Donaldson IA, Steinmann B. Molecular basis of essential fructosuria: molecular cloning and mutational analysis of human ketohexokinase (fructokinase). Hum Mol Genet 3: 1627–1631, 1994. [DOI] [PubMed] [Google Scholar]
- 6.Bray GA. Potential health risks from beverages containing fructose found in sugar or high-fructose corn syrup. Diabetes Care 36: 11–12, 2013. [DOI] [PMC free article] [PubMed] [Google Scholar]
- 7.Cassman KG. Ecological intensification of cereal production systems: yield potential, soil quality, and precision agriculture. Proc Natl Acad Sci USA 96: 5952–5959, 1999. [DOI] [PMC free article] [PubMed] [Google Scholar]
- 8.Cozma AI, Sievenpiper JL, de Souza RJ, Chiavaroli L, Ha V, Wang DD, Mirrahimi A, Yu ME, Carleton AJ, Di Buono M, Jenkins AL, Leiter LA, Wolever TM, Beyene J, Kendall CW, Jenkins DJ. Effect of fructose on glycemic control in diabetes: a systematic review and meta-analysis of controlled feeding trials. Diabetes Care 35: 1611–1620, 2012. [DOI] [PMC free article] [PubMed] [Google Scholar]
- 9.Cui XL, Soteropoulos P, Tolias P, Ferraris RP. Fructose-responsive genes in the small intestine of neonatal rats. Physiol Genomics 18: 206–217, 2004. [DOI] [PubMed] [Google Scholar]
- 10.Diggle CP, Shires M, Leitch D, Brooke D, Carr IM, Markham AF, Hayward BE, Asipu A, Bonthron DT. Ketohexokinase: expression and localization of the principal fructose-metabolizing enzyme. J Histochem Cytochem 57: 763–774, 2009. [DOI] [PMC free article] [PubMed] [Google Scholar]
- 11.Douard V, Asgerally A, Sabbagh Y, Sugiura S, Shapses SA, Casirola D, Ferraris RP. Dietary fructose inhibits intestinal calcium absorption and induces vitamin D insufficiency in CKD. J Am Soc Nephrol 21: 261–271, 2010. [DOI] [PMC free article] [PubMed] [Google Scholar]
- 12.Douard V, Ferraris RP. The role of fructose transporters in diseases linked to excessive fructose intake. J Physiol 591: 401–414, 2013. [DOI] [PMC free article] [PubMed] [Google Scholar]
- 13.Douard V, Patel C, Lee J, Tharabenjasin P, Williams E, Fritton JC, Sabbagh Y, Ferraris RP. Chronic high fructose intake reduces serum 1,25 (OH)2D3 levels in calcium-sufficient rodents. PLoS One 9: e93611, 2014. [DOI] [PMC free article] [PubMed] [Google Scholar]
- 14.Du L, Heaney AP. Regulation of adipose differentiation by fructose and GluT5. Mol Endocrinol 26: 1773–1782, 2012. [DOI] [PMC free article] [PubMed] [Google Scholar]
- 15.Ferraris RP, Yasharpour S, Lloyd KC, Mirzayan R, Diamond JM. Luminal glucose concentrations in the gut under normal conditions. Am J Physiol Gastrointest Liver Physiol 259: G822–G837, 1990. [DOI] [PubMed] [Google Scholar]
- 16.Fontana L, Eagon JC, Trujillo ME, Scherer PE, Klein S. Visceral fat adipokine secretion is associated with systemic inflammation in obese humans. Diabetes 56: 1010–1013, 2007. [DOI] [PubMed] [Google Scholar]
- 17.Froesch ER, Ginsberg JL. Fructose metabolism of adipose tissue. I. Comparison of fructose and glucose metabolism in epididymal adipose tissue of normal rats. J Biol Chem 237: 3317–3324, 1962. [PubMed] [Google Scholar]
- 18.Gitzelmann R, Steinmann B, Van den Bergh G. Disorders of fructose metabolism. In: The Metabolic Basis of Inherited Disease (6th ed), edited by Stanbury JB, Wyngaarden JB, and Fredrickson DS. New York, NY: McGraw-Hill, 1989, p. 399–424. [Google Scholar]
- 19.Horwitz DL, Starr JI, Mako ME, Blackard WG, Rubenstein AH. Proinsulin, insulin, and C-peptide concentrations in human portal and peripheral blood. J Clin Invest 55: 1278–1283, 1975. [DOI] [PMC free article] [PubMed] [Google Scholar]
- 20.Ishimoto T, Lanaspa MA, Le MT, Garcia GE, Diggle CP, Maclean PS, Jackman MR, Asipu A, Roncal-Jimenez CA, Kosugi T, Rivard CJ, Maruyama S, Rodriguez-Iturbe B, Sanchez-Lozada LG, Bonthron DT, Sautin YY, Johnson RJ. Opposing effects of fructokinase C and A isoforms on fructose-induced metabolic syndrome in mice. Proc Natl Acad Sci USA 109: 4320–4325, 2012. [DOI] [PMC free article] [PubMed] [Google Scholar]
- 21.Jiang L, Ferraris RP. Developmental reprogramming of rat GLUT5 requires de novo mRNA and protein synthesis. Am J Physiol Gastrointest Liver Physiol 280: G113–G120, 2001. [DOI] [PubMed] [Google Scholar]
- 22.Johnson RJ, Perez-Pozo SE, Sautin YY, Manitius J, Sanchez-Lozada LG, Feig DI, Shafiu M, Segal M, Glassock RJ, Shimada M, Roncal C, Nakagawa T. Hypothesis: could excessive fructose intake and uric acid cause type 2 diabetes? Endocr Rev 30: 96–116, 2009. [DOI] [PMC free article] [PubMed] [Google Scholar]
- 23.Kawasaki T, Igarashi K, Ogata N, Oka Y, Ichiyanagi K, Yamanouchi T. Markedly increased serum and urinary fructose concentrations in diabetic patients with ketoacidosis or ketosis. Acta Diabetol 49: 119–123, 2012. [DOI] [PubMed] [Google Scholar]
- 24.Kawasaki T, Ogata N, Akanuma H, Sakai T, Watanabe H, Ichiyanagi K, Yamanouchi T. Postprandial plasma fructose level is associated with retinopathy in patients with type 2 diabetes. Metabolism 53: 583–588, 2004. [DOI] [PubMed] [Google Scholar]
- 25.Krauss RM, Blanche PJ, Rawlings RS, Fernstrom HS, Williams PT. Separate effects of reduced carbohydrate intake and weight loss on atherogenic dyslipidemia. Am J Clin Nutr 83: 1025–1031, 2006. [DOI] [PubMed] [Google Scholar]
- 26.Kristiansen S, Darakhshan F, Richter EA, Hundal HS. Fructose transport and GLUT-5 protein in human sarcolemmal vesicles. Am J Physiol Endocrinol Metab 273: E543–E548, 1997. [DOI] [PubMed] [Google Scholar]
- 27.Lanaspa MA, Ishimoto T, Cicerchi C, Tamura Y, Roncal-Jimenez CA, Chen W, Tanabe K, Andres-Hernando A, Orlicky DJ, Finol E, Inaba S, Li N, Rivard CJ, Kosugi T, Sanchez-Lozada LG, Petrash JM, Sautin YY, Ejaz AA, Kitagawa W, Garcia GE, Bonthron DT, Asipu A, Diggle CP, Rodriguez-Iturbe B, Nakagawa T, Johnson RJ. Endogenous fructose production and fructokinase activation mediate renal injury in diabetic nephropathy. J Am Soc Nephrol 25: 2526–2538, 2014. [DOI] [PMC free article] [PubMed] [Google Scholar]
- 28.Lanaspa MA, Ishimoto T, Li N, Cicerchi C, Orlicky DJ, Ruzycki P, Rivard C, Inaba S, Roncal-Jimenez CA, Bales ES, Diggle CP, Asipu A, Petrash JM, Kosugi T, Maruyama S, Sanchez-Lozada LG, McManaman JL, Bonthron DT, Sautin YY, Johnson RJ. Endogenous fructose production and metabolism in the liver contributes to the development of metabolic syndrome. Nat Commun 4: 2434, 2013. [DOI] [PMC free article] [PubMed] [Google Scholar]
- 29.Laron Z. Essential benign fructosuria. Arch Dis Child 36: 273–277, 1961. [DOI] [PMC free article] [PubMed] [Google Scholar]
- 30.Laughlin MR. Normal roles for dietary fructose in carbohydrate metabolism. Nutrients 6: 3117–3129, 2014. [DOI] [PMC free article] [PubMed] [Google Scholar]
- 31.Litherland GJ, Hajduch E, Gould GW, Hundal HS. Fructose transport and metabolism in adipose tissue of Zucker rats: diminished GLUT5 activity during obesity and insulin resistance. Mol Cell Biochem 261: 23–33, 2004. [DOI] [PubMed] [Google Scholar]
- 32.Lustig RH. Fructose: it's “alcohol without the buzz.” Advan Nutr 4: 226–235, 2013. [DOI] [PMC free article] [PubMed] [Google Scholar]
- 33.Magnani M, Rossi L, Stocchi V, Cucchiarini L, Piacentini G, Fornaini G. Effect of age on some properties of mice erythrocytes. Mech Ageing Dev 42: 37–47, 1988. [DOI] [PubMed] [Google Scholar]
- 34.Marek G, Pannu V, Shanmugham P, Pancione B, Mascia D, Crosson S, Ishimoto T, Sautin YY. Adiponectin resistance and proinflammatory changes in the visceral adipose tissue induced by fructose consumption via ketohexokinase-dependent pathway. Diabetes 64: 508–518, 2015. [DOI] [PubMed] [Google Scholar]
- 35.Marriott BP, Cole N, Lee E. National estimates of dietary fructose intake increased from 1977 to 2004 in the United States. J Nutr 139: 1228S–1235S, 2009. [DOI] [PubMed] [Google Scholar]
- 36.Mayes PA. Intermediary metabolism of fructose. Am J Clin Nutr 58: 754S–765S, 1993. [DOI] [PubMed] [Google Scholar]
- 37.Patel C, Douard V, Gao N, Yu S, Ferraris R. Regulation of the primary intestinal fructose transporter GLUT5 is dependent on metabolism by FK and on trafficking by Rab11a-dependent endosomes. FASEB J 29, 2015. [DOI] [PMC free article] [PubMed] [Google Scholar]
- 38.Patel CR, Douard V, Yu S, Tharabenjasin P, Gao N, Ferraris RP. Fructose-induced increases in expression of intestinal fructolytic and gluconeogenic genes are regulated by GLUT5 and KHK. Am J Physiol Regul Integr Comp Physiol 309: R499–R509, 2015. [DOI] [PMC free article] [PubMed] [Google Scholar]
- 39.Ramasamy R, Goldberg IJ. Aldose reductase and cardiovascular diseases, creating human-like diabetic complications in an experimental model. Circ Res 106: 1449–1458, 2010. [DOI] [PMC free article] [PubMed] [Google Scholar]
- 40.Schalkwijk CG, Stehouwer CD, van Hinsbergh VW. Fructose-mediated non-enzymatic glycation: sweet coupling or bad modification. Diabetes/Metab Res Rev 20: 369–382, 2004. [DOI] [PubMed] [Google Scholar]
- 41.Shapiro A, Mu W, Roncal C, Cheng KY, Johnson RJ, Scarpace PJ. Fructose-induced leptin resistance exacerbates weight gain in response to subsequent high-fat feeding. Am J Physiol Regul Integr Comp Physiol 295: R1370–R1375, 2008. [DOI] [PMC free article] [PubMed] [Google Scholar]
- 42.Stanhope KL, Schwarz JM, Keim NL, Griffen SC, Bremer AA, Graham JL, Hatcher B, Cox CL, Dyachenko A, Zhang W, McGahan JP, Seibert A, Krauss RM, Chiu S, Schaefer EJ, Ai M, Otokozawa S, Nakajima K, Nakano T, Beysen C, Hellerstein MK, Berglund L, Havel PJ. Consuming fructose-sweetened, not glucose-sweetened, beverages increases visceral adiposity and lipids and decreases insulin sensitivity in overweight/obese humans. J Clin Invest 119: 1322–1334, 2009. [DOI] [PMC free article] [PubMed] [Google Scholar]
- 43.Sugimoto K, Hosotani T, Kawasaki T, Nakagawa K, Hayashi S, Nakano Y, Inui H, Yamanouchi T. Eucalyptus leaf extract suppresses the postprandial elevation of portal, cardiac and peripheral fructose concentrations after sucrose ingestion in rats. J Clin Biochem Nutr 46: 205–211, 2010. [DOI] [PMC free article] [PubMed] [Google Scholar]
- 44.Sugimoto K, Inui H, Yamanouchi T. Assays of fructose in experimental nutrition. In: Dietary Sugars: Chemistry, Analysis, Function and Effects, edited by Preedy VR. Cambridge, UK: Royal Society of Chemistry, 2012, p. 466–485. [Google Scholar]
- 45.Tharabenjasin P, Douard V, Patel C, Krishnamra N, Johnson RJ, Zuo J, Ferraris RP. Acute interactions between intestinal sugar and calcium transport in vitro. Am J Physiol Gastrointest Liver Physiol 306: G1–G12, 2014. [DOI] [PubMed] [Google Scholar]
- 46.Trindade CE, Barreiros RC, Kurokawa C, Bossolan G. Fructose in fetal cord blood and its relationship with maternal and 48-hour-newborn blood concentrations. Early Human Dev 87: 193–197, 2011. [DOI] [PubMed] [Google Scholar]
- 47.Wu X, Wang X, Gao J, Yu Y, Jia S, Zheng J, Dallos P, He DZ, Cheatham M, Zuo J. Glucose transporter 5 is undetectable in outer hair cells and does not contribute to cochlear amplification. Brain Res 1210: 20–28, 2008. [DOI] [PMC free article] [PubMed] [Google Scholar]