Abstract
A flow sensor has been fabricated and tested that is capable of measuring the slow flow characteristic of the cerebrospinal fluid in the range from less than 4 mL/h to above 100 mL/h. This sensor is suitable for long-term implantation because it uses a wireless external spectrometer to measure passive subcutaneous components. The sensors are pressure-sensitive capacitors, in the range of 5 pF with an air gap at atmospheric pressure. Each capacitor is in series with an inductor to provide a resonant frequency that varies with flow rate. At constant flow, the system is steady with drift <0.3 mL/h over a month. At variable flow rate, V̇, the resonant frequency, f0, which is in the 200–400 MHz range, follows a second order polynomial with respect to V̇. For this sensor system the uncertainty in measuring f0 is 30 kHz which corresponds to a sensitivity in measuring flow of ΔV̇= 0.6 mL/hr. Pressures up to 20 cm H2O relative to ambient pressure were also measured. An implantable twin capacitor system is proposed that can measure flow, which is fully compensated for all hydrostatic pressures. For twin capacitors, other sources of systematic variation within clinical range, such as temperature and ambient pressure, are smaller than our sensitivity and we delineate a calibration method that should maintain clinically useful accuracy over long times.
Keywords: Flow sensor, Pressure sensor, Intracranial pressure, Cerebrospinal flow, Shunt, Hydrocephalus
1. Introduction
A common, useful treatment for patients with head trauma and hydrocephalus is the placement of a shunt to drain excess cerebrospinal fluid (CSF) and reduce the intracranial pressure (ICP), thereby reducing brain damage [1–3]. Many commercially available shunt systems use a valve to regulate the flow. These valves are controlled by changes in pressure, but generally do not provide the ICP to the caregiver. There are variations in performance reported amongst the commercially available shunts with pressure control systems [4]. It might seem that the ICP is the most important parameter since the ICP is directly related to cell damage. Incorporation of a pressure sensor into the shunt apparatus would be valuable as a monitor of the operation of the shunt and the health of the patient if the pressure sensor reading can be related to ICP. However, there are situations where there is an occlusion upstream from where a pressure sensor can be located along the shunt, which could lead to a false reading of CSF pressure that is not related to ICP and a possible danger to the patient. A method to measure flow and pressure of CSF along its path within the shunt would provide an unambiguous way to monitor ICP, the performance of the shunt, and possibly predict shunt failure before the patient's ICP has been compromised. It would also be an important step towards realization of a “smart shunt” [5].
Measurement of flow and pressure are needed because approximately 50–70% of patients report shunt malfunction within 1 year after initial shunt placement and then at a rate of 5% per year [6]. Among the malfunctions reported for shunts, blockage is the most common. Important studies indicate that the deployment of shunts has overall been successful, but shunt failures due to mechanical malfunction and blockage are more common than experts desire [1,2,7–10]. Table 1 lists the requirements of a pressure/flow-rate sensor to be useful as a monitor of shunt effectiveness while providing an indication of ICP.
Table 1.
Pressure sensor and flow sensor measurement requirements.
| Parameter | |
|---|---|
| Pressure | 0-50 ± 0.1 cm H2O (0-500 ± 1 Pa) |
| Flow Rate | 0-100 ± 4 mL/h |
We report the development of a wireless sensor that could potentially be used to enhance the functionality of ventriculoperitoneal shunts. It measures both pressure and flow to monitor ICP and provide early warning of a shunt failure. The system employs a pair of capacitors made using micro-electro-mechanical systems (MEMS) technology with flexible membranes used as fluid pressure sensors that are inline with the flow. The flow rate through a path with known flow resistance is calculated from the difference in pressure. Wiring inductors to the capacitive sensors forms resonant circuits. The device is designed for subcutaneous implantation as part of a smart shunt system. They provide the CSF flow rate and pressure. Tests here indicate that the device is sensitive enough to allow the detection of the approach to shunt occlusion and to monitor the efficacy of treatments. This type of device may allow the physician to check for failure of CSF flow without surgery and make an informed and quick decision about further diagnosis and treatment.
1.1. Physiological fluid flow sensors
In a healthy individual, the volume of cerebrospinal fluid (CSF) is approximately 140 mL. This volume of fluid is continuously absorbed by the body. It is formed at a rate of 0.35 mL/min [11]. This results in a flow rate of approximately 21 mL/h in a healthy individual. For comparison, blood flows through a person's aorta at about 576,000 mL/h [12]. In order to measure the extremely slow flow rate of CSF, a highly sensitive device must be designed.
Although derived from blood, CSF has a different composition. The differences are listed in Table 2. As can be seen, CSF is mostly water with smaller ions contained in it. Unlike blood, this makes it a very clear. Blood also contains coagulating agents, which CSF lacks. This makes it slightly easier to measure since there is no danger of CSF forming a clot that would inhibit its proper flow.
Table 2.
Comparison of composition of CSF and blood serum [11].
| Component | CSF | Serum |
|---|---|---|
| Water content (%) | 99 | 93 |
| Protein (mg/dL) | 35 | 7000 |
| Glucose (mg/dL) | 60 | 90 |
| Na+ (mEq/L) | 138 | 138 |
| K+ (mEq/L) | 2.8 | 4.5 |
| Ca2+ (mEq/L) | 2.1 | 4.8 |
| Mg2+ (mEq/L) | 0.3 | 1.7 |
| Cl- (mEq/L) | 119 | 102 |
| pH | 7.33 | 7.41 |
There are various flow sensor technologies that have been applied to physiological fluids. Blood flow has been measured for intraoperative and laboratory use using various methods. Transit time, electromagnetic and Doppler methods have been used including implantable systems [13]. CSF poses challenges in extending their applicability to meet the requirements listed in Table 1 while incorporating the flow measurement into an existing transpalpe bral shunt system. Two methods that have been used previously are transit-time and calorimetric flow sensors [14,15].
The transit-time method uses a pair of ultrasonic transducers to launch and record an ultrasonic wave along the path of the flowing fluid [13]. The transit-time of the wave to the recorder is a function of the fluid velocity and can be determined by the phase difference between the launched and recorded waves. Drost et al. [14] have adapted this technique to a wireless CSF flow sensor that can be incorporated into a shunt system. In tests with sheep it was able to measure flow rates in the range of 0–130 mL/h. The major error in the measurement method was in the positioning of the external reader, which was inductively coupled to the sensor. However, this error was reduced to ~1 mL/h by correcting for the amplitude variation in the signal. The signal could be detected within 9 mm of the sensor, which makes it suitable for subcutaneous implantation near the shunt valve mechanism.
The calorimetric method for measuring blood flow was first suggested by Rein in 1928 [16]. The principle is to apply heat locally to a flowing fluid and measure the temperature downstream [17]. The rate of cooling of the fluid is a function of the flow rate. Bork et al. [15] have adapted this method to CSF flow for use in a shunt system. They were able to obtain an accuracy of ±10% in the range of 2–40 mL/h for artificial CSF in vitro. This system uses a telemetry recording system with an inductively coupled reader that is relatively insensitive to positioning once the reader is in close enough proximity.
Both the transit-time and calorimetric flow sensors may be adapted to shunt systems but will not provide a measure of ICP, which would be a direct indication of the condition of the patient as a function of the CSF flow parameters. A solution might be to use a separate ICP monitor along with the flow sensor. However, a less complicated solution would be to incorporate the ICP measurement with the flow sensor. The flow sensor that we propose uses two pressure sensors to derive the CSF flow rate. The absolute pressure measurement from these sensors is related to ICP while the difference in pressure between the two sensors is related to the flow rate. There is a clear advantage to deriving CSF flow rate in the shunt and ICP from a single implantable device with only one reader. The challenge was to design a compact pressure sensor that could be designed and fabricated to work in the range needed for CSF pressure measurements. A MEMS based capacitive pressure sensor provides a solution that meets the requirements
1.2. Capacitive pressure sensors
Capacitive pressure sensors have been in use for decades. For instance, Akar et al. [18] fabricated a pressure sensor consisting of a 6 μm-thin silicon diaphragm and a metal electrode supported on a glass substrate. The capacitor was wired to a gold-electroplated planar inductor coil on the same substrate, which facilitated external detection of the capacitance using mutual induction. Chang et al. [19] performed tests on three types of capacitive pressure sensors. The group successfully fabricated these sensors by using lamination processing with Kapton polyimide, stainless steel, and titanium films as diaphragms on a stainless steel shim stock substrate. They demonstrated the integration of readout circuitry on the substrate. Recently scientists developed a useful and effective, miniaturized, flexible capacitive pressure sensor with polydimethylsiloxane (PDMS) as the dielectric for plantar pressure measurement in biomechanical systems [20]. The good scale and flexibility of the sensor allows this configuration to be adapted as shoe-integrated sensor system for long-distance data collection for gait analysis.
Miniaturization using MEMS technology has opened up new biomedical applications of capacitive sensors. For instance, Ha et al. [21] developed a prototype flexible MEMS capacitive pressure sensor with a sensing area of 500 × 500 μm2 for implantation in the mouse eye to measure intraocular pressure (IOP). Liquid crystal polymer (LCP) was used as the material for the flexible substrate. A thin deposition of parylene was utilized to create low profile flexible membranes. A multilayer consisting of 25 μm thick LCP for a host substrate and 50 μm thick kapton tapes for backside filling. This device was able to measure in the range of 0–50 cm H2O and provided resolution of ±1.7 cm H2O which is suitable for IOP and ICP monitoring. The achievements in this work demonstrate the feasibility of the miniature implantable pressure sensors. The MEMS capacitive pressure sensor that we describe here uses materials that are compatible with traditional CMOS processing and is compatible with integration into the shunt system.
2. Theory of sensor operation
We focus on the pressure drop due to viscous drag along the walls of a tube when fluid flows through, which is governed by Poiseuille's law [22]. The flow rate of the fluid produces a dynamic contribution to the pressure drop. The difference in pressure, ΔP, between two points in the flow is proportional to the volumetric flow rate, V̇[23]:
| (1) |
where Rhyd is the hydraulic flow resistance, which depends on the geometry of the channel between the two points where the pressure is measured and the viscosity, μ, of the fluid. For a circular cross-section channel with diameter, D, and length, l, it is [24]:
| (2) |
The pressure sensor that we employ is a parallel plate capacitor with a fixed upper plate and a flexible lower plate designed to be in contact with the fluid. The pressure of the fluid pushes against the lower plate and the deflection produces a change in the distance between the capacitor plates, thus resulting in a change in capacitance. The capacitance change is directly proportional to the fluid pressure. The capacitor is connected to an inductor, which is inductively coupled to a spectrometer that allows for wireless detection of the flow or pressure.
For a square membrane with a half-width, a, the pressure changes the capacitor gap, w0, at the center. The area is 4a2. The pressure has the following general form:
| (3) |
where (for a square membrane with fixed supports on all sides) C0 = 793 [25], C1 = 3.393, C2 = 8/6(1 + ν) [26], σ0 is the initial stress of the membrane, t is the thickness of the membrane, E is the Young's modulus and ν is Poisson's ratio. The first term in Eq. (3), P0, is due to bending of the membrane and is valid for small deflections, which is the case for the devices reported here with w0 < t << a. P1 results from the initial stress on the membrane and P2 is due to stretching. For the SiNx membrane that was fabricated for this study the Young's modulus E is 220 MPa, is 0.28 and σ0 is from 100 MPa to 400 MPa. For membrane stresses in SiNx that are in this range P1 dominates the pressure. That is, the center deflection is a linear function of the pressure, and is mostly controlled by the initial stress. The sensor is more sensitive when the initial membrane stress is smaller, but must be optimized along with the area, membrane thickness, and capacitor plate spacing to minimize the chance that the plates touch at the maximum design pressure.
The capacitance is calculated by first modeling the shape of the membrane under pressure either by using an analytical formula or finite element analysis. For a square membrane w is replaced by w( x, y) with − a ≤ x ≤ a and −a ≤ y ≤ a. An analytical model was used to for this study [27]:
| (4) |
where w0 = w(0,0) is the deflection at the center of the membrane and includes contributions from the pressure that produces the flow minus the pressure drop from viscous drag (e.g., Eq. (1)). w0 is governed by Eq. (3). The capacitance is then calculated numerically.
| (5) |
where d is the capacitor plate spacing in the absence of pressure. The resonant frequency of a closed loop circuit with the sensor in series with an inductance, L, is then:
| (6) |
In practice, when the capacitor is used to measure flow, w0, is generally comprised of a static pressure component from the fluid that deflects the flexible membrane inward and a component from the flow governed by Eq. (1) that counteracts the static pressure. If the sensor is in the fluid path of a ventriculoperitoneal shunt, the static pressure at the inlet of the shunt is proportional to the difference is pressure between the ventricle and the peritoneal cavity that controls the rate of flow through the shunt. There is also a component of hydrostatic pressure that depends on the path of the fluid, any devices in the path of the fluid (e.g., valves), and the orientation of the shunt with respect to gravity. A single capacitive pressure sensor detects the combined effect of CSF pressure, hydrostatic pressure and flow. The flow component is most conveniently separated by comparing the measurements from two capacitive sensors in the fluid path of the shunt and using Eq. (1).
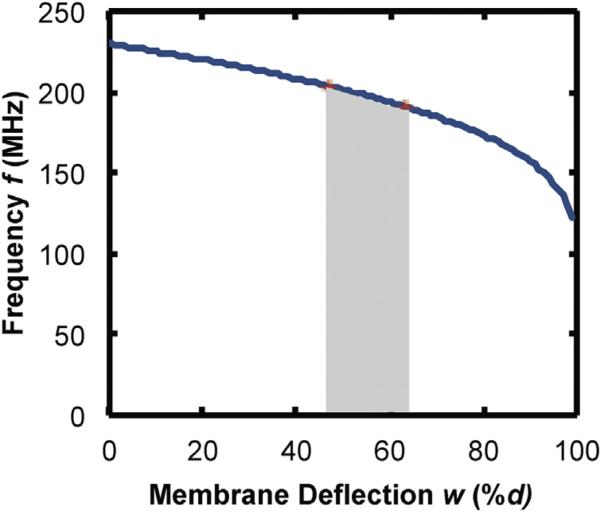
There is no analytical solution for the flow rate as a function of frequency for the case of a square membrane, but by inspection of Eqs. (1), (3), (5), and (6), a non-linear relationship is expected. However, a calibration can be easily recorded. For membrane deflections that are small compared to the gap between the capacitor plates, the theory predicts that the frequency is almost a linear function of the flow rate. For larger deflections the frequency is a non-linear function. The design of the capacitor then dictates the response. As an example, plotted in Fig. 1 is the frequency as a function of membrane deflection for a capacitor with the dimensions used for this study ( a = 260 μm and d = 0.5 μm) with L = 0.08 μH. Highlighted in Fig. 1 is the approximate range of membrane deflections that would be expected for a sensor that is 20 cm from the inlet of the shunt with D = 0.8 mm, t = 0.5 μm and σ0 = 250 MPa and an inlet pressure of 1960 Pa (47% < w0 < 63% of d). The frequency is almost linear within this relatively small range of deflection/pressure. For a clinical implementation, the outlet of the shunt would be in the peritoneal cavity and the pressure needed to generate flow under those conditions would have to be taken into account. We have used a reference pressure (atmospheric) in testing, but we describe the twin capacitor case as the preferable method for an implanted system.
Fig. 1.
Calculated frequency vs. membrane deflection (plotted as percent of the gap between capacitor plates) for parameters used in experiments. The shaded area represents the calculated range of deflection for 1 < V̇ < 100 mL/h.
3. Materials and methods
3.1. Capacitive sensor fabrication
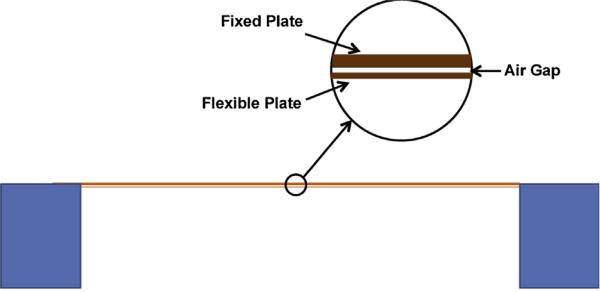
The pressure-sensitive capacitors were fabricated using MEMS technology. The core of the sensor is the capacitor with a flexible membrane. A diagram of it is shown, approximately to scale in Fig. 2. The capacitor is square with a width, 2 a, on a side of 520 μm. The spacing, d, between plates is 0.5 μm, the upper thick plate thickness is 1.06 μm and the flexible membrane thickness is 0.55 μm, with uncertainties in all values of <10%. In order to make the capacitor more sensitive, we fabricated ones with large edge width to gap ratio 2 a/ d ~ 1000. The combination of all physical parameters of the MEMS capacitor was optimized to realize a sensor that can work in the range specified in Table 1. This was a challenge because of the small flow rates and the need to minimize the hydrostatic pressure between the two pressure sensors. However, one of the most critical components was to achieve this with an overall size that is small enough such that after packaging it can be implanted in the path of CSF as part of a shunt.
Fig. 2.
Schematic cross section of the capacitive pressure sensor shown approximately to scale. The air gap is vented to atmospheric pressure.
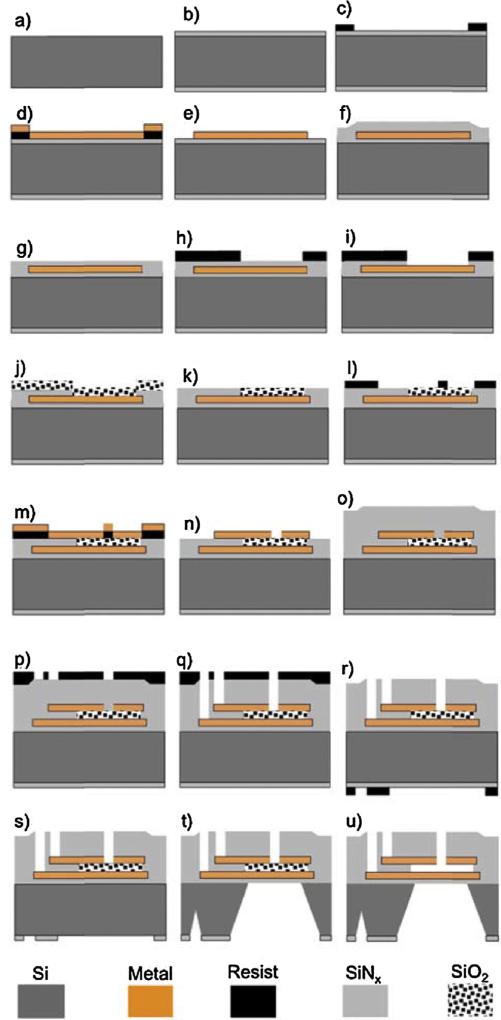
The sensors were fabricated from 100 mm silicon wafers with a thickness of 400 μm using the process summarized in Fig. 3. 500 nm of low stress silicon nitride (SiNx) was deposited using low-pressure chemical vapor deposition (LPCVD) on both sides of the wafer (Fig. 3b). The bottom electrode (a bi-layer consisting of 10 nm of Cr and 40 nm of Ni) was defined by photolithography and deposited using e-beam evaporation (Fig. 3c–e). Next, 500 nm of low stress SiNx was deposited on top using plasma enhanced chemical vapor deposition (PECVD) (Fig. 3f). Chemical mechanical polishing (CMP) was used to planarize the nitride surface such that 500 nm of nitride is left on top of the metal (Fig. 3g). Using reactive ion etching (RIE), windows for the capacitor gaps were opened (Fig. 3h and i), followed by deposition of 750 nm of SiO2 using PECVD (Fig. 3j). Next CMP was used to polish the SiO2 layer down to a thickness of 500 nm on top of the metal electrode (Fig. 3k), defining the capacitor gap. Next, photolithography and e-beam evaporation of Cr (~10 nm), and Ni (~40 nm) and Cr (~10 nm) were used to define the top electrode (Fig. 3l–n). The top electrode was patterned such that 5 micron width slots were opened to the SiO2 layer, which will be later used for the sacrificial etch. 1 μm of low stress SiNx was deposited using PECVD to protect the devices (Fig. 3o). Windows in the SiNx for both the contacts and the sacrificial etch were opened using photolithography and RIE (Fig. 3p and q). Next, photolithography using backside alignment and RIE was used to open windows in the nitride on the back side of the wafer (Fig. 3r and s). This patterned nitride layer is a hard mask for the through wafer etch. The silicon was anisotropically etched through the wafer using KOH (Fig. 3t). A thin layer of ProTEK (from Brewer Science, Inc.,) was spun on the front side of the wafer and the wafer was mounted in a custom built holder to protect it during the KOH etch. The sacrificial layer, SiO2, was etched by dipping the wafer in hydrofluoric acid (HF) acid (Fig. 3u). Finally, the wafer was diced and the final device dimensions were 10 mm × 5 mm × 0.4 mm. With these conditions, the capacitance, C = 4ε0a2/d, at the pressure P = 0 is 4.8 pF.
Fig. 3.
Schematic of process flow for fabrication of capacitive pressure sensor on silicon substrate. See text for details.
3.2. Incorporation of inductor coil and chip carrier with the chip
The chip carrier is a rectangular piece of biocompatible material (medical grade PMMA), which serves as a platform that can accommodate the variable capacitor chip. It is a rectangular block of 1.3 × 0.9 × 0.2 cm with a fluid channel of 0.8 mm diameter that is planar and runs straight through the carrier allowing the fluid to enter at one end and exit through the other. This configuration allows the fluid to make contact with the lower part of the capacitors when the chip is placed on top of the chip carrier. The capacitor chip is glued to the top of the carrier to form a watertight seal. Next, inductors were coupled to each of the pressure sensors by directly soldering the inductor coils onto the capacitor plate leads.
3.3. Test configuration
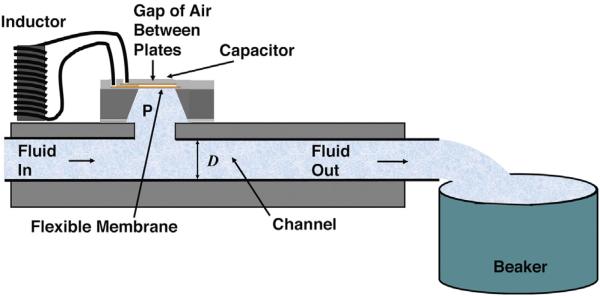
The configuration of the sensor used for the tests reported here is shown in Fig. 4. Fluid flows from a computer-controlled syringe pump through a channel of width D = 0.8 mm to a collector at atmospheric pressure which serves as a reference. The gap between the plates is vented, such that the air in between is also at atmospheric pressure. A distance l = 10 cm separates the sensor from the reference. An important feature of the design is that the entire fluid path, including the channel has a width greater or equal to 0.8 mm (the standard shunt tube inner diameter). There is no flow obstruction, but flow through the fluid resistance along the path produces a pressure difference, which allows the flow measurement.
Fig. 4.
Schematic, cross-sectional view of a test configuration for a single sensor.
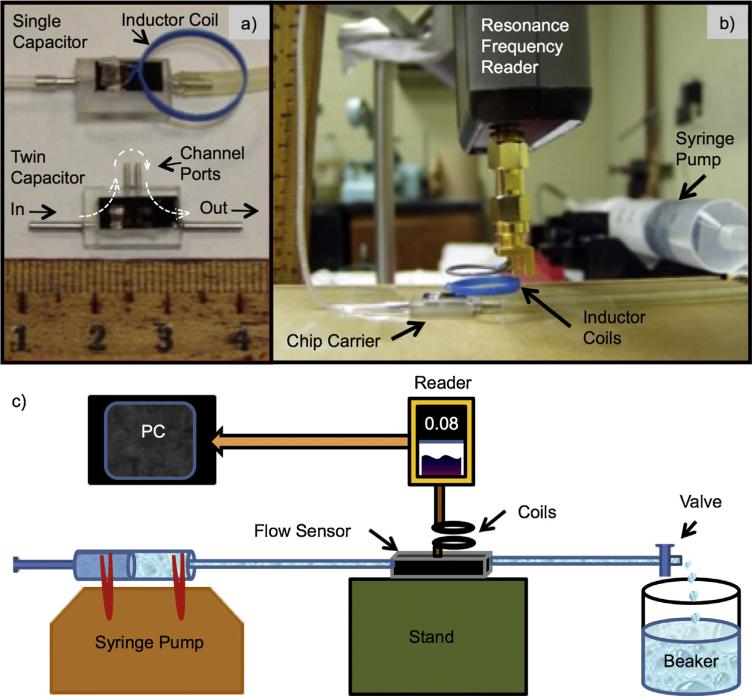
Examples of the sensors and the spectrometer are shown in Fig. 5a and b. The twin capacitor flow sensor is shown without the inductors attached. The twin capacitor has a pair of fluid ports labeled channel ports. A length of tubing is connected between the channel ports to provide flow resistance between the two capacitive sensors. The single capacitor version was used for the tests reported here as shown in Fig. 5b. The fluid used for testing was deionized (DI) water. The spectrometer is a custom-built, frequency synthesizer that sweeps a variable frequency signal to excite the detector coil. A schematic diagram is shown in Fig. 5c.
Fig. 5.
(a) Test sensors with a single capacitor with inductor coil attached (top) a twin-capacitor sensor without inductor coils (bottom); and (b) the flow control unit (Syringe Pump) and spectrometer (Resonance Frequency Reader) with a test sensor on a chip carrier. (c) Schematic diagram of the experimental set-up for testing a sensor. Here the pressure difference between the reference (beaker) and the flow sensor is produced by the flow in a shunt tube of known flow resistance Rhyd. The change in resonant frequency is read wirelessly by the spectrometer (Reader) as the rate of flow is controlled by the syringe pump.
3.4. Clinical configuration
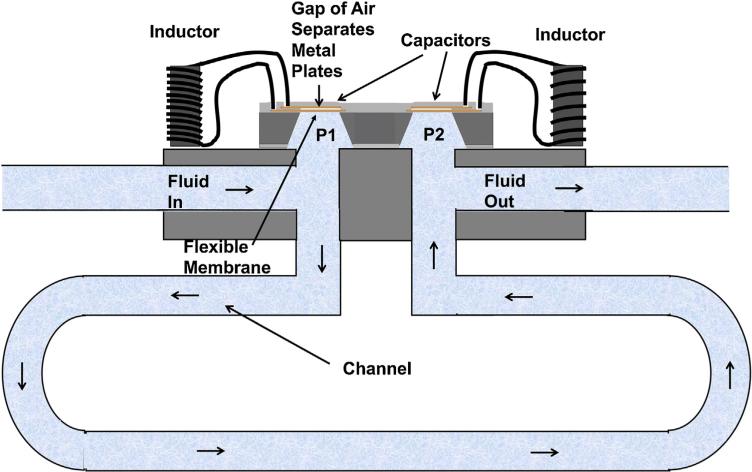
In the clinical configuration of the system we propose, our sensor would simply be added to a standard, ventricular-peritoneal shunt with a pressure control valve. A tilt sensor could also be used to improve accuracy, by correcting for gravity as will be described below. With the expectation of a variable pressure in the brain and the peritoneal cavity and a variable flow resistance in the pressure control valve, there is no reference pressure accessible except in the gap of the capacitor. The solution proposed is to put in twin capacitors and use the difference signal as a measure of flow and the average as a measure of pressure. Fig. 6 shows the twin capacitor sensor. In this case two inductors are needed. These inductors may be in close proximity and interact through mutual induction, but (as shown below) in spite of this interaction the LC circuits can be designed such that the resonant frequencies can be separated and detectable. Possible errors from mutual induction may be detected and corrections applied during calibration.
Fig. 6.
The clinical configuration for a flow/pressure sensor.
In Fig. 6, fluid flows from the ventricle to the first sensor, which measures P1 relative to the gas encapsulated between the capacitor plates. It then flows through a calibrated length of shunt tube (length of order 10 cm and flow resistance Rhyd) to the second sensor, which measures P2. P2 is lower because of the flow by an amount P1 − P2 = RhydV̇. When the sensor is horizontal, the pressure difference and the calibrated value of Rhyd determines V̇. P1 is related to the ICP, but must be corrected for the fluid path length from the entrance of the shunt (in the ventricle) and the vertical height difference.
If the plane of twin capacitive pressure sensors is parallel to gravity when the patient is in the horizontal position, the pressure difference P1 − P2 is only from the flow. The situation is different when the patient and whole shunt including the sensor is in the vertical position. In this case, there is a gravitational, hydrostatic pressure difference across the 1.5 mm height between the two capacitors, with the standard formula P1 − P2 = RhydV̇ − ρgh, where ρ is the density of the fluid, g is the gravitational constant and h is the height of fluid. Even for h = 1.5 mm, the hydrostatic pressure needs to be included in the analysis, but it is known and it is constant.
The flow/pressure sensor would be placed upstream of the pressure control system that is a part of all modern shunt systems. All of these valves close when the pressure at the inlet of the valve is less than the outlet pressure to prevent backflow. The valves are designed to open as a function of the pressure difference between the inlet and outlet and to keep the flow rate within a safe range and also prevent over drainage of CSF. The valve settings allow the flow sensor to be additionally calibrated taking into account factors that are not available during bench calibration. When the valves are set properly to avoid back flow, zero flow will be available as a reference condition for calibration purposes.
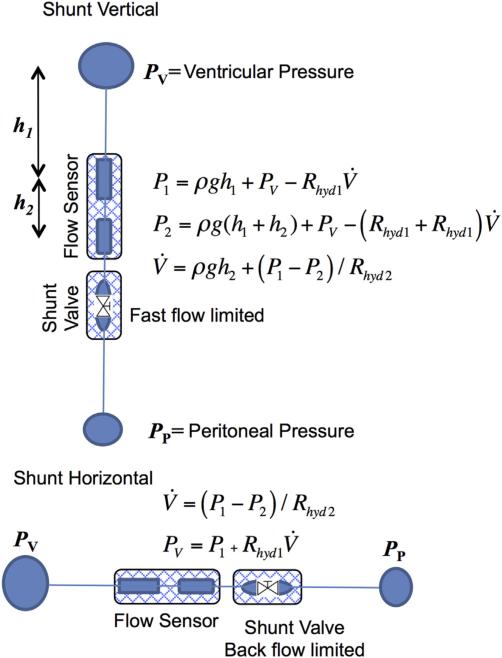
Fig. 7 shows a schematic view of the Smart Shunt system. The flow originates in the ventricle, goes through a tube to the first sensor, then the second sensor, then a standard pressure control valve and finally to the peritoneal cavity. With this set of components and the use of two patient positions, the set of measurements can determine both the ventricle pressure and the flow. We discuss below the estimate that the accuracies make the data clinically useful.
Fig. 7.
Schematic diagram of method for measuring pressure and flow in a shunt. With the shunt vertical, the differential pressure ΔP = P1 − P2 would determine the flow, V̇, corrected by the hydrostatic pressure calculated from the height, h2. When the shunt is horizontal there are no height differences and the ventricular pressure, PV, would be determined by the value of P1 corrected by Rhyd1V̇ calculated from ΔP.
The hydrostatic pressures can be easily compensated by measuring the tilt of the sensors relative to gravity. As an example for the sensors that we have tested the frequency shift for a hydrostatic pressure corresponding to a sensor height difference of h = 1.50 mm is 400 kHz. To reduce the uncertainty, this contribution should be measured carefully. The solution is to have the axis connecting the center of the two capacitors held vertically. In this orientation, the static gravitational pressure difference between the sensors is at a maximum, but it is insensitive to the angle from the vertical. Provided that this contribution remains a constant, a correction can be made because all of the physical parameters are known or can be easily measured. The vertical position is where the difference height as a function of angle, q, from vertical is least sensitive.
| (7) |
h is slowly varying for q near 0. Tilt sensors are commercially available with sensitivities of 0.01° and with double axes. For the system that we propose the height, h0 = 1.5 mm, the fluid density, ρ = 1.007 gm/cm2, and the gravitational constant, g = 980 cm/s2, a tilt angle of 0.01° corresponds to a change in height of only 8/10000 mm. This procedure is feasible even on a capacitor pair that is implanted in a patient. The tilt sensor can be mounted on the external spectrometer. With this control, the value of h can be adjusted to h0 or a correction can be introduced for a finite value of h. The patient can also be moved slightly to maximize the frequency. Again the twin capacitors are preferable.
3.5. Shunt occlusion
It is very important to monitor the shunt operation for malfunction because of an occlusion. Although it may be possible to gain some information from the pressure measurements, the combination of pressure and flow will be most valuable. For example, a history of flow readings may be recorded over time from a patient. A systematic decrease in the flow rate for a patient may indicate a narrowing of the flow path between the ventricle and any point in the shunt tube. A stoppage of flow indicates an occlusion. The combination of pressure, flow and patient orientation allows for a complete analysis of the shunt operation.
4. Results and discussion
4.1. Frequency vs. flow rate
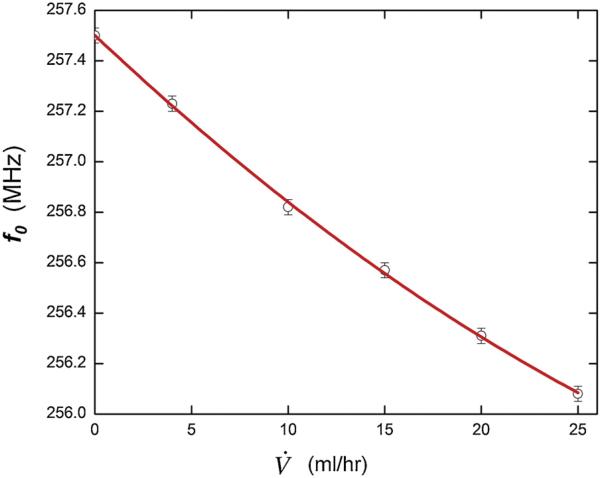
The frequency variation as a function of flow rate measured using the configuration shown in Figs. 4 and 5b is shown in Fig. 8. These data show a quadratic relation between resonant frequency, f0, and flow rate, V̇, of f0 = m1V̇ + m2V̇2 + b, where m1 = –72 (kHz-h/ml), m2 = 0.648 (kHz-(h/mL)2) and b = 257.5 MHz over a flow range up to 25 mL/h or (10 μL/s). The uncertainty in measuring the resonant frequencies is 30 kHz, as indicated by the error bars, with this small value arising because we fit the data delineating the resonance and extract the center frequency from the fit. The fit provides a statistically accurate description of the data with R2 = 0.9992. The uncertainty in the linear part of the slope, m1 = 3 and in the quadratic part, m2 = 0.1, both small values because of the accuracy in f0 and V̇. In this case, the maximum deflection of the capacitor membrane predicted from theory (Eqs. (1) and (3)) is in the range where we would expect a linear response or a slight curve downwards with increasing frequency (m2 < 0). This may be an indication that the model for the shape of the membrane under pressure (Eq. (4)) may not be the best representation at small pressures. Also, compliances of the tubing used may introduce an error and settling times at low flows may need to be studied. However, these effects may also be present in clinical use, which further indicates the importance of calibration. The ability of the single capacitor system to resolve different flow values is ~0.6 mL/h and the sensitivity is of the same order. For the dual capacitor case the sensitivity is proportional to the length of the channel between the two capacitors. It improves linearly with the channel length. In our case there is ~60 cm from the single capacitor pressure sensor to the output port, which controls the sensitivity.
Fig. 8.
Pressure sensor evaluation tests: (a) Basic response to controlled flow; the units of 10 mL/h correspond to 2.8 μl/s.
Measurements of the same device over a month resulted in a frequency drift equivalent to <0.3 mL/h, which is on the order of the uncertainty in the flow rate. These were performed while the device ran continuously at a constant flow rate in the physiological range. Measurements over a longer time will be needed to determine if the systematic drifts in the system become significant. Also, the sensitivity to temperature was measured to be equivalent to ΔV̇~1 mL/(h °C). There may be also be ambient pressure effects on the sensor in vivo, but this should have minimal affect when differential pressure measurements are employed.
4.2. Frequency vs. pressure
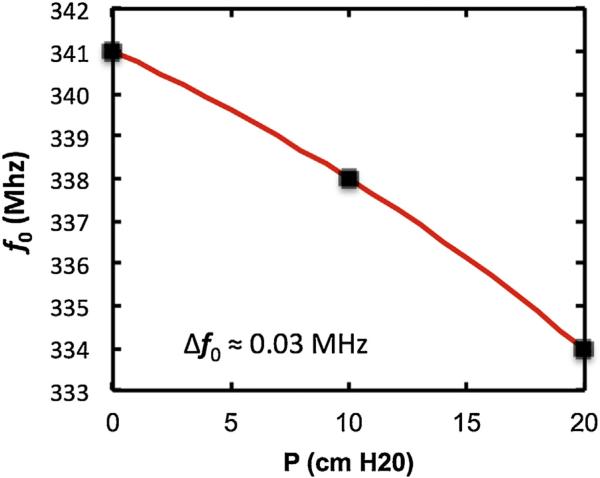
The frequency variation as a function of hydrostatic pressure was measured using the configuration shown in Fig. 5 except for the replacement of the syringe pump by a column of water. The result is shown in Fig. 9.
Fig. 9.
Resonant frequency as a function of the height of a column of water above a pressure-sensitive capacitive sensor.
The results show that the resonant frequency, f0, varies quadratically with P as f0 = m1 P + m2 P2 + b, where m1 = −0.25 MHz/(cmH2O), m2 = 0.005 MHz/(cmH2O)2 and b = 341 MHz. The quadratic term is negative in this case where there is no flow (compare to Fig. 8). This trend is consistent with the prediction of the theory for larger deflections of the membrane and indicates that Eq. (4) is a reasonable representation of the membrane shape at large deflections. The uncertainty in the resonant frequency is small and less than the size of the data points. This low uncertainty is achieved by fitting the entire peak region of the resonance, thus in effect averaging over 30 or more points. The uncertainty in P is ~.01 cmH2O. For the clinical case the expected uncertainty in P is also small because of manufacturing tolerances. As discussed earlier an electronic tilt sensor may be employed to compensate for the orientation of the patient.
4.3. Additional flow sensor evaluation tests
All of the tests above were carried out wirelessly, using inductive coupling between loops on the sensor and on the reader.
Dual resonance test
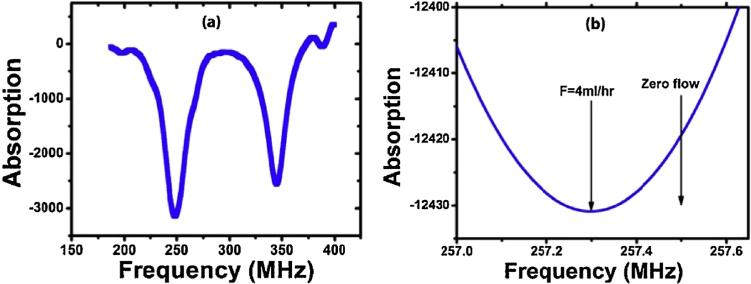
In a separate test, two different coils for two capacitors were used to produce resonances near 250 MHz and 350 MHz. The data shown in Fig. 10a indicates that our sensor can read two resonances simultaneously.
Fig. 10.
(a) Absorption as a function of frequency (b) Absorption as a function of frequency near the minimum.
Sensitivity and resonance width test
The resonant center frequency can be determined by fitting the entire curve to an uncertainty of 30 kHz much less than the resonance width, as shown in Fig. 10b. In the two measurements noted here, the resonance shift was 200 kHz with a standard deviation of 30 kHz was determined between zero flow and 4 mL/h.
5. Conclusion
We propose a smart shunt system that is composed of an implanted part with a standard shunt catheter leading from the ventricle to an implanted flow and pressure sensor, a standard pressure control valve and a shunt catheter leading to the peritoneal cavity. The sensor could be measured with an external wireless spectrometer and an orientation sensor. Test results from a MEMS-based capacitive pressure sensor show that the system could be sensitive to flow rates from below 0.6 mL/h to above 100 mL/h. It is also sensitive to pressures from less than 1 mm H2O to more than 20 cm H2O. Ideal measurements would be made with twin sensors and with their orientation controlled. The twin sensors are not sensitive to ambient temperature and pressure because their difference is used. These results describe a sensor that is then clinically useful in the range of conditions needed to monitor the slow flow of the cerebrospinal fluid through ventriculoperitoneal shunts.
Acknowledgements
The work was supported by the National Institutes of Health (NINDS) under grant R43NS056628-01A2 and a grant from the New Jersey Commission on Science and Technology. The variable capacitors were fabricated at the Microcircuit Fabrication Center (MFC) at NJIT and at the Cornell Nanofabrication Facility (CNF) at Cornell University.
Biographies
 Rahul Raj received his Masters in Electrical and Computer Engineering from New Jersey Institute of Technology, New Jersey, USA in 2008. He is currently engaged as a senior research fellow at CEERI CSIR-Madras Complex, India, where he established a Laser Interference Lithography and Fabrication Laboratory. His main research area is in the field of fabrication technology, micro-fluidics and optics with emphasis on the fabrication of nano scale structures for applications in light management systems.
 Dr. Shanmugamurthy Lakshmanan received an M.S. in Physics from Stevens Institute for Technology and a Ph.D. in Physics from New Jersey Institute for Technology. He is currently a Research Fellow at Wellman Center for Photomedicine, Harvard Medical School, Massachusetts. Dr. Lakshmanan is a distinguished Scientific Advisor for the World Institute for Scientific Exploration (WISE) and the head of the Indian Division of Sciences. He is also the Editor-in-Chief of two peer reviewed international journals: (1) Ancient Science and (2) Ayurveda. Dr. Lakshmanan is also the Research Director for the Research and Development division of the AAPNA-Harvard branch.
 David Apigo completed his Bachelor's degree in Physics and Classical Humanities at Rutgers: The State University of New Jersey in 2009. In August 2013, he received his M.S. in Applied Physics from the New Jersey Institute of Technology where he is currently pursuing his PhD. His primary research interests include MEMS devices, microfluidics, nanomaterials, and finite element analysis.
 Alokik Kanwal completed his Bachelor of Science in electrical/computer engineering and physics from Rutgers University in 2002. He received his Ph.D. in Materials Science from Rutgers University in 2008. He is currently an assistant research professor in the Department of Physics at New Jersey Institute of Technology located in Newark, NJ. His research is in biophysics, energy, and their applications at the nanoscale. He leads the nanoscale and microscale fabrication of devices designed to study these areas.
 Sheng Liu received his MS degree in physics electronics from Peking University in 2001 and PhD degree in applied physics from New Jersey Institute of Technology in 2007. From 2007 to 2008 Dr. Liu was a post-doctoral researcher in the Physics Department at New Jersey Institute of Technology. From 2008, Dr. Liu is working in Polarization-Solutions LLC, a nano/MEMS research and fabrication company, as Senior Nano/MEMS process engineer. His research interests include nano/MEMS, optical, wireless sensing technologies and applications on human interface devices, communication, biomedical devices and implantable medical device.
 Thomas Russell received his BS in Energy from Brown University, an MS in Mechanical Engineering from Stanford University and a PhD in Electrical Engineering from Brown University. He is the holder of four patents. His employment history includes Member of Technical Staff at Bell Laboratories, Manager of Test at Alcoa Electronic Packaging, VP of Technology at Voice-It Worldwide, Chief Controls Engineer at BOC Edwards, and VP of Engineering at Veritech. He is currently CTO of a startup company developing novel photovoltaic modules. Dr. Russell also provides electronics design and development consulting services for medical, automotive, industrial and consumer products.
 Joseph R. Madsen is an Associate Professor of Neuro-surgery at Harvard Medical School, and the Webster Family Chair of Neurosurgery and Neuroengineering at Boston Children's Hospital, where he is also director of the Epilepsy Surgery Program and the Neurodynamics Laboratory. He received his MD degree from the Harvard-MIT Division of Health Sciences and Technology. His research focuses on mechanical and electrical dynamics of the human brain, particularly as related to pediatric neurosurgical conditions such as hydrocephalus and epilepsy.
 Gordon A. Thomas a professor of physics at the New Jersey Institute of Technology, is currently studying and developing devices to prevent blindness, to treat brain injury, and to save soldiers’ lives. The American Physical Society has honored him as a Fellow of the Society, partly for his discovery of how a metal changes into an insulator. He received an Sc.B. from Brown, a Ph.D. from Rochester, and has conducted research at Tokyo, Harvard, the Massachusetts Institute of Technology and Bell Laboratories. He has published about 150 papers and holds 15 patents in basic and applied physics.
 Reginald C. Farrow is a Research Professor in Physics at NJIT. He obtained his Ph.D. in Physics from Steven's Institute of Technology in 1984. He obtained a B.S. in Physics from the University of Rochester and a Masters degree from Rutgers University. Dr. Farrow joined Bell Laboratories in 1976 and performed research in condensed matter physics, materials science, electron microscopy, and nanofabrication. In 2001 he joined Agere Systems where he coordinated activities between modeling, design and manufacturing to introduce new technology into the most advanced communications ICs. At NJIT Dr. Farrow's research explores the interface between nanotechnology and biophysics.
References
- 1.Di Rocco C, Massimi L, Tamburrini G. Shunts vs. endoscopic third ventriculostomy in infants: are there different types and/or rates of complications? A review, Child's Nerv. Syst. 2006;22(12):1573–1589. doi: 10.1007/s00381-006-0194-4. [DOI] [PubMed] [Google Scholar]
- 2.Garton HJ, Piatt JH., Jr Hydrocephalus. Pediatr. Clin. North Am. 2004;51(2):305–325. doi: 10.1016/j.pcl.2003.12.002. [DOI] [PubMed] [Google Scholar]
- 3.Robertson JS, Maraqa MI, Jennett B. Ventriculoperitoneal shunting for hydrocephalus. Br. Med. J. 1973;2(5861):289–292. doi: 10.1136/bmj.2.5861.289. [DOI] [PMC free article] [PubMed] [Google Scholar]
- 4.Aschoff A, et al. Overdrainage and shunt technology. Child's Nerv. Syst. 1995;11(4):193–202. doi: 10.1007/BF00277653. [DOI] [PubMed] [Google Scholar]
- 5.Lutz BR, Venkataraman P, Browd SR. New and improved ways to treat hydrocephalus: pursuit of a smart shunt. Surg. Neurol. Int. 2013;4(Suppl. 1):S38–S50. doi: 10.4103/2152-7806.109197. [DOI] [PMC free article] [PubMed] [Google Scholar]
- 6.Di Rocco CC, et al. Complications of CSF Shunting in Hydrocephalus: Prevention, Identification, and Management. Springer International Publishing; 2014. p. 2015. [Google Scholar]
- 7.Kulkarni AV, et al. Predicting who will benefit from endoscopic third ventriculostomy compared with shunt insertion in childhood hydrocephalus using the ETV success score. J. Neurosurg. 2010;6(4):310–315. doi: 10.3171/2010.8.PEDS103. [DOI] [PubMed] [Google Scholar]
- 8.Kulkarni AV, et al. Endoscopic third ventriculostomy vs cerebrospinal fluid shunt in the treatment of hydrocephalus in children: a propensity score-adjusted analysis. Neurosurgery. 2010;67(3):588–593. doi: 10.1227/01.NEU.0000373199.79462.21. http://dx.doi.org/10.1227/01.NEU.373 199.79462.21. [DOI] [PubMed] [Google Scholar]
- 9.Sekula RF, et al. Laparoscopically assisted peritoneal shunt insertion for hydrocephalus. Br. J. Neurosurg. 2009;23(4):439–442. doi: 10.1080/02688690902755605. [DOI] [PubMed] [Google Scholar]
- 10.Winston KR, Lopez JA, Freeman J. CSF shunt failure with stable normal ventricular size. Pediatr. Neurosurg. 2006;42(3):151–155. doi: 10.1159/000091857. [DOI] [PubMed] [Google Scholar]
- 11.Kandel Eric R., Thomas JHS, Jessell M. Principles of Neural Science. McGraw-Hill, Health Professions Division; New York, NY: 2000. [Google Scholar]
- 12.Tortora Gerard J., Derrickson Bryan H. Principles of Anatomy and Physiology. Wiley; Hoboken, NJ: 2009. [Google Scholar]
- 13.Tagawa T, Tamura T, Oberg PA. Biomedical Sensors and Instruments. Second ed. CRC Press; 2011. p. 2015. [Google Scholar]
- 14.Drost CJ, et al. Transit Time Ultrasonic Flow Measurement. Transonic Systems Inc.; US: 2009. [Google Scholar]
- 15.Bork T, et al. Development and in-vitro characterization of an implantable flow sensing transducer for hydrocephalus. Biomed. Microdevices. 2010;12(4):607–618. doi: 10.1007/s10544-010-9413-6. [DOI] [PubMed] [Google Scholar]
- 16.Rein H. Die thermo-strohmuhr: ein verfahren zur fortlaufenden messung der mittleren absoluten durch flussmengen in uneroffneten gefassen in situ. Z. Biol. 1928;87:384. [Google Scholar]
- 17.Woodcock JP. Theory and Practice of Blood Flow Measurement. Elsevier Science; 2013. [Google Scholar]
- 18.Akar O, Akin T, Najafi K. A wireless batch sealed absolute capacitive pressure sensor. Sensors Actuators A. 2001;95(1):29–38. [Google Scholar]
- 19.Chang S-P, Allen MG. Demonstration for integrating capacitive pressure sensors with read-out circuitry on stainless steel substrate. Sensors Actuators A. 2004;116(2):195–204. [Google Scholar]
- 20.Lei KF, Lee K-F, Lee M-Y. Development of a flexible PDMS capacitive pressure sensor for plantar pressure measurement. Microelectron. Eng. 2012;99(0):1–5. [Google Scholar]
- 21.Ha D, et al. Polymer-based miniature flexible capacitive pressure sensor for intraocular pressure (IOP) monitoring inside a mouse eye. Biomed. Microdevices. 2012;14(1):207–215. doi: 10.1007/s10544-011-9598-3. [DOI] [PubMed] [Google Scholar]
- 22.Sutera SP, Skalak R. The history of Poiseuille's law. Ann. Rev. Fluid Mech. 1993;25(1):1–20. [Google Scholar]
- 23.Oosterbroek RE, et al. A micromachined pressure/flow-sensor. Sensors Actuators A. 1999;77(3):167–177. [Google Scholar]
- 24.Oosterbroek RE, et al. Designing, realization and characterization of a novel capacitive pressure/flow sensor. TRANSDUCERS ‘97, 1997 International Conference on Solid State Sensors and Actuators; Chicago. 1997. [Google Scholar]
- 25.Timoshenko S, Woinowsky-Krieger S. Theory of Plates And Sheets. Second ed. McGraw-Hill; New York: 1959. [Google Scholar]
- 26.Vlassak JJ, Nix WD. A new bulge test technique for the determination of Young's modulus and Poisson's ratio of thin films. J. Mater. Res. 1992;7(12):3242–3249. [Google Scholar]
- 27.Pan JY, et al. Verification of FEM analysis of load-deflection methods for measuring mechanical properties of thin films. Solid-State Sensor Actuator Workshop 1990 4th Tech. Dig. IEEE. 1990 [Google Scholar]


