Abstract
Background:
Prognostic tools are widely used in the practice of Oncology and have been developed to help stratify patients into specific risk-related grouping. We sought to apply of two such tools used for patients with early-stage breast cancer and to correlate them with actual outcomes.
Methods:
A retrospective study was designed to include early-stage breast cancer cases seen from 1994 to 2014 at the Seyedoshohada Hospital in Isfahan, Iran. Information was derived from the patients’ records, and indices were derived from prognostic tools. Information was analyzed using descriptive statistics and one sample t-test.
Results:
In 233 patients, the difference between the predicted overall survival (OS) by the Adjuvant Online (AO) prognosis tools (69.28) and the observed OS (71.2) was not statistically significant (P = 0.52), and the AO prognosis tools had predicted the patients’ OS correctly. In the Nottingham prognosis index (NPI), this difference in all groups except the very poor prognosis group was not statistically significant.
Conclusions:
Adjuvant Online prognosis tools were capable of predicting the 10-year OS rate although not in all of the subgroups. The NPI was capable of distinguishing good, moderate, and poor survival rates, but this ability was not visible in more specific groups with moderate and poor prognosis.
Keywords: Early-stage breast cancer, Nottingham prognostic index, prognostic tools
INTRODUCTION
Breast cancer is the most common type of cancer, and also the second cause of cancer death in women. Breast cancer is made of a heterogeneous group of tumors which have varied genotypic and phenotypic features and which respond and behave differently to therapy. In addition to problems such as difficulty in gaining access to treatment and complexity of available treatment options, decision making regarding the most appropriate type of treatment for these patients is also really difficult. Clinical decision making in personalized breast cancer management requires robust and accurate risk stratification based not only on outcome prediction but also on a biological basis.[1] Some methods have already been developed to assist in predicting patient outcome and to support clinical decision making in breast cancer management. Some of these methods are the Nottingham prognostic index (NPI),[2,3,4] St. Gallen consensus criteria,[5] the National Comprehensive Cancer Network guidelines,[6] and Adjuvant Online (AO).[7]
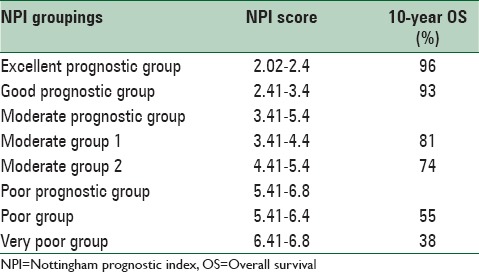
The NPI is a tool which takes into account the histologic features of the tumor. The NPI was originally developed in 1978 by Blamey et al.[8] and was then formally described in 1982 by Haybittle et al.[9] It is calculated using the following formula: Maximum invasive cancer size in centimeters × 0.2 + lymph node (LN) stage (1, 2, or 3) + histologic grade (1, 2, or 3).[9] With the numeric score obtained by this index, we can most likely reach an accurate predicted outcome.[2,10] The weaker the prognosis, the higher the numerical value of the NPI, also using cut-off points patients can be stratified into good, moderate, and poor prognostic groups.[9,11] The NPI has been confirmed after long-term follow-up,[2] validated independently in large multi-centered studies[3,12] and revised to stratify patients into five prognostic groups, the details of the NPI are shown in Table 1.[2,10]
Table 1.
NPI details
Adjuvant Online is a web-based, open-access computer program that predicts a 10-year outcome for breast cancer patients.[13] The program is developed using information from the Surveillance, Epidemiology, and End Results (SEER) registry. The SEER registry includes data from about 10% of breast cancer patients in the USA. The program analyzed the outcome of 10-year survival probabilities, risk of relapses, and survivals using patient information and tumor characteristics such as age, tumor size, tumor grade, estrogen receptor (ER) status, and LN status.[13] AO is increasingly being used by physicians.[14] The performance of AO has been evaluated in small cohorts of patients in Germany, and the program was successfully validated in a large population of Canadian women with early breast cancer in 2005.[15,16,17]
The performance of these two prognosis prediction tools simultaneously has not been evaluated in Iran. The aim of this study was to evaluate the performance of these two models in predicting the 10-year overall survival (OS) rate of early breast cancer patients referring to the Seyedoshohada Hospital in Isfahan.
METHODS
This study is an analytical study of retrospective type. All patients with early breast cancer who had been diagnosed during years 1994–2004 and who had referred to Seyedoshohada Hospital over these years were examined. The patients’ information including personal information, pathological information, and type of received treatment were extracted from their medical records. In 2014, we called all the patients and asked them about the status of their disease, and in case of probable death, the time and cause of deaths were revealed.
Treatment was based on the latest guidelines. The choice of treatment strategy was based on the tumor extent/location and biology as well as on the age and general health status of the patient and personal preferences. Most frequently used systemic regimens contained anthracyclines and/or taxanes, in selected patients cyclophosphamide, methotrexate, 5-flourouracil was used.
Since the NPI and AO have been developed for prognostication in the “adjuvant” setting, patients with metastatic breast cancer were excluded. For women who were included in the cohort, we applied the following eligibility criteria: Being aged 70 years or less; diagnosis of invasive breast carcinoma, availability of pathological data, including tumor grade, tumor size, and number of positive LNs harvested; availability of adjuvant systemic therapy records (including hormonal and cytotoxic agents); having performed surgery for breast cancer (including breast and axillary procedures); and having completed the 10-year follow-up.
Data analysis
For each eligible patient, NPI was calculated using the formula NPI = (0.2 × S) + N + G. In this formula, S is the tumor size in cm, N is the number of involved Lymphatic nodes (>3 = 3, 3–1 = 2, 0 = 1), and G is the degree of malignancy of the tumor (degree 3 = 3, degree 2 = 2, degree 1 = 1). Based on the numerical score obtained from the formula, the patients were located in one of the prognosis groups, and the 10-year OS was predicted and recorded.
For each eligible woman, Adjuvant Standard Version 8 was used to generate the 10-year prediction of OS. This prediction was obtained by entering each patient's information about age, tumor size, number of positive nodes, grade, ER status, and adjuvant systemic therapies received (types of hormone and chemotherapies) into the program. In order to be in line with the validated Canadian study,[15] all predictions were made with Adjuvant's comorbidity assumption set at the default of “minor problems.”
Using the Kaplan–Meier survival analysis, the survival rate was observed and the survival curve was obtained. To compare the predicted and observed survival, one sample t-test was used. Again in accordance with the validated Canadian study,[15] we considered Adjuvant reliable enough for clinical use if the predicted and observed outcomes were within 2% of one another.
The observed survival difference between the prognosis groups of NPI was analyzed using log-rank analysis. For evaluating the correlation between the values predicted by the two models, Spearman correlation was used. All tests were performed as two-tailed tests with 95% confidence intervals. P < 0.05% was considered significant. Statistical analysis was performed using SPSS 16.0 software (SPSS Inc. Released 2007. SPSS for Windows, Version 16.0. Chicago, SPSS Inc).
RESULTS
Five hundred and eighty-five patients with breast cancer referred to Seyedoshohada Hospitals in Isfahan from April 1994 to February 2004. From which 44 people due to metastasis detection, 29 people due to different pathology of disease, 5 people due their age being unknown and age over 70 years, 148 people due to uncertain pathological features, 96 people due to the uncertainty of the treatment received, and 30 people due to the unavailability of mortality conditions were excluded. Finally, the study sample size was reduced to 233 people.
The mean age of the 233 patients included in the study at the time of diagnosis was 46.26 years with standard deviation of 9.2 years, and a range of 24–70 years. Data analysis showed that 51.5% of receptor patients had positive estrogen, and the predominant pathology of patients (90.1%) was shown to be invasive ductal carcinoma. 96.1% of patients had received auxiliary chemotherapy, 83.3% hormone therapy, and 71.7% received radiotherapy after their surgery, and 91.4% of patients had mastectomy. During the study period, there has not been much change in the type of patients’ treatment.
In this study, in the course of 10-year, 73 patients out of 233 patients (31.33%) who were afflicted to early breast cancer died. From these 73 patients, 7 (9.59%) died because of reasons other than breast cancer and the rest (90.41%) died due to breast cancer. Based on Kaplan–Meier method, the mean of OS of the patients was obtained to be 101.11 (from 96.79 to 105.43) months. 1, 5, and 10-year OS was calculated as 99.6, 83.6, and 71.2%, respectively.
The average 10-year OS predicted by AO prognosis tools in all patients was obtained as 69.28%. Table 2 shows the comparison between the 10-year OS rate predicted by AO prognosis tools and the 10-year OS observed in all patients and in different subgroups of patients who were clinically important. In all patients, the difference between the predicted OS by the AO prognosis tools and the observed OS was not statistically significant (P = 0.527), and the AO prognosis tools had predicted the patients’ OS correctly. In most subgroups, the difference between the predicted survival and the observed survival was not statistically significant but by assuming that the difference within 2% is acceptable, the performance of the AO prognosis tools in predicting the patients’ survival was clinically valid in only five subgroups.
Table 2.
Baseline characteristics and 10-year survival predicted by AO and observed for women with breast cancer
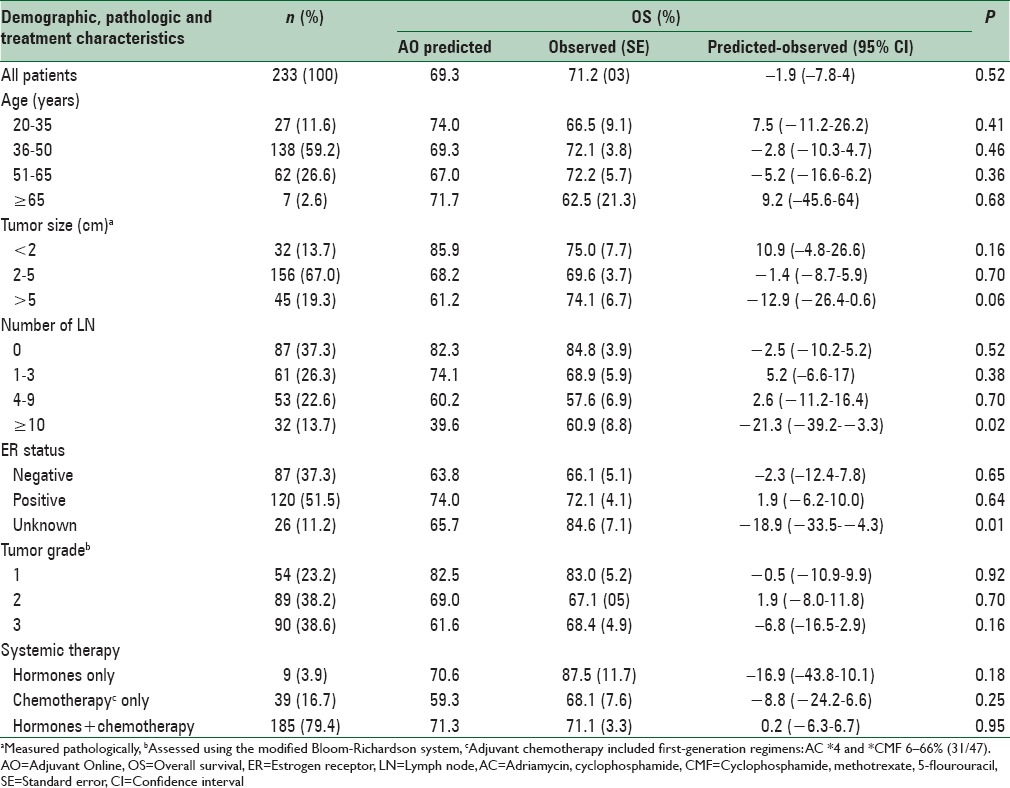
Table 3 shows the comparison between the predicted and observed 10-year OS rate in the NPI groups. The table shows that an increase in the score of NPI or deterioration of prognosis, in general, will result in a decrease in the patients’ OS. But a shift has taken place in the group with moderate prognosis in a way that the observed survival of the group with moderate prognosis 2 is shown to be more than the observed survival of the group with moderate prognosis 1, while survival prediction based on the NPI shows otherwise. The difference between the predicted and observed OS rate in all groups except the very poor prognosis group was not statistically significant. Based on the log-rank test, the difference between NPI groups in terms of observed OS was statistically significant (P = 0.006). Figure 1 shows the overall observed 10-year Kaplan–Meier survival curve based on NPI groupings.
Table 3.
Distribution of women with breast cancer based on nottingham prognostic index

Figure 1.
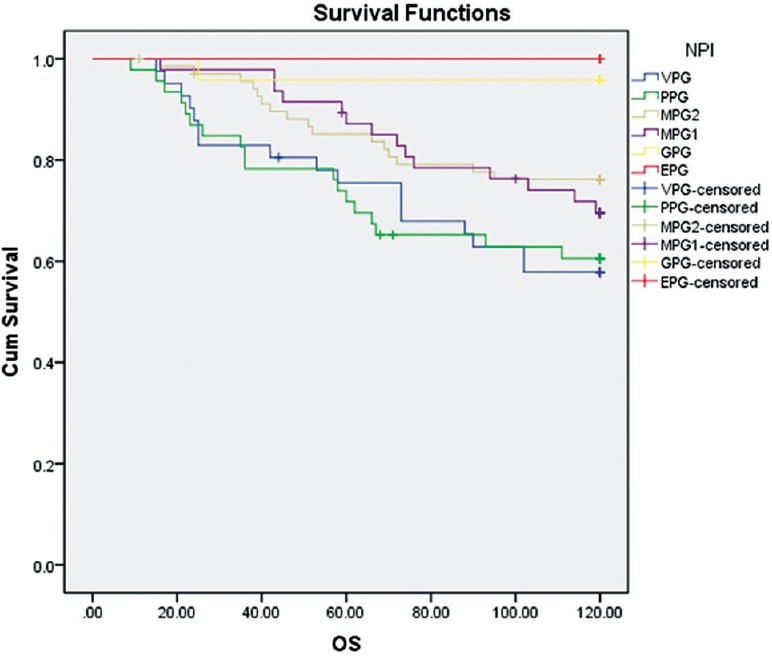
Kaplan–Meier OS curve for cohort based on NPI prognostic groups (NPI = Nottingham prognostic index; OS = Overall survival)
Figure 2 shows the error bar AO chart based on the NPI groupings. According to this diagram, the prediction of the AO prognosis tools was close to the prediction of NPI. For example, in group, excellent prognostic group, NPI with the estimated 10-year survival of 96%, the AO prognosis tool has evaluated the 10-year survival equal to 95.2%. Furthermore, a high correlation was observed between predicted values of AO prognosis tools and NPI (Spearman correlation 0.86 P < 0.001).
Figure 2.
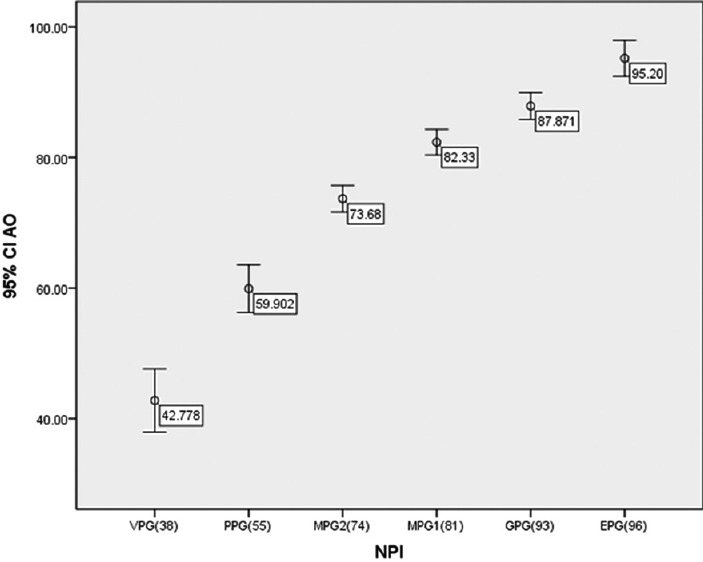
Error bar graph for AO based on NPI prognostic groups (NPI = Nottingham prognostic index; AO = Adjuvant Online)
Figure 3 shows the prediction of NPI versus the prediction of the AO prognosis tool. To draw this scatter plot graph, the NPI scores were sorted and data were divided into portions of 5% and for each portion, the mean NPI and AO prognosis tool were determined, then for these mean values, the scatter plot graph was plotted. Figure 3 indicates that the predictions of two tools are largely similar; also, generally, the predicted values of AO have been more than NPI.
Figure 3.
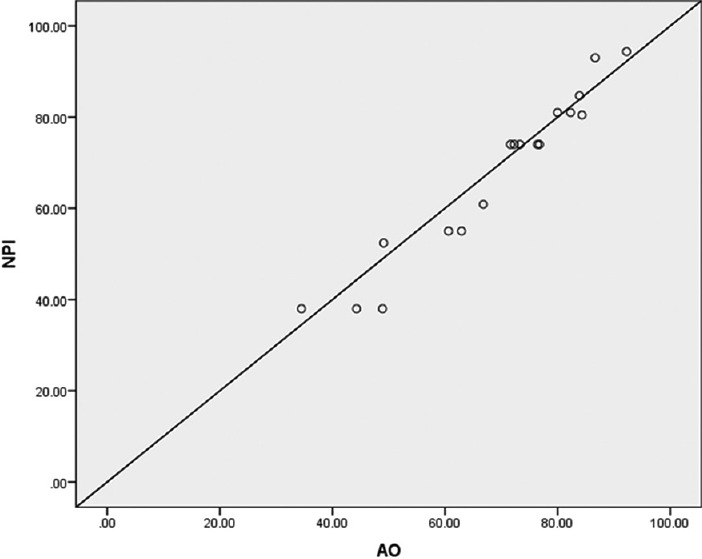
Scatter plot graph NPI versus the AO prognosis tool (NPI = Nottingham prognostic index; AO = Adjuvant Online)
DISCUSSION
This study was conducted to evaluate the validity of NPI and AO prognosis tools in predicting the 10-year OS rate of early breast cancer patients who referred to the Seyedoshohada Hospital. In this study, the predicted 10-year survival by AO prognosis tools was evaluated as 69.28% and the observed overall 10-year survival was evaluated as 71.2%.
Data analysis showed that the difference between the predicted OS rate by AO prognosis tools and observed OS (−1.9) in all patients is not statistically significant (P = 0.527) and since the difference is within 2%, it is reliable for clinical use. In all subgroups of patients, the difference between the predicted and observed survival rate was not statistically significant that is except for two subgroups (patients with 10 or more Lymphatic nodes, patients with unknown ER status) and in only 5 of the subgroups, this difference was within 2% and clinically significant. The reason of not having a clinically significant difference in most subgroups can be their small sample sizes. Several studies have been conducted over the world with the aim of evaluating the validity of AO prognosis tools.[18,19,20,21,22] An authoritative Dutch study with 5380 patients showed that there is no significant difference between the predicted OS rates by AO (69.1%) and the observed survival rates (69%),[20] and these findings are compatible with our results.
In most studies, AO prognosis tools had overestimated survival. Campbell et al. study which was conducted on 1056 English breast cancer patients showed that in general, the difference between the 10-year OS predicted by the AO prognosis tools (77.37%) and the observed OS (71.83%) is statistically significant (P < 0.001) and the AO prognosis tools had overestimated the OS (5.54%). Furthermore, these tools had overestimated the specific survival of breast cancer (4.53%, P < 0.001). They concluded that overestimation of specific survival of breast cancer implies that AO has underestimated the probability of breast cancer mortality in English women. One possible reason for this difference is that the rate of mortality due to breast cancer in America (age-standardized rate [ASR] =14.9) is less than the UK (ASR = 17.1).[19,23] Bhoo-Pathy et al. study which was conducted on 631 Malaysian early breast cancer patients showed that in general, the difference between the 10-year OS rate predicted by AO prognosis tools (70.3%) and the observed OS rate (63.6%) is statistically significant (P < 0.001) and the AO prognosis tools had overestimated the OS (6.7%). But according to receiver operating characteristic analysis, these tools were relatively strong in the identification of good and poor survival (the area under the curve 0.73). This difference may be due to the difference in life expectancy, tumor biology, the effect of anti-cancer therapy, compliance with treatment, and lifestyle after cancer between the population studied and the American population.[18] Jung et al. study conducted on 699 Korean patients afflicted to the early breast cancer showed that the difference between the 10-year OS predicted by the AO prognosis tools (68.6%) and the observed OS (57.5%) is statistically significant (P < 0.001), and the AO prognosis tools had overestimated the OS (11.1%). The main reason of this difference may be due to the small sample size of this study. The differences of disease characteristics in different countries, tool restrictions, and racial differences are listed as the other reasons for this difference.[21]
However, in Yao-Lung et al. study conducted on 699 Taiwanese patients diagnosed with early breast cancer, it was shown that the difference between the 10-year OS rate predicted by AO prognosis tools (80.56%) and the observed survival (84.44%) is statistically significant (P < 0.001) and that the AO prognosis tools had underestimated the OS (−3.88%). But in low-risk patients’ group unlike high-risk patients, this difference was not significant, and the tools had predicted survival correctly. This difference may be due to the difference in racial factors in different countries which affects the outcomes and treatments.[22]
In this study, the NPI could separate good, moderate, and poor survival rates well (log-rank, P = 0.006). Although in the group with moderate prognosis, which consists of two groups itself, groups 1 and 2, a shift in the observed survival of these groups can be observed. Also in all groups, the predicted survival by NPI is less than the observed survival except for the group with moderate prognosis 1 but this difference was not statistically significant other than in the group with a very poor prognosis.
On the other hand, distribution of patients in different groups of NPI is not consistent with the distribution of patients in the Blamey et al. study[9] which was done to update this index. In Blamey et al. study (and ours), 15% (2.6%) of patients were located in the group with excellent prognosis, 21% (10.3%) of patients in the group with good prognosis, 28% (20.2%) in the group with moderate prognosis 1, 22% (29.6%) in the group with moderate prognosis 2, 10% (19.7%) in the group with poor prognosis, and 4% (17.6%) in the group with very poor prognosis. In the current study compared to the study conducted by Blamey, a larger number of patients (about 4 times more) have located in the group with very poor prognosis. But the observed survival rate for this group was predicted 57.9% against 38% and this difference is very large. Furthermore, the observed survival in the group with poor prognosis is 60.6% which has a small difference with the observed survival in the group with very poor prognosis. One reason for this difference may be due to the difference in the size of the present study and that study.
To compare the predictions obtained from the two tools, Figures 2 and 3 are plotted. These Figures 2 and 3 indicate that the predictions of NPI and AO prognosis tools are largely similar.
The main limitation of this study is the small sample size. One reason for this small sample size was that our study was conducted as a retrospective study, and pathological information and mortality status of some patients were not available, so they were excluded from the sample. These problems could be avoided if there was a standard cancer registry center available in the province. A strength of this study was to investigate the validity of NPI and AO on a group of patients with breast cancer. However, most studies have focused on one of these tools. It is suggested that similar studies on a larger scale with a larger sample size to be done on patients with breast cancer.
CONCLUSIONS
This study was the first study in Iran conducted to evaluate the performance of NPI and AO prognosis tools. AO prognosis tools were capable of predicting the 10-year OS rate although not in all of the subgroups. The NPI was capable of distinguishing good, moderate, and poor survival rates, but this ability was not visible in more specific groups with moderate and poor prognosis.
Footnotes
Source of Support: Isfahan University of Medical Sciences
Conflict of Interest: None declared.
REFERENCES
- 1.Clark GM. Do we really need prognostic factors for breast cancer? Breast Cancer Res Treat. 1994;30:117–26. doi: 10.1007/BF00666054. [DOI] [PubMed] [Google Scholar]
- 2.Galea MH, Blamey RW, Elston CE, Ellis IO. The Nottingham Prognostic Index in primary breast cancer. Breast Cancer Res Treat. 1992;22:207–19. doi: 10.1007/BF01840834. [DOI] [PubMed] [Google Scholar]
- 3.Balslev I, Axelsson CK, Zedeler K, Rasmussen BB, Carstensen B, Mouridsen HT. The Nottingham Prognostic Index applied to 9,149 patients from the studies of the Danish Breast Cancer Cooperative Group (DBCG) Breast Cancer Res Treat. 1994;32:281–90. doi: 10.1007/BF00666005. [DOI] [PubMed] [Google Scholar]
- 4.D’Eredita’ G, Giardina C, Martellotta M, Natale T, Ferrarese F. Prognostic factors in breast cancer: The predictive value of the Nottingham Prognostic Index in patients with a long-term follow-up that were treated in a single institution. Eur J Cancer. 2001;37:591–6. doi: 10.1016/s0959-8049(00)00435-4. [DOI] [PubMed] [Google Scholar]
- 5.Goldhirsch A, Ingle JN, Gelber RD, Coates AS, Thürlimann B, Senn HJ, et al. Thresholds for therapies: Highlights of the St Gallen International Expert Consensus on the primary therapy of early breast cancer 2009. Ann Oncol. 2009;20:1319–29. doi: 10.1093/annonc/mdp322. [DOI] [PMC free article] [PubMed] [Google Scholar]
- 6.Carlson RW, Brown E, Burstein HJ, Gradishar WJ, Hudis CA, Loprinzi C, et al. NCCN Task Force report: Adjuvant therapy for breast cancer. J Natl Compr Canc Netw. 2006;4(Suppl 1):S1–26. [PubMed] [Google Scholar]
- 7.Ravdin PM, Siminoff LA, Davis GJ, Mercer MB, Hewlett J, Gerson N, et al. Computer program to assist in making decisions about adjuvant therapy for women with early breast cancer. J Clin Oncol. 2001;19:980–91. doi: 10.1200/JCO.2001.19.4.980. [DOI] [PubMed] [Google Scholar]
- 8.Blamey R, Davies C, Elston C, Johnson J, Haybittle J, Maynard P. Prognostic factors in breast cancer - the formation of a prognostic index. Clinical oncology. 1979;5:227. [PubMed] [Google Scholar]
- 9.Haybittle JL, Blamey RW, Elston CW, Johnson J, Doyle PJ, Campbell FC, et al. A prognostic index in primary breast cancer. Br J Cancer. 1982;45:361–6. doi: 10.1038/bjc.1982.62. [DOI] [PMC free article] [PubMed] [Google Scholar]
- 10.Blamey RW, Ellis IO, Pinder SE, Lee AH, Macmillan RD, Morgan DA, et al. Survival of invasive breast cancer according to the Nottingham Prognostic Index in cases diagnosed in 1990-1999. Eur J Cancer. 2007;43:1548–55. doi: 10.1016/j.ejca.2007.01.016. [DOI] [PubMed] [Google Scholar]
- 11.Ellis IO, Bell J, Todd JM, Williams M, Dowle C, Robins AR, et al. Evaluation of immunoreactivity with monoclonal antibody NCRC 11 in breast carcinoma. Br J Cancer. 1987;56:295–9. doi: 10.1038/bjc.1987.192. [DOI] [PMC free article] [PubMed] [Google Scholar]
- 12.Brown J, Jones M, Benson EA. Comment on the Nottingham Prognostic Index. Breast Cancer Res Treat. 1993;25:283. doi: 10.1007/BF00689843. [DOI] [PubMed] [Google Scholar]
- 13.Adjuvant Online Web Site. Available from: www.adjuvantonline.com .
- 14.Oakman C, Santarpia L, Di Leo A. Breast cancer assessment tools and optimizing adjuvant therapy. Nat Rev Clin Oncol. 2010;7:725–32. doi: 10.1038/nrclinonc.2010.170. [DOI] [PubMed] [Google Scholar]
- 15.Olivotto IA, Bajdik CD, Ravdin PM, Speers CH, Coldman AJ, Norris BD, et al. Population-based validation of the prognostic model ADJUVANT for early breast cancer. J Clin Oncol. 2005;23:2716–25. doi: 10.1200/JCO.2005.06.178. [DOI] [PubMed] [Google Scholar]
- 16.Euler U, Meisner C, Friedel C, Schmidt M, Untch M, Lisboa M, et al. Comparison of outcome prediction in node-negative breast cancer based on biomarkers uPA/PAI-1 or Adjuvant Online using the 10-year follow-up of the randomised multicentre Chemo N0 trial. J Clin Oncol. 2006;24(18 Suppl):534. [Google Scholar]
- 17.Schmidt M, Victor A, Bratzel D, Boehm D, Cotarelo C, Lebrecht A, et al. Long-term outcome prediction by clinicopathological risk classification algorithms in node-negative breast cancer – Comparison between Adjuvant, St Gallen, and a novel risk algorithm used in the prospective randomized Node-Negative-Breast Cancer-3 (NNBC-3) trial. Ann Oncol. 2009;20:258–64. doi: 10.1093/annonc/mdn590. [DOI] [PubMed] [Google Scholar]
- 18.Bhoo-Pathy N, Yip CH, Hartman M, Saxena N, Taib NA, Ho GF, et al. Adjuvant Online is overoptimistic in predicting survival of Asian breast cancer patients. Eur J Cancer. 2012;48:982–9. doi: 10.1016/j.ejca.2012.01.034. [DOI] [PubMed] [Google Scholar]
- 19.Campbell HE, Taylor MA, Harris AL, Gray AM. An investigation into the performance of the Adjuvant Online prognostic programme in early breast cancer for a cohort of patients in the United Kingdom. Br J Cancer. 2009;101:1074–84. doi: 10.1038/sj.bjc.6605283. [DOI] [PMC free article] [PubMed] [Google Scholar]
- 20.Mook S, Schmidt MK, Rutgers EJ, van de Velde AO, Visser O, Rutgers SM, et al. Calibration and discriminatory accuracy of prognosis calculation for breast cancer with the online Adjuvant program: A hospital-based retrospective cohort study. Lancet Oncol. 2009;10:1070–6. doi: 10.1016/S1470-2045(09)70254-2. [DOI] [PubMed] [Google Scholar]
- 21.Jung M, Choi EH, Nam CM, Rha SY, Jeung HC, Lee SH, et al. Application of the adjuvant Online model to Korean breast cancer patients: An assessment of prognostic accuracy and development of an alternative prognostic tool. Ann Surg Oncol. 2013;20:2615–24. doi: 10.1245/s10434-013-2956-z. [DOI] [PubMed] [Google Scholar]
- 22.Yao-Lung K, Dar-Ren C, Tsai-Wang C. Accuracy validation of adjuvant online in Taiwanese breast cancer patients – a 10-year analysis. BMC Med Inform Decis Mak. 2012;12:108. doi: 10.1186/1472-6947-12-108. [DOI] [PMC free article] [PubMed] [Google Scholar]
- 23.Globocan. 2012. [Last accessed on 2014]. Available from: http://www.globocan.iarc.fr/ia/World/atlas.html .


