Abstract
Background:
Full-field optical coherence tomography (FFOCT) is a real-time imaging technique that rapidly generates images reminiscent of histology without any tissue processing, warranting its exploration for evaluation of ex vivo kidney tissue.
Methods:
Fresh tissue sections from tumor and adjacent nonneoplastic kidney (n = 25 nephrectomy specimens; clear cell renal cell carcinoma (CCRCC) = 12, papillary RCC (PRCC) = 4, chromophobe RCC (ChRCC) = 4, papillary urothelial carcinoma (PUC) = 1, angiomyolipoma (AML) = 2 and cystic nephroma = 2) were imaged with a commercial FFOCT device. Sections were submitted for routine histopathological diagnosis.
Results:
Glomeruli, tubules, interstitium, and blood vessels were identified in nonneoplastic tissue. In tumor sections, the normal architecture was completely replaced by either sheets of cells/trabeculae or papillary structures. The former pattern was seen predominantly in CCRCC/ChRCC and the latter in PRCC/PUC (as confirmed on H&E). Although the cellular details were not very prominent at this resolution, we could identify unique cytoplasmic signatures in some kidney tumors. For example, the hyper-intense punctate signal in the cytoplasm of CRCC represents glycogen/lipid, large cells with abundant hyper-intense cytoplasm representing histiocytes in PRCC, and signal-void large polygonal cell representing adipocytes in AML. According to a blinded analysis was performed by an uropathologist, all nonneoplastic tissues were differentiated from neoplastic tissues. Further, all benign tumors were called benign and malignant were called malignant. A diagnostic accuracy of 80% was obtained in subtyping the tumors.
Conclusion:
The ability of FFOCT to reliably differentiate nonneoplastic from neoplastic tissue and identify some tumor types makes it a valuable tool for rapid evaluation of ex vivo kidney tissue e.g. for intraoperative margin assessment and kidney biopsy adequacy. Recently, higher resolution images were achieved using an experimental FFOCT setup. This setup has the potential to further increase the diagnostic accuracy of FFOCT.
Keywords: Ex vivo microscopy, full-field optical coherence tomography, histopathology, kidney, tumors
INTRODUCTION
According to the American Cancer Society, 61,560 new cases of kidney cancer (including renal and pelvis) will occur in the United States in 2015.[1]
The preoperative diagnosis and intraoperative management of renal tumors rely heavily on the histopathological evaluation of needle core biopsies (NCB) and frozen section analyses (FSA), respectively. NCB is used preoperatively to determine the nature of a lesion (benign or malignant) for appropriate treatment selection, such as conservative or minimally invasive procedures (e.g., ablation therapy or nephron-sparing surgery).[2,3] This is, especially beneficial for elderly patients with comorbidities or patients with contraindication for major surgery. FSA is done intra-operatively to assess the margins in partial nephrectomies.
Although histopathological evaluation of the tissue by NCB and/or FSA is the gold-standard technique, they have significant limitations. NCB requires tissue processing that is, fixation, sectioning and staining of the tissue. Tissue processing is a time-consuming procedure and, therefore, cannot provide a real-time evaluation of the tissue, which in turn impacts patient management. For example, a patient who undergoes a NCB for the diagnosis of a renal mass may come back with a nondiagnostic result (in 10–25% of cases)[4,5] after waiting several days for the histopathology report. This may necessitate a repeat biopsy procedure, increasing the risk of biopsy related complications, cost, and patient morbidity. FSA suffers from freezing artifacts that may hinder diagnosis and/or margin assessment during nephron-sparing surgery,[6] and FSA also requires waste of tissue that could be retained for ancillary studies and/or formalin-fixation and paraffin embedding.
Therefore, there is a need for a real-time imaging tool that can rapidly evaluate ex vivo tissue at cellular resolution without any tissue processing to greatly improve the management of kidney tumors. Recently, some optical biopsy techniques such as optical coherence tomography (OCT),[7,8,9] confocal microscopy,[10] optical reflectance/Raman spectroscopy,[11] and multiphoton microscopy[12] have been explored for the evaluation of renal carcinomas in both in vivo and ex vivo settings. However, all these techniques have their own limitations, and there exists still a need for novel imaging modalities to address this gap in the optimal management of small renal masses (SRMs).
Full-field optical coherence tomography (FFOCT) is one such promising optical imaging technique that relies on the principles of white light interference microscopy to generate high resolution images with relatively large field of view in fresh and formalin fixed tissues. FFOCT has been previously utilized to assess histological features of ex vivo nonkidney tissues.[13,14,15,16] Here, for the first time, we explored the potential of FFOCT for the rapid evaluation of ex vivo kidney tissue.
METHODS
Study Cohort
Twenty-five adult subjects who were diagnosed with kidney tumor on clinical imaging and underwent nephrectomies (partial or radical) at our institution participated in this Institutional Review Board approved the study.
Acquisition of the Samples
The freshly excised nephrectomy specimens (n = 25) received in surgical pathology were processed according to standard protocol. One section each from the tumor and nonneoplastic kidney were collected fresh in buffered saline and brought to the FFOCT microscope for imaging. Following FFOCT imaging, the specimens were placed in 10% buffered formalin and submitted for routine histopathological examination.
Full-field Optical Coherence Tomography Instrumentation
A commercial FFOCT system was used (light-CT™ scanner, LLTech SAS, Paris, France). It is a modified high-resolution FFOCT system (1.5 μm transverse and 0.8 μm axial resolution). This system uses a spatially and temporally incoherent light source of low power (Quartz-Halogen Schott KL 1500 Compact, Mainz, Germany). Transverse en-face tomographic images of the samples are obtained by the combination of interferential images acquired by a CMOS camera.[17,18,19] The microscope utilizes two matched 10X per 0.3 NA water immersion objectives (Olympus America, Center Valley, PA), one to collect reflections and backscattering signals from the specimen and the other to collect reflection signal from a reference mirror. The instrument design and the light path are shown in Figure 1.
Figure 1.
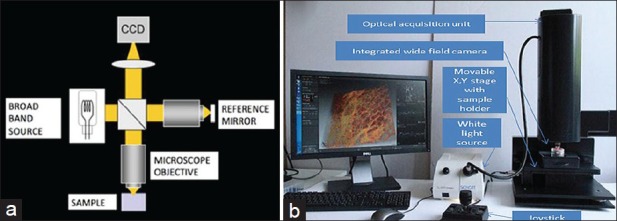
Full-field optical coherence tomography showing (a) schematic diagram of the optical pathway and (b) photograph of the system used
Image Acquisition
The samples to be imaged were immersed in an isotonic solution of phosphate-buffered saline (PBS; 2.7 mM potassium chloride and 137 mM sodium chloride; pH 7.5) and placed in a sample holder (part of the Light-CT™ system). A silica cover-slip was placed on top of the sample, and the base of the holder was gently moved upward, to slightly flatten the sample. This provided an even imaging surface and also expelled any air bubbles. A thick layer of silicone oil was applied on the silica cover-slip as the objective immersion medium. En-face images were acquired starting at the surface of the tissue in 5–10 μm increments in depth, until the deepest part of the tissue where meaningful signals could still be obtained. In our case, we could image kidney sections up to a depth of 60–70 μm. The native field of view is 0.8 mm by 0.8 mm; however larger fields of view can be acquired by image tiling. Imaging of a 2.72 mm × 2.72 mm field-of-view with 10 optical sections, reaching a depth of 50–60 μm within the tissue (representing a typical sample imaging session) took ~7 min. Two to eight images were acquired from different areas in a given sample, depending on the size of the specimen and areas of interest. The images were processed in real time with a Digital Imaging and Communication in Medicine viewer and saved. They were read and further processed with Image J software (National Institutes of Health, Bethesda, MD, USA), if necessary. Speckle noise was minimized using Gaussian filtering in Adobe Photoshop CS5 (San Jose, CA, USA).
Blinded Analysis
The research pathologist, who had previous experience in analyzing FFOCT images organized images into two sets: “Training” and “validation.” These sets were shown to an attending uropathologist at our institution for a blinded analysis. The attending uropathologist had no previous experience in reading FFOCT images. Thus, he was first shown the “training” set to familiarize him with the signatures of nonneoplastic and neoplastic kidney tissue on FFOCT (as noted by the research pathologist and subsequently confirmed on H&E). The “training set” comprised of a total of 13 images; 5 from nonneoplastic tissues and 8 from tumors (3 = clear cell renal cell carcinoma, 3 = chromophobe RCC and 2 = papillary RCC). Papillary urothelial carcinoma or benign tumors (cystic nephroma (CN) and angiomyolipoma [AML]) were not included in the training set due to their small sample size. The images used for the “training” set were excluded from the blinded analysis. Since on an average 2–8 images were acquired from both nonneoplastic and neoplastic tissue, this exclusion did not affect our blinded analysis. Next, the same uropathologist was shown the “validation set.” This set comprised a total of 67 images (normal = 27 and tumor = 40). The uropathologist was asked to categorize these images as nonneoplastic or neoplastic and, if neoplastic, as benign or malignant. He was also asked to characterize the tumor type based on its architecture and unique FFOCT signatures. Later, these results were compared with their corresponding H&E to assess the diagnostic accuracy of FFOCT. Tumors were classified according to the International Society of Urological Pathology Vancouver Classification of Renal Neoplasia.[20]
RESULTS
Full-field Optical Coherence Tomography Can Identify Various Components of Nonneoplastic Human Kidney Tissue
All four main components of the normal kidney that is, glomerulus, tubules, blood vessels and interstitium were readily identified on FFOCT [Figure 2]. These components were recognized based on their histomorphological architecture and amount of reflected or scattered light originating from different tissue types. The cortex was mainly comprised glomeruli and convoluted tubules [Figure 2a]. Glomeruli appeared as a globular structure composed of a capillary tuft (dull gray signal) and surrounded by a signal-void Bowman's space [Figure 2a]. Convoluted tubules, that is, proximal and distal tubules, appeared as tubular structures of varying size and shapes with an epithelial lining (dull gray signal) [Figure 2a]. Medullary rays composed of straight tubules lined by epithelial cells (dull gray signal) were identified in the medulla [Figure 2b]. The interstitium comprised connective tissue had bright signal mainly originating from collagen fibers [Figure 2c]. Blood vessels appeared as luminal, signal-void structures of varying calibers without any epithelial lining. Thick muscular wall (dull gray signal) was identified in large caliber blood vessels [Figure 2c]. All the above mentioned histomorphological features seen in nonneoplastic kidney tissue were confirmed on their corresponding H&E slides [Figure 2d–f].
Figure 2.
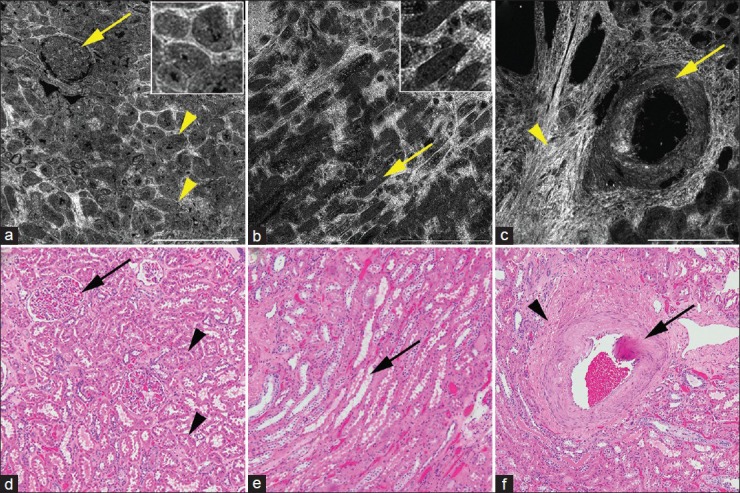
Full-field optical coherence tomography (a-c) and corresponding H&E image (d-f) of nonneoplastic kidney. (a) Cortex with glomerulus (arrow) and tubules (arrowheads). Inset shows zoomed in images of the tubules. (b) Medulla with medullary rays (arrows). Inset shows zoomed in images of the tubules. And (c) large caliber blood vessel (arrow) surrounded by bright interstitium (arrowhead). Full-field optical coherence tomography (a-c); scale bars = 0.5 mm. Insets × 2.5, zoom of images a and b, respectively. H&E (d-f); total magnifications = ×100
Full-field Optical Coherence Tomography Can Identify and Differentiate Neoplastic from Nonneoplastic Kidney Tissue
In addition to identifying all the major components of nonneoplastic kidney, we could reliably differentiate nonneoplastic from neoplastic tissue on FFOCT. Further, based on their architecture, tumors were broadly classified as papillary and nonpapillary (sheets or trabeculae of cells) on FFOCT [Figures 3 and 4, Table 1].
Figure 3.
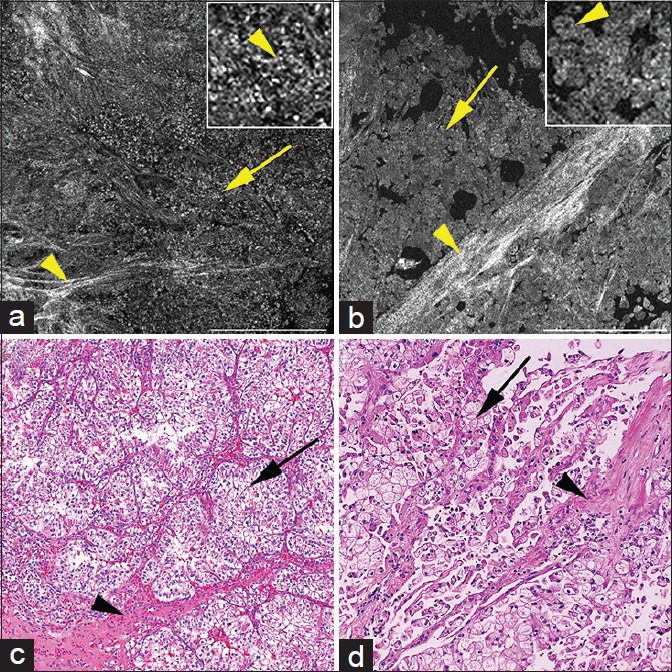
Full-field optical coherence tomography (a and b) and corresponding H&E images of (c and d) of nonpapillary kidney tumors. (a) Clear cell renal cell carcinoma with sheets of cells (arrow) and stroma (arrowhead). Cells have bright punctate structures in cytoplasm (inset; arrowhead). (b) Chromophobe renal cell carcinoma with sheets of cells (arrow) and bright stroma (arrowheads). Cells have abundant homogenous cytoplasm (inset; arrowhead). Full-field optical coherence tomography (a and b); scale bars = 0.5 mm. Insets = ×3 zoom of images a and b, respectively. H&E (c and d); total magnifications = ×100
Figure 4.
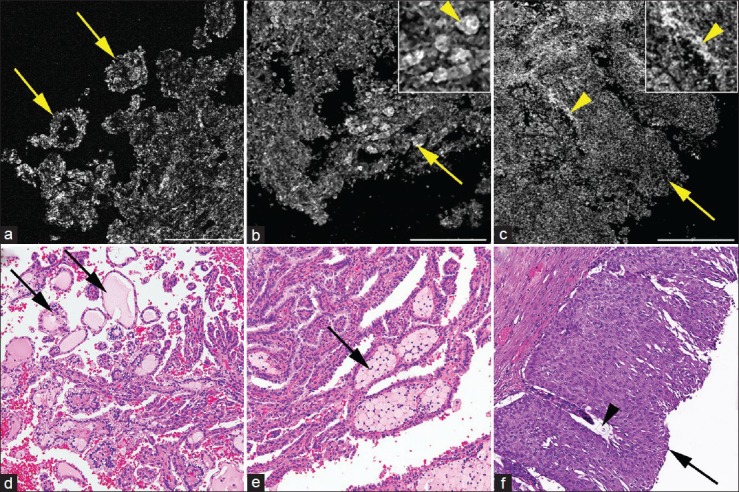
Full-field optical coherence tomography (a-c) and corresponding H&E images of (d-f) of papillary kidney tumors. (a) Papillary renal cell carcinoma showing papillae (arrows). (b) Papillary renal cell carcinoma showing papillae (arrow) filled with large bright cells (arrowhead; inset) confirmed as histiocytes (arrow) on corresponding H&E (e). (c) Papillary urothelial carcinoma showing thick papillae with fibrovascular core; collagen bright signal adjacent to signal void oval blood vessel (arrow; inset with arrowhead). Full-field optical coherence tomography (a-c); scale bars = 0.25 mm. Insets = 2× zoom of images b and c, respectively, H&E (d-f); total magnifications = ×200
Table 1.
Signatures of kidney tumors on FFOCT as compared to morphological features on H and E
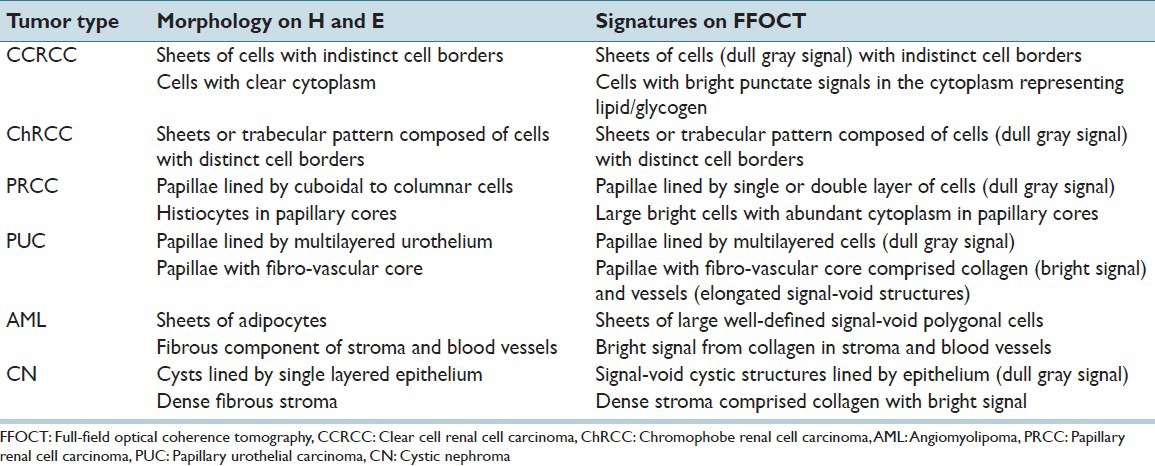
The nonpapillary tumors that were imaged in our study mainly comprised clear cell RCC (CCRCC) and chromophobe RCC (ChRCC), as diagnosed on H&E [Figure 3]. CCRCC had cells (dull gray signals) with indistinct cell borders and central signal-void nucleus. Bright punctate particles were observed in the cytoplasm of these cells [Figure 3a]. We hypothesize that the bright punctate signal represents glycogen and/or lipid droplets in the cytoplasm of CCRCC. In contrast, the CCRCC cells on H&E have clear cytoplasm, since the glycogen and lipid get washed out during tissue processing [Figure 3c]. ChRCC, on the other hand, had large cells with distinct cell border and homogenous cytoplasm (dull gray signal) [Figure 3b]. Thickened blood vessels with collagen proliferation (bright signal) in their wall (dysmorphic blood vessels on H&E) were also identified in ChRCC [Figure 3b and d].
Likewise, the papillary tumors imaged in our study mainly comprised of papillary RCC (PRCC) and PUC [Figure 4]. PRCC had papillae lined by columnar-cuboidal epithelial cells (dull gray signal) [Figure 4a and d]. In the majority of the PRCC, we identified large cells with very bright cytoplasm in the cores of the papillae [Figure 4b]. These large, bright cells were confirmed as histiocytes on corresponding H&E [Figure 4e]. On the contrary, PUC had papillae lined by multi-layered urothelium (dull gray signal) with central fibro-vascular core [Figure 4c]. The fibrovascular core had collagen (bright signal) and blood vessels (elongated signal void spaces) without histiocytes, as confirmed on H&E [Figure 4f].
In addition to the malignant kidney tumors, we also imaged two types of benign kidney tumors that is, AML and CN [Figure 5]. AML was recognized by the presence of adipocytes. Adipocytes appeared as large polygonal cells with distinct cell border and signal-void cytoplasm [Figure 5a]. Surrounding collagen (bright signal) present in the interstitium and vascular walls was also identified [Figure 5a]. Cystic nephroma had mostly cystic structures (signal-void) separated by fibrous tissue septae (bright signal) [Figure 5b]. These morphological features in AML and CN were confirmed on their corresponding H&E [Figure 5c and d].
Figure 5.
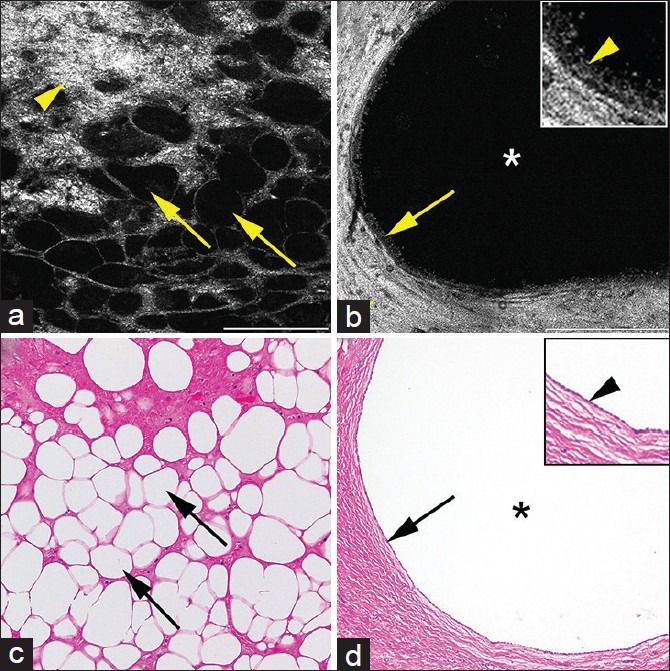
Full-field optical coherence tomography (a and b) and corresponding H&E images of (c and d) of benign kidney tumors. (a) Angiomyolipoma showing signal void polygonal adipocytes (arrows) and bright connective tissue from collagen (arrowhead). (b) Cystic nephroma showing large signal void cyst (*) lined by single layered epithelium with dull gray signal (arrow and inset with arrowhead) embedded in thick collagenous tissue (bright signal; arrowhead). Full-field optical coherence tomography; scale bars (a) = 0.25 mm, (b) = 0.5 mm. Inset 2 × zoom of images B. H&E (c and d); total magnifications = ×200
In addition to images acquired by the FFOCT prototype used in this study, some of the images were also acquired using an experimental FFOCT system equipped with a 30 × Olympus objective with a much higher NA of 1.05 [Figure 6]. Figure 6 shows an image of nonneoplastic rat's kidney mainly comprised tubules with a better lateral resolution as compared to our system.
Figure 6.
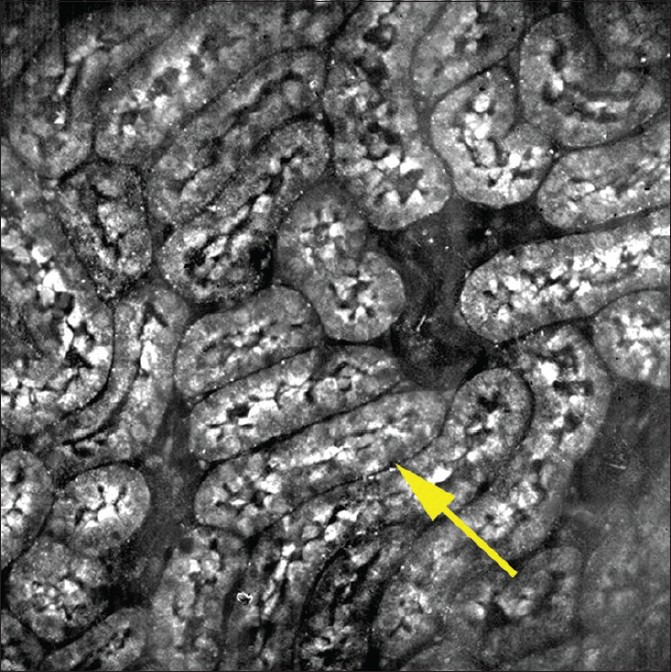
Full-field optical coherence tomography image from rat's kidney showing tubules (arrows) at a relatively higher resolution, acquired by an experimental Full-field optical coherence tomography system equipped with a × 30 Olympus objective (NA; 1.05). Field of view = 260 μ ×260 μ
Blinded Analysis
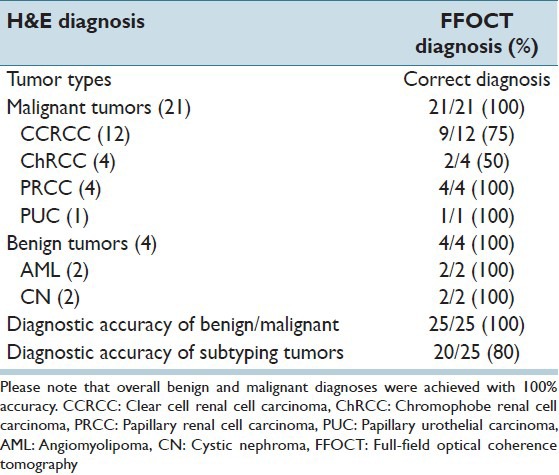
In our study, a total of 25 kidney tumors were imaged with FFOCT. Of these, 21 were malignant (12 CCRCC, 4 PRCC, 4 ChRCC and 1 PUC) and 4 were benign (2 AML, 2 CN), as diagnosed on H&E.
For the blinded analysis, a total of 67 images (normal = 27 and tumor = 40) were analyzed by an uropathologist at our institute. Nonneoplastic tissue was correctly identified in all 27/27 (100%) images. Likewise, neoplastic tissue was correctly identified in all 40/40 (100%) images included in this analysis. Further, all benign tumors (2 cases each of AML and cystic nephroma), that is, 4/4 (100%) were called benign and all malignant tumors, that is, 21/21 cases were correctly labeled as malignant by the uropathologist. In addition to accurately identifying and differentiating neoplastic from nonneoplastic kidney tissue, and benign from malignant tumors, the uropathologist also subtyped the tumors. The subtyping was based on the architecture, that is, predominantly papillary versus predominantly solid pattern of the tumor and also on the unique FFOCT signatures as described in the results above. The bright punctate signal in the cytoplasm was a consistent feature of CCRCC that helped in correctly diagnosing 9/12 (75%) cases of CCRCC. Of the remaining 3/12 CCRCC cases that were not correctly diagnosed on FFOCT, two cases had poor quality images, and one case had cystic structures with the very little cellular area to evaluate. Similarly, ChRCC was correctly diagnosed in 2/4 (50%) cases. The two misdiagnosed cases of ChRCC were diagnosed as CCRCC. On the other hand, all cases of PRCC, that is, 4/4 (100%) and PUC 1/1 (100%) were correctly diagnosed on FFOCT. Thus we obtained a total diagnostic accuracy of subtyping the tumors in 20/25 (80%) cases. The case distribution and results of the blinded analysis are illustrated in Table 2.
Table 2.
Case distribution of kidney tumors and results of blinded tumosr subtype diagnostic accuracy
No formal power calculations, such as positive and negative predictive value, were performed in this study due to the small sample size of the tissues imaged.
CONCLUSIONS
In this study, we have demonstrated the ability of FFOCT to identify all major components of a normal kidney, such as glomeruli, tubules, blood vessels and interstitium. Besides identifying normal components of the kidney, FFOCT could reliably differentiate neoplastic from the nonneoplastic tissue. Further, kidney tumors could be broadly classified as papillary (PRCC and PUC) and nonpapillary (CCRCC and ChRCC) based on their architecture. In addition, some of the tumors such as CCRCC and PRCC had unique FFOCT signatures that helped in their diagnosis. CCRCC was characterized by the presence of the bright punctate cytoplasmic signal (representing glycogen and/or lipid content), and the majority of PRCC had large bright cells in their papillary core (representing histiocytes).
FFOCT has been previously used to characterize various ex vivo tissues and to differentiate neoplastic from nonneoplastic tissue in several organs other than kidney.[13,14,15,16] Here, for the first time, we have used FFOCT to evaluate ex vivo neoplastic and nonneoplastic kidney tissue. Furthermore, a blinded analysis was also conducted by an attending uropathologist to validate the results.
FFOCT offers several advantages making it a potential rapid, real-time imaging tool. One of the major advantages is the ability to generate high-resolution images (1–2 μm lateral resolution) reminiscent of histopathology from fresh ex vivo tissue without tissue processing or use of contrast agents or dyes. Another advantage is the relatively fast speed of image acquisition, i.e., a single plane of ~3 mm² can be acquired in ~ 43 s. In addition, images can also be acquired in “z” plane going up to a depth of ~50 μm in the tissue. Furthermore, the use of a regular halogen lamp as the light source ensures the relative safety of FFOCT for use in human tissue (no potential laser damage). Finally, the user-friendly format and compact size of FFOCT makes its installation feasible in busy and tight spaces such as intra-operative suites or gross rooms of surgical pathology.
Therefore, based on our results and the above-mentioned advantages of FFOCT, we envision several ex vivo clinical applications. FFOCT, when used during a preoperative biopsy procedure, has the potential to replace fine-needle aspiration cytology and/or touch imprint cytology for rapid on-site evaluation of tissue to confirm its diagnostic adequacy. This might help reduce the rate of a nondiagnostic biopsy on final histopathology and subsequently repeat biopsies and its complications, as well as cost. In addition, since the tissue is not processed in any way for FFOCT, this tissue can be triaged post-FFOCT evaluation for ancillary studies, (e.g., immunohistochemistry or genomics).[3]
Similarly, FFOCT, when used intra-operatively, can potentially replace FSA for margin assessment during partial nephrectomies. Since FFOCT does not require tissue processing, it can analyze tissues faster, and without causing any tissue artifacts.
Besides the use of FFOCT for diagnosis and management of renal tumors, it could also play an important role in the diagnostic workflow of medical kidney disease (MKD). For the evaluation of MKD, renal biopsy tissue is routinely divided up into separate samples for light microscopy, immunofluorescence, and electron microscopy evaluation. This is normally achieved under a dissecting microscope.[21] Although, dissecting microscope has a high accuracy of detecting glomeruli, but due to lack of cellular resolution it may at times fail to differentiate between various simulators of glomeruli.[22] The ability of FFOCT to reliably identify normal renal parenchyma at the cellular level could provide with a more reliable way of triaging renal biopsies. Further, a computer-assisted algorithm could be developed from the FFOCT images to help guide nephrologists into triaging the quality of their cases remotely before they are sent to pathology.
However, the clinical FFOCT prototype (light-CT) that was used in our study has some limitations. Though FFOCT could reliably identify and differentiate all neoplastic from nonneoplastic kidney tissue, and malignant from benign tumors, correct tumor subtyping was only achieved in 80% of the cases imaged. This was mainly due to lack of enough cellular and nuclear details to classify the tumors. This limitation is predominantly a function of the use of a relative low NA (0.3) objective in this prototype, along with the presence of speckle artifacts that further reduces effective resolution. As shown in the results, higher resolution images are now feasible to acquire using the experimental FFOCT system equipped with a 30 × Olympus objective with a much higher NA of 1.05. This FFOCT prototype shows promising results and may be used in the future to conduct similar studies with a larger sample size. Consequently, it is our opinion that while the current prototype is excellent for a quick diagnostic impression on clinical specimens where a decision can be made on architectural information alone, it will require better lateral resolution for successfully addressing clinical questions that require cellular and/or nuclear information.
SUMMARY
Based on our study, we foresee FFOCT as a valuable real-time imaging tool for rapid evaluation and triaging of fresh ex vivo kidney tissue. We posit that FFOCT could help improve preoperative and intra-operative diagnosis, and thus facilitate better clinical management of patients with kidney tumors.
Financial Support and Sponsorship
Nil.
Conflicts of Interest
There are no conflicts of interest.
Footnotes
Available FREE in open access from: http://www.jpathinformatics.org/text.asp?2015/6/1/53/166014
REFERENCES
- 1.Siegel R, Ma J, Zou Z, Jemal A. Cancer statistics, 2014. CA Cancer J Clin. 2014;64:9–29. doi: 10.3322/caac.21208. [DOI] [PubMed] [Google Scholar]
- 2.Corcoran AT, Russo P, Lowrance WT, Asnis-Alibozek A, Libertino JA, Pryma DA, et al. A review of contemporary data on surgically resected renal masses – Benign or malignant? Urology. 2013;81:707–13. doi: 10.1016/j.urology.2013.01.009. [DOI] [PubMed] [Google Scholar]
- 3.Frank I, Blute ML, Cheville JC, Lohse CM, Weaver AL, Zincke H. Solid renal tumors: An analysis of pathological features related to tumor size. J Urol. 2003;170(6 Pt 1):2217–20. doi: 10.1097/01.ju.0000095475.12515.5e. [DOI] [PubMed] [Google Scholar]
- 4.Leveridge MJ, Finelli A, Kachura JR, Evans A, Chung H, Shiff DA, et al. Outcomes of small renal mass needle core biopsy, nondiagnostic percutaneous biopsy, and the role of repeat biopsy. Eur Urol. 2011;60:578–84. doi: 10.1016/j.eururo.2011.06.021. [DOI] [PubMed] [Google Scholar]
- 5.Shannon BA, Cohen RJ, de Bruto H, Davies RJ. The value of preoperative needle core biopsy for diagnosing benign lesions among small, incidentally detected renal masses. J Urol. 2008;180:1257–61. doi: 10.1016/j.juro.2008.06.030. [DOI] [PubMed] [Google Scholar]
- 6.Lam JS, Bergman J, Breda A, Schulam PG. Importance of surgical margins in the management of renal cell carcinoma. Nat Clin Pract Urol. 2008;5:308–17. doi: 10.1038/ncpuro1121. [DOI] [PubMed] [Google Scholar]
- 7.Lee HC, Zhou C, Cohen DW, Mondelblatt AE, Wang Y, Aguirre AD, et al. Integrated optical coherence tomography and optical coherence microscopy imaging of ex vivo human renal tissues. J Urol. 2012;187:691–9. doi: 10.1016/j.juro.2011.09.149. [DOI] [PMC free article] [PubMed] [Google Scholar]
- 8.Barwari K, de Bruin DM, Cauberg EC, Faber DJ, van Leeuwen TG, Wijkstra H, et al. Advanced diagnostics in renal mass using optical coherence tomography: A preliminary report. J Endourol. 2011;25:311–5. doi: 10.1089/end.2010.0408. [DOI] [PubMed] [Google Scholar]
- 9.Barwari K, de Bruin DM, Faber DJ, van Leeuwen TG, de la Rosette JJ, Laguna MP. Differentiation between normal renal tissue and renal tumours using functional optical coherence tomography: A phase I in vivo human study. BJU Int. 2012;110(8 Pt B):E415–20. doi: 10.1111/j.1464-410X.2012.11197.x. [DOI] [PubMed] [Google Scholar]
- 10.Campo-Ruiz V, Lauwers GY, Anderson RR, Delgado-Baeza E, González S. Novel virtual biopsy of the kidney with near infrared, reflectance confocal microscopy: A pilot study in vivo and ex vivo. J Urol. 2006;175:327–36. doi: 10.1016/S0022-5347(05)00008-X. [DOI] [PubMed] [Google Scholar]
- 11.Couapel JP, Senhadji L, Rioux-Leclercq N, Verhoest G, Lavastre O, de Crevoisier R, et al. Optical spectroscopy techniques can accurately distinguish benign and malignant renal tumours. BJU Int. 2013;111:865–71. doi: 10.1111/j.1464-410X.2012.11369.x. [DOI] [PubMed] [Google Scholar]
- 12.Galli R, Sablinskas V, Dasevicius D, Laurinavicius A, Jankevicius F, Koch E, et al. Non-linear optical microscopy of kidney tumours. J Biophotonics. 2014;7:23–7. doi: 10.1002/jbio.201200216. [DOI] [PubMed] [Google Scholar]
- 13.Jain M, Shukla N, Manzoor M, Nadolny S, Mukherjee S. Modified full-field optical coherence tomography: A novel tool for rapid histology of tissues. J Pathol Inform. 2011;2:28. doi: 10.4103/2153-3539.82053. [DOI] [PMC free article] [PubMed] [Google Scholar]
- 14.Jain M, Narula N, Salamoon B, Shevchuk MM, Aggarwal A, Altorki N, et al. Full-field optical coherence tomography for the analysis of fresh unstained human lobectomy specimens. J Pathol Inform. 2013;4:26. doi: 10.4103/2153-3539.119004. [DOI] [PMC free article] [PubMed] [Google Scholar]
- 15.Ramasamy R, Sterling J, Manzoor M, Salamoon B, Jain M, Fisher E, et al. Full field optical coherence tomography can identify spermatogenesis in a rodent sertoli-cell only model. J Pathol Inform. 2012;3:4. doi: 10.4103/2153-3539.93401. [DOI] [PMC free article] [PubMed] [Google Scholar]
- 16.Wang J, Léger JF, Binding J, Boccara AC, Gigan S, Bourdieu L. Measuring aberrations in the rat brain by coherence-gated wavefront sensing using a Linnik interferometer. Biomed Opt Express. 2012;3:2510–25. doi: 10.1364/BOE.3.002510. [DOI] [PMC free article] [PubMed] [Google Scholar]
- 17.Dubois A, Vabre L, Boccara AC, Beaurepaire E. High-resolution full-field optical coherence tomography with a Linnik microscope. Appl Opt. 2002;41:805–12. doi: 10.1364/ao.41.000805. [DOI] [PubMed] [Google Scholar]
- 18.Dubois A, Grieve K, Moneron G, Lecaque R, Vabre L, Boccara C. Ultrahigh-resolution full-field optical coherence tomography. Appl Opt. 2004;43:2874–83. doi: 10.1364/ao.43.002874. [DOI] [PubMed] [Google Scholar]
- 19.Dubois A, Boccara C. Full-field OCT. Med Sci (Paris) 2006;22:859–64. doi: 10.1051/medsci/20062210859. [DOI] [PubMed] [Google Scholar]
- 20.Srigley JR, Delahunt B, Eble JN, Egevad L, Epstein JI, Grignon D, et al. The international society of urological pathology (ISUP) vancouver classification of renal neoplasia. Am J Surg Pathol. 2013;37:1469–89. doi: 10.1097/PAS.0b013e318299f2d1. [DOI] [PubMed] [Google Scholar]
- 21.Nadasdy N, SF . Nonneoplastic adult renal disease. In: Sternberg SS, editor. Diagnostic surgical pathology. 3rd ed. Philadelphia: Lippincott Williams and Wilkins; 1999. pp. 1701–84. [Google Scholar]
- 22.Hattori H. False glomerulus in renal biopsy specimen: A possible pitfall under the dissecting microscope. J Clin Pathol. 2004;57:336. doi: 10.1136/jcp.2003.014332. [DOI] [PMC free article] [PubMed] [Google Scholar]


