

Significance
Tropical forests store nearly 30% of global terrestrial carbon and contribute to 40% of the global terrestrial carbon sink. By affecting tree growth and survival, lianas impact the carbon balance of these forests. Here we demonstrate with a 3-y experiment that lianas substantially reduce forest-level carbon uptake and storage. This study is, to our knowledge, the first direct demonstration of liana effects at the ecosystem scale and illustrates the important role of lianas in tropical forests, particularly with respect to carbon budgets. Lianas are increasing in biomass and productivity throughout the tropics, and thus our findings have even greater relevance in terms of the fate of the tropical carbon balance, as well as for global atmospheric CO2 levels, in a changing climate.
Keywords: lianas, tropical forests, carbon sequestration, carbon storage, carbon balance
Abstract
Tropical forests store vast quantities of carbon, account for one-third of the carbon fixed by photosynthesis, and are a major sink in the global carbon cycle. Recent evidence suggests that competition between lianas (woody vines) and trees may reduce forest-wide carbon uptake; however, estimates of the impact of lianas on carbon dynamics of tropical forests are crucially lacking. Here we used a large-scale liana removal experiment and found that, at 3 y after liana removal, lianas reduced net above-ground carbon uptake (growth and recruitment minus mortality) by ∼76% per year, mostly by reducing tree growth. The loss of carbon uptake due to liana-induced mortality was four times greater in the control plots in which lianas were present, but high variation among plots prevented a significant difference among the treatments. Lianas altered how aboveground carbon was stored. In forests where lianas were present, the partitioning of forest aboveground net primary production was dominated by leaves (53.2%, compared with 39.2% in liana-free forests) at the expense of woody stems (from 28.9%, compared with 43.9%), resulting in a more rapid return of fixed carbon to the atmosphere. After 3 y of experimental liana removal, our results clearly demonstrate large differences in carbon cycling between forests with and without lianas. Combined with the recently reported increases in liana abundance, these results indicate that lianas are an important and increasing agent of change in the carbon dynamics of tropical forests.
Lianas (woody vines) are a key component of lowland tropical forests, commonly contributing more than 25% of the woody stems and species and competing intensely with trees. By relying on the structural investment of trees for support, lianas are able to allocate a higher proportion of biomass than trees into the production of foliage rather than carbon-dense stems (1). Thus, lianas themselves contribute relatively little to forest-level biomass (1, 2). The ecological effects of lianas may be more extensive than their relatively modest contribution to biomass suggests, however. Liana–tree competition can be far more intense than tree–tree competition (3), substantially reducing tree growth (2, 4), fecundity (5, 6), and survival (4, 7). Furthermore, lianas may constrain net above-ground forest primary productivity, i.e., the total amount of carbon fixed into both canopy material (leaves, flowers, fruits, and seeds) and woody stems (8), by failing to compensate for the biomass that they displace in trees (1, 2).
Recent evidence indicates that lianas are now increasing in abundance and biomass in tropical forests, possibly being driven by a combination of increased atmospheric CO2 concentration, changing climatic conditions, and seasonal droughts, as well as increased natural and anthropogenic disturbances (9, 10). The increase in lianas, combined with the observations that lianas can reduce individual tree growth by up to 84% (11) and increase tree mortality risk twofold to threefold (4, 7), has made it pertinent to investigate the effect of lianas on forest-level biomass dynamics to better predict the effect of increasing liana abundance on tropical forests.
To date, only a few studies have attempted to assess the impact of lianas on tropical forest biomass dynamics (1, 2, 11, 12). These studies indicated that the presence of lianas can reduce stand-level biomass growth by ∼10% (11) and net forest biomass accumulation by up to 18% (2), and that forest carbon stocks decrease with increasing liana abundance (12); however, these studies focused primarily on tree growth alone (11), were restricted to forest treefall gaps (2), or were purely observational (1, 12). Thus, the impacts of lianas on forest-level carbon dynamics remain poorly understood. Nonetheless, these initial studies indicate that increasing liana abundance may alter the carbon balance and cycle of tropical forests by reducing forest-level carbon storage and sequestration. Tropical forests store and sequester vast amounts of carbon and currently contribute ∼40% of the terrestrial carbon sink (13–15); therefore, the increase in liana abundance and biomass may have profound implications for the future of tropical forest carbon balance (1, 2, 11, 12) and hence for global climate change.
Here we present results from a large-scale liana removal experiment conducted in the Barro Colorado Nature Monument (BCNM) in the Republic of Panama. The aim of this study was to simulate a forest that is essentially liana-free to assess the forest-level impacts of lianas on aboveground net primary productivity and carbon balance compared with unmanipulated control plots in which lianas were present. The experimental design consisted of sixteen 80 × 80 m (0.64 ha) plots located within the ∼60-y-old secondary forest area of Gigante Peninsula of the BCNM. In eight plots, we cut all lianas at the base, leaving the remaining eight plots as unmanipulated controls. In each plot, we collected litterfall monthly and measured the diameters of all trees ≥10 cm in diameter and lianas ≥ 5 cm (in the control plots) biannually for 3 y in the central 60 × 60 m area. We applied allometric equations to convert tree and liana diameters to woody biomass and carbon (16–18). Net biomass change for each year of the experiment was defined as the difference between the standing woody biomass at the end of the year and the beginning of the year. We derived aboveground biomass (AGB) increment based on growth (i.e., growth of surviving trees and/or lianas) and recruitment (i.e., lianas and/or trees that reached a diameter of ≥5 cm and ≥10 cm, respectively), as well as AGB loss based on mortality (i.e., lianas and/or trees that died) for each year of the experiment. Aboveground woody stem productivity was defined as the sum of growth and recruitment of trees and/or lianas, and canopy productivity was defined as the total amount of litterfall in each year of the experiment. All biomass measures are reported in units of carbon (Mg C ha−1 or Mg C ha−1 y−1), with the 95% bootstrap confidence interval (CI) as the uncertainty measure (Materials and Methods).
Results and Discussion
Lianas reduced median forest-level net biomass accumulation by 76% (95% bootstrap CI, 55.1–93.8%), which is equivalent to 2.43 Mg C ha−1 y−1 (95% bootstrap CI, 0.55–4.68). By year 3 of the experiment, forests with lianas accumulated 0.41 Mg C ha−1 y−1 (95% bootstrap CI, −1.71 to 2.16), whereas the liana-free plots accrued 2.93 Mg C ha−1 y−1 (95% bootstrap CI, 2.14–3.34) (Fig. 1A and SI Appendix 1). The reduction in carbon in the presence of lianas was attributable primarily to both lower tree biomass growth (Fig. 1B) and increased tree mortality (Fig. 1D), which explained 48.0% (95% bootstrap CI, 13.8–205.8%) and 41.7% (95% bootstrap CI, −145.8 to 80.7%), respectively (SI Appendix 1). The loss of biomass from mortality in the liana-free forests was lowest in year 3, when it was 75% lower than in control plots; however, due to the large variation in mortality among plots, differences among treatments were not significant. Nonetheless, over a longer time period, we would more completely capture the liana-induced effects on tree mortality. Tree recruitment explained an additional 10.3% (95% bootstrap CI, 0.2–52.9%) of the liana-induced reduction in net carbon uptake (Fig. 1C).
Fig. 1.

Bar plots denoting median and 95% bootstrap CI of net change in biomass (A), biomass growth (B), biomass recruitment (C), and biomass mortality (D) of trees plus lianas (Mg C ha−1 y−1) in the control plots (n = 8, white bars) and trees only in the removal plots (n = 8, dark- gray bars) for each of the 3 y of the experiment. *0.10 > P > 0.05; **P ≤ 0.05.
Because biomass dynamics of lianas are included in the whole-forest estimates, our findings corroborate earlier research indicating that lianas themselves do not compensate for the loss in tree biomass that they cause (1, 2, 11). Per unit of biomass, lianas have a much stronger competitive effect on trees compared with other trees (3), and our findings appear to represent the unique effect of lianas on forest carbon dynamics and not merely the effect of biomass removal. This point is confirmed by our inclusion of lianas in the biomass calculations in the control plots. Biomass accumulation of trees growing without lianas was 76.0% (95% bootstrap CI, 55.1–93.8%) greater than the sum of biomass accumulation of lianas and trees in the control plots. The overall impact of lianas on the carbon balance of these forests is considerably greater than that suggested in previous studies (1, 2, 11), which may be due to our comprehensive experimental approach rather than an observational one (11), and our focus on forest-level carbon dynamics rather than on treefall gaps alone (2).
Lianas substantially augmented forest-level leaf productivity and changed the relative amounts of carbon stored in leaves and wood. Forests canopy productivity decreased by 14.0% (95% bootstrap CI, 5.8–22.8%) when lianas were removed (Fig. 2A), primarily due to the decrease in leaf productivity (SI Appendix 2). The difference in leaf productivity between the removal and control plots remained relatively constant over time (∼10–15% difference), indicating that the lower leaf productivity was not the result of tree canopies still recovering from previous liana infestation. Conversely, forest-level woody stem productivity increased by 64.5% (95% bootstrap CI, 18.4–120.6%) after liana removal (Fig. 2B), more than completely offsetting the lower canopy productivity (Fig. 2C). Thus, by increasing the contribution of leaf productivity to aboveground net primary productivity from 39.2% (95% bootstrap CI, 34.6–44.2%) to 53.2% (95% bootstrap CI, 46.8–61.1%) and reducing that of woody stem productivity from 43.8% (95% bootstrap CI, 40.4–47.6%) to 28.9% (95% bootstrap CI, 23.2–34.1%), the presence of lianas shifts the relative carbon investment of forests from the production of plant materials with a long carbon residence time (i.e., decades for wood) (19) to the production of plant materials with much shorter carbon residence times (i.e., <1 y for leaves) (20). Therefore, lianas both reduce the total amount of carbon fixed in tropical forests and shift the carbon that is fixed into aboveground plant material with a shorter life span, resulting in a more rapid release of carbon back to the atmosphere.
Fig. 2.
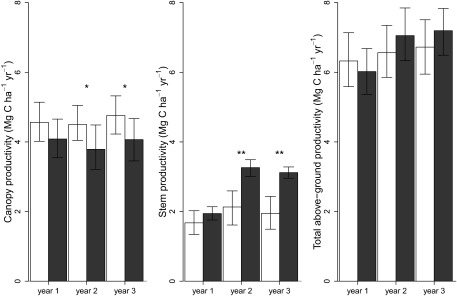
Bar plots denoting median and 95% bootstrap CI of canopy (excluding twigs; Materials and Methods), stem, and total aboveground productivity (Mg ha−1 y−1) of the control plots (n = 8, white bars) and removal plots (n = 8, dark bars) for each of the 3 y of the experiment. *0.10 > P > 0.05; **P ≤ 0.05.
We extrapolated our findings to investigate the potential effects of lianas on the long-term carbon storage capacity of tropical forests. We simulated the change in biomass stocks over the next 50 y for both liana-free forests and control forests with lianas present using a simple exponential model that constrained biomass stocks for the control plots based on the known values of 100-y-old and old-growth forests on nearby Barro Colorado Island, Panama (21). We used the measured net biomass accumulation from year 3 of our experiment as the initial net biomass accumulation rate for both treatments (SI Appendix 3). The simulation showed that lianas have the capacity to reduce the long-term biomass carbon storage capacity in these forests by ∼51.3 Mg C ha−1, which is equivalent to an ∼35% liana-induced reduction in long-term biomass carbon storage. Potential liana-induced shifts in tree species composition and increasing liana biomass over time are not included in this simulation.
Long-term biomass carbon storage may be further reduced if increasing liana biomass intensifies liana-tree competition and/or increases the proportion of trees that are competing with lianas. Likewise, a potential liana-driven shift in tree species composition also may alter long-term biomass carbon storage if the presence of lianas leads to an increase in fast-growing trees with low wood densities, as is predicted (11, 22). Nevertheless, our simulation provides an initial conservative estimate of the potential long-term effect of lianas on forest-level carbon stocks. Long-term experimental data are needed to validate these predictions.
In summary, using an experimental approach, we have shown that lianas greatly reduce net carbon uptake and storage in this forest by reducing tree growth and recruitment, increasing tree mortality, and shifting forest-level carbon allocation to leaves rather than woody tissue. In the presence of lianas, these forests act as carbon sinks, but, based on our results, they reach only ∼24% of their carbon sink potential compared with liana-free forests. Longer-term data are needed to assess whether this initial difference in carbon sink potential persists over time. Notwithstanding, our results indicate that, due to their unique attributes, lianas have the potential to severely reduce both the carbon sink potential and the long-term carbon storage capacity of tropical forests. Whereas the strength of the liana effect will vary with the density and biomass of lianas, the increases in liana density, biomass, and productivity reported in many neotropical forests (9, 10, 23) may be partially responsible for the long-term decline in the Amazonian carbon sink (24), which in turn contributes to increasing atmospheric CO2 levels and accelerated climate change.
Materials and Methods
Site Description and Treatment Design.
The liana removal experiment was carried out at Gigante Peninsula in Panama, which is located on the mainland within the BCNM and adjacent to Barro Colorado Island. Gigante Peninsula is covered by a mix of early and late secondary seasonally moist lowland forest. Annual rainfall is 2,600 mm, with a distinct 4-mo dry season from December to April during which rainfall rarely exceeds 100 mm/mo (25).
In 2008, sixteen 80 × 80 m (0.64 ha) plots were located in floristically and structurally similar areas within the ∼60-y-old forest area of Gigante Peninsula. In the central 60 × 60 m area in each plot, all lianas and trees ≥1 cm were measured in 2008 and then a second time in 2011, immediately before liana removal. Aboveground tree carbon stocks in these 16 plots averaged 75.1 Mg C ha−1, which is representative of other ∼60-y-old forests in the neotropics (26, 27). The forests in Gigante contained only 36.4–81.2% of the carbon measured in old-growth forests in Amazonia (13). Almost all (86%) trees ≥10 cm diameter at breast height (DBH; diameter at 1.3 m above the forest floor or above buttresses) in the plots carried lianas in the crown, exceeding the liana infestation rate of 73.6% in old-growth forests on Barro Colorado Island (4) and 52.6% in old-growth forests in Tambopata, Peru (28), but similar to that in the seasonally deciduous old-growth forests of Bolivia (29). Plots similar in liana biomass and tree structure were paired for the purpose of randomly assigning treatments (either liana removal or unmanipulated control). Before liana removal, the control and removal plots were statistically indistinguishable in terms of liana biomass and liana infestation rate (SI Appendix 4).
In March 2011, all lianas were removed from eight of the plots, leaving eight unmanipulated control plots. Lianas were cut near the forest floor using machetes and were not removed from the trees to avoid damaging tree crowns. Liana debris was left in the plots to decompose. The removal plots were kept liana-free by cutting all resprouting lianas monthly for the first 2 mo and bimonthly for the next 6 mo, after which lianas were not resprouting vigorously, and plots were subsequently monitored and resprouting liana stems cut every 3–4 mo. Control plots were visited at the same frequency and intensity as the liana removal plots, to avoid a visitation effect (30, 31).
Biomass Growth, Recruitment, and Mortality and Stem Productivity.
For all dicotyledonous trees ≥10 cm DBH in both the removal and the control plots, we installed dendrometer bands above 10 cm DBH (or above deformations when necessary) at 4 mo before liana removal. Diameter increment was monitored twice yearly at the beginning of the wet and dry seasons using electronic calipers. Tree stem diameter and diameter growth in subsequent censuses were calculated based on these measurements while correcting for stem curvature.
The tree diameter measurements were converted to AGB for each census using a regression equation appropriate for tropical moist forests (16). Tree height was inferred from diameter using a height–diameter Weibull equation based on data collected at Gigante Peninsula (SI Appendix 5). Locally measured wood density values were available for the majority of tree species occurring in our plots (32). Wood density values were assigned to each stem using this database (98% of stems), or using the Global Wood Density Database (33, 34), following the method of Lewis et al. (35) when species-specific wood density data were not available. Only 0.3% of the stems were not represented in either database; for those exceptional species, a site-based average wood density of 0.62 g m−3 was used. The diameters of all lianas ≥5 cm in the control plots were measured at the beginning of the wet and dry seasons using appropriate liana census techniques (36, 37). Diameter data were converted into AGB using a liana-specific allometric (17).
We computed woody biomass change of a given plot per year as the difference between total AGB (both lianas and trees) at the end of the year and that at the beginning of the year. We calculated woody biomass growth as the difference in AGB between the years for stems that were alive both at the beginning and the end of the year. We calculated woody biomass recruitment for each year by summing the biomass of the new stems that reached the diameter thresholds (10 cm for trees and 5 cm for lianas) by the end of the year. We calculated woody biomass mortality for each year by summing the biomass of all dead stems of the year before mortality occurred. Total woody stem productivity was calculated as the sum of biomass growth and biomass recruitment. Due to the short census periods (∼4 mo for the dry season and ∼8 mo for the wet season), we assumed that we measured all recruitment and mortality events, and thus did not correct our stem productivity estimates for lianas or trees that might have recruited and subsequently died unobserved within a census period (38). To convert biomass estimates from Mg dry mass to Mg C, we used species-specific wood carbon fraction values for 27% of the tree stems, and an average wood carbon fraction of 47.35% for the remainder of the trees and for the lianas (18).
Our main goal was to test for differences in aboveground net primary productivity, woody biomass growth, recruitment, and mortality between the two treatments, not to precisely quantify these processes at the forest level, we therefore did not include palms in any of calculations for two reasons. First, mature palms tend to grow apically rather than in diameter (39), precluding growth estimation based on changes in diameter and height measurements were not available. Second, palms tend to have less liana infestation than trees (28), and thus are expected to show less response to liana removal. Palm biomass was similar in the control and removal plots (0.87 ± 0.20 Mg C ha−1 and 0.76 ± 0.10 Mg C ha−1, respectively), as estimated by the family-level allometric equation using diameter at breast height only (40), and thus it is unlikely that the exclusion of palms affected our overall results.
Canopy Productivity.
In each plot, we deployed five 0.75 m × 0.75 m litterfall traps with 1-mm mesh 0.75–1 m above the ground. Litter traps were spaced at least 5 m apart and were arranged in a pattern consistent among plots. Litterfall was collected monthly starting in the second month after liana cutting, thus excluding the initial pulse of dead leaves from the liana cutting. Leaves were dried at ∼65 °C, sorted into different components in an air-conditioned laboratory, and then weighed. The fractions included leaves plus petioles, flowers, fruits plus seeds, twigs (<5 cm diameter), and unidentified fine debris. In the control plots, we combined tree and liana litter to account for canopy-level productivity in a manner similar to the liana removal plots.
To convert litter biomass into carbon estimates, we assumed a litterfall carbon fraction of 47.1%, which was based on ∼1,000 leaf samples from across the Amazon (41). We did not attempt to correct the litterfall measurements for losses due to herbivory, branch falls, and biogenic organic compounds, and we did not account for palm litter. For both treatments, we assumed that the flux of carbon into canopy productivity equalled the flux of carbon out of it; i.e., the amount of aboveground net primary productivity allocated annually to the canopy should be equal to the litterfall. However, as a result of the liana cutting itself, litterfall in the liana removal plots was initially higher, owing to increased litter of dead liana twigs (SI Appendix 2), which violated the aforementioned assumption for the first 1.5 y of the experiment. Nonetheless, twig litterfall in the liana removal plots decreased to levels similar to that in the control plots ∼1.5 y after liana cutting, and thus including twig litterfall in total canopy productivity estimates in year 3 did not change the patterns found (SI Appendix 2). To facilitate comparisons between all years of the experiment, we present estimates of canopy productivity excluding the twig component for both the liana removal plots and the control plots.
Statistical Analysis.
We quantified the differences in aboveground net primary productivity and biomass dynamics between liana-free forests (removal) and those in which lianas were present (control). We accounted for the uncertainty in the diameter, dendrometer, and litterfall measurements in obtaining the different biomass metrics (i.e., growth, mortality, recruitment, net change, and aboveground net primary production) by calculating bootstrapped CIs using a Monte Carlo bootstrap approach (42, 43). The initial diameter of each tree and the diameter of lianas in each census in each plot were varied at random using a normal distribution with a SE of 5% (42). In subsequent censuses, tree diameters were calculated by adding a randomly selected value of dendrometer growth from a normal distribution with an SE of 3% (44) to the initial tree diameter. The resulting diameters for each census were then used to calculate tree height and subsequently biomass for each tree and each plot. We used a similar method for canopy productivity estimates, but with productivity values for each litterfall category for each plot and each census drawn at random from a normal distribution using the mean and standard variation based on the data from the five litterfall traps.
We used this approach to calculate 1,000 realizations of the biomass metrics for all 16 plots, and then used an additional bootstrap approach using 1,000 iterations to calculate the mean of the biomass metrics per treatment and per census and the difference in means between the treatments for the relevant biomass metric for each of those realizations. This resulted in 1,000,000 iterations of the mean for each metric for each treatment, which were then used to calculate the median, upper, and lower boundaries of the 95% CI as the 50th, 97.5th, and 2.5th percentiles, respectively. Differences in biomass or productivity estimates between the removal and control treatments were considered significant when the CI of the difference did not include zero. All biomass and productivity estimates were converted into Mg C ha−1 y−1. All analyses were carried out in R 3.1.2 (45). The diameter and biomass data for all liana and tree stems and the litterfall measurements are available in the Dryad Data Repository (dx.doi.org/10.5061/dryad.83gt9). The R-scripts used to calculate the median biomass variables and mean stem, canopy, and total net primary productivity for each treatment are provided in SI Appendix 6.
Supplementary Material
Acknowledgments
We thank Scott Mangan and Mike Tobin for their help in establishing the plots, and Oldemar Valdez, Evelyn Sanchez, Boris Bernal, Abelino Valdez, Severino Valdez, Salome Perez, and Guadelupe Alvaro for their contributions to the plant censuses and data management and entry. We also thank Bruce Carlisle, Lindsay Banin, Rachael Gallagher, and two anonymous reviewers for their comments on an earlier version of the manuscript. This work was supported by the National Science Foundation (Grants DEB-0845071 and DEB 1019436, to S.A.S., and DEB-1019441, to J.S.P.), and the University of Wisconsin-Milwaukee (a Research Growth Initiative grant, to S.A.S.).
Footnotes
The authors declare no conflict of interest.
This article is a PNAS Direct Submission.
Data deposition: The data have been deposited in the Dryad Data Repository (www.datadryad.org), dx.doi.org/10.5061/dryad.83gt9.
This article contains supporting information online at www.pnas.org/lookup/suppl/doi:10.1073/pnas.1504869112/-/DCSupplemental.
References
- 1.van der Heijden GMF, Schnitzer SA, Powers JS, Phillips OL. Liana impacts on carbon cycling, storage, and sequestration in tropical forests. Biotropica. 2013;45:682–692. [Google Scholar]
- 2.Schnitzer SA, van der Heijden GMF, Mascaro J, Carson WP. Lianas in gaps reduce carbon accumulation in a tropical forest. Ecology. 2014;95:3008–3017. [Google Scholar]
- 3.Tobin M, Wright A, Mangan S, Schnitzer SA. Lianas have a greater competitive effect than trees of similar biomass on tropical canopy trees. Ecosphere. 2012;3:1–11. [Google Scholar]
- 4.Ingwell LL, Wright SJ, Becklund KK, Hubbell SP, Schnitzer SA. The impact of lianas on 10 years of tree growth and mortality on Barro Colorado Island, Panama. J Ecol. 2010;98:879–887. [Google Scholar]
- 5.Kainer KA, Wadt LHO, Gomes-Silva DAP, Capanu M. Liana loads and their association with Bertholletia excelsa fruit and nut production, diameter growth and crown attributes. J Trop Ecol. 2006;22:147–154. [Google Scholar]
- 6.Nabe-Nielsen J, Kollmann J, Peña-Claros M. Effects of liana load, tree diameter and distances between conspecifics on seed production in tropical timber trees. For Ecol Manage. 2009;257:987–993. [Google Scholar]
- 7.Phillips OL, Vásquez Martínez R, Monteagudo Mendoza A, Baker TR, Núñez Vargas P. Large lianas as hyperdynamic elements of the tropical forest canopy. Ecology. 2005;86:1250–1258. [Google Scholar]
- 8.Malhi Y. The productivity, metabolism and carbon cycle of tropical forest vegetation. J Ecol. 2012;100:65–75. [Google Scholar]
- 9.Phillips OL, et al. Increasing dominance of large lianas in Amazonian forests. Nature. 2002;418(6899):770–774. doi: 10.1038/nature00926. [DOI] [PubMed] [Google Scholar]
- 10.Schnitzer SA, Bongers F. Increasing liana abundance and biomass in tropical forests: Emerging patterns and putative mechanisms. Ecol Lett. 2011;14(4):397–406. doi: 10.1111/j.1461-0248.2011.01590.x. [DOI] [PubMed] [Google Scholar]
- 11.van der Heijden GMF, Phillips OL. Liana infestation impacts tree growth in a lowland tropical moist forest. Biogeosciences. 2009;6:2217–2226. [Google Scholar]
- 12.Durán SM, Gianoli E. Carbon stocks in tropical forests decrease with liana density. Biol Lett. 2013;9(4):20130301. doi: 10.1098/rsbl.2013.0301. [DOI] [PMC free article] [PubMed] [Google Scholar]
- 13.Feldpausch TR, et al. Tree height integrated into pantropical forest biomass estimates. Biogeosciences. 2002;9:3381–3403. [Google Scholar]
- 14.Zhao M, Running SW. Drought-induced reduction in global terrestrial net primary production from 2000 through 2009. Science. 2010;329(5994):940–943. doi: 10.1126/science.1192666. [DOI] [PubMed] [Google Scholar]
- 15.Pan Y, et al. A large and persistent carbon sink in the world’s forests. Science. 2011;333(6045):988–993. doi: 10.1126/science.1201609. [DOI] [PubMed] [Google Scholar]
- 16.Chave J, et al. Tree allometry and improved estimation of carbon stocks and balance in tropical forests. Oecologia. 2005;145(1):87–99. doi: 10.1007/s00442-005-0100-x. [DOI] [PubMed] [Google Scholar]
- 17.Schnitzer SA, et al. Censusing and measuring lianas: A quantitative comparison of the common methods. Biotropica. 2006;38:581–591. [Google Scholar]
- 18.Martin AR, Thomas SC. A reassessment of carbon content in tropical trees. PLoS One. 2011;6(8):e23533. doi: 10.1371/journal.pone.0023533. [DOI] [PMC free article] [PubMed] [Google Scholar]
- 19.Galbraith D, et al. Residence times of woody biomass in tropical forests. Plant Ecol Divers. 2013;6:139–157. [Google Scholar]
- 20.Powers JS, et al. Decomposition in tropical forests: A pan-tropical study of the effects of litter type, litter placement and mesofaunal exclusion across a precipitation gradient. J Ecol. 2009;97:801–811. [Google Scholar]
- 21.Mascaro J, et al. Controls over aboveground forest carbon density on Barro Colorado Island, Panama. Biogeosciences. 2011;8:1615–1629. [Google Scholar]
- 22.Schnitzer SA, Carson W. 2010. Lianas suppress tree regeneration and diversity in treefall gaps. Ecol Lett 13:849–857.
- 23.Wright SJ, Calderón O, Hernandéz A, Paton S. Are lianas increasing in importance in tropical forests? A 17-year record from Panama. Ecology. 2004;85:484–489. [Google Scholar]
- 24.Brienen RJW, et al. Long-term decline of the Amazon carbon sink. Nature. 2015;519(7543):344–348. doi: 10.1038/nature14283. [DOI] [PubMed] [Google Scholar]
- 25.Leigh EG. Tropical Forest Ecology : A View from Barro Colorado Island. Oxford Univ Press; New York: 1999. [Google Scholar]
- 26.Saldarriaga JG, West DC, Tharp ML, Uhl C. Long-term chronosequence of forest succession in the Upper Rio Negro of Colombia and Venezuela. J Ecol. 1988;76:938–958. [Google Scholar]
- 27.Marin-Spiotta E, Ostertag R, Silver WL. 2007. Long-term patterns in tropical reforestation: Plant community composition and aboveground biomass accumulation. Ecol Appl 17:828–839. [DOI] [PubMed]
- 28.van der Heijden GMF, Healey J, Phillips OL. Infestation of trees by lianas in a tropical forest in Amazonian Peru. J Veg Sci. 2008;19:747–756. [Google Scholar]
- 29.Perez-Salicrup D, Sork V, Putz FE. Lianas and trees in a liana forest of Amazonian Bolivia. Biotropica. 2001;33:34–47. [Google Scholar]
- 30.Cahill JF, Castelli JP, Casper BB. The herbivory uncertainty principle: Visiting plants can alter herbivory. Ecology. 2001;82:307–312. [Google Scholar]
- 31.Schnitzer SA, Reich PB, Bergner B, Carson WP. Herbivore and pathogen damage on grassland and woodland plants: A test of the herbivore uncertainty principle. Ecol Lett. 2002;5:531–539. [Google Scholar]
- 32.Wright SJ, et al. Functional traits and the growth-mortality trade-off in tropical trees. Ecology. 2010;91(12):3664–3674. doi: 10.1890/09-2335.1. [DOI] [PubMed] [Google Scholar]
- 33.Chave J, et al. Towards a worldwide wood economics spectrum. Ecol Lett. 2009;12(4):351–366. doi: 10.1111/j.1461-0248.2009.01285.x. [DOI] [PubMed] [Google Scholar]
- 34.Zanne AE, et al. 2009 Data from: Towards a worldwide wood economics spectrum. Dryad Digital Repository. Available at: dx.doi.org/10.5061/dryad.234/1. Accessed September, 2014.
- 35.Lewis SL, et al. Increasing carbon storage in intact African tropical forests. Nature. 2009;457(7232):1003–1006. doi: 10.1038/nature07771. [DOI] [PubMed] [Google Scholar]
- 36.Gerwing JJ, et al. A standard protocol for liana censuses. Biotropica. 2006;38:256–261. [Google Scholar]
- 37.Schnitzer SA, Rutishauser S, Aguilar S. Supplemental protocol for liana censuses. For Ecol Manage. 2008;255:1044–1049. [Google Scholar]
- 38.Talbot J, et al. Methods to estimate aboveground wood productivity from long-term forest inventory plots. For Ecol Manage. 2014;320:30–38. [Google Scholar]
- 39.Rich PM, et al. Height and stem diameter relationships for dicotyledonous trees and arborescent palms of Costa Rican tropical wet forest. Bull Torrey Bot Club. 1986;115:241–246. [Google Scholar]
- 40.Goodman RC, et al. Amazon palm biomass and allometry. For Ecol Manage. 2013;310:994–1004. [Google Scholar]
- 41.Fyllas NM, et al. Basin-wide variations in foliar properties of Amazonian forest: Phylogeny, soils and climate. Biogeosciences. 2009;6:2677–2708. [Google Scholar]
- 42.Holdaway RJ, McNeill SJ, Mason NWH, Carswell FE. Propagating uncertainty in plot-based estimates of forest carbon stock and carbon stock change. Ecosystems (N Y) 2014;17:627–640. [Google Scholar]
- 43.Harmon ME, Fasth B, Halpern CB, Lutz JA. Uncertainty analysis: An evaluation metric for synthesis science. Ecosphere. 2015;6:63. [Google Scholar]
- 44.Butt N, Slade E, Thompson J, Malhi Y, Riutta T. Quantifying the sampling error in tree census measurements by volunteers and its effect on carbon stock estimates. Ecol Appl. 2013;23(4):936–943. doi: 10.1890/11-2059.1. [DOI] [PubMed] [Google Scholar]
- 45.R Core Team 2014 R: A language and environment for statistical computing. Available at: www.r-project.org/. Accessed June, 2014.
Associated Data
This section collects any data citations, data availability statements, or supplementary materials included in this article.