Significance
The response of the atmospheric circulation to anthropogenic carbon dioxide changes has consequences for socially important aspects of climate, including rainfall and hurricane development. A substantial body of literature relates circulation weakening to temperature changes; however, it has been recently discovered that there is also a direct weakening of tropical overturning circulations from increased carbon dioxide concentration, which are independent of temperature changes. However, the cause of this direct slowing of the circulation has not been revealed. Here, I introduce a physical mechanism for the direct circulation weakening that accounts for its ubiquity across climate simulations. The previously unidentified mechanism is demonstrated across a hierarchy of atmospheric simulations including those used in the United Nations Intergovernmental Panel on Climate Change.
Keywords: climate change, tropical circulation, radiative forcing
Abstract
Climate models robustly simulate weakened mean circulations of the tropical atmosphere in direct response to increased carbon dioxide (CO2). The direct response to CO2, defined by the response to radiative forcing in the absence of changes in sea surface temperature, affects tropical precipitation and tropical cyclone genesis, and these changes have been tied to the weakening of the mean tropical circulation. The mechanism underlying this direct CO2-forced circulation change has not been elucidated. Here, I demonstrate that this circulation weakening results from spatial structure in CO2’s radiative forcing. In regions of ascending circulation, such as the intertropical convergence zone, the CO2 radiative forcing is reduced, or “masked,” by deep-convective clouds and high humidity; in subsiding regions, such as the subtropics, the CO2 radiative forcing is larger because the atmosphere is drier and deep-convective clouds are infrequent. The spatial structure of the radiative forcing reduces the need for the atmosphere to transport energy. This, in turn, weakens the mass overturning of the tropical circulation. The previously unidentified mechanism is demonstrated in a hierarchy of atmospheric general circulation model simulations with altered radiative transfer to suppress the cloud masking of the radiative forcing. The mechanism depends on the climatological distribution of clouds and humidity, rather than uncertain changes in these quantities. Masked radiative forcing thereby offers an explanation for the robustness of the direct circulation weakening under increased CO2.
Many climate changes, such as the concentration of water vapor in the atmosphere, occur in proportion to the amount of surface temperature change. Changes that occur as a direct response to radiative forcing agents, independent of surface temperature changes, are important in determining the response of global-mean precipitation (1, 2), tropospheric clouds (3, 4), tropical cyclone genesis (5–7), and tropical atmospheric circulation and precipitation (8) to increased concentration. The direct response of the atmosphere to remains under solar radiation management geoengineering schemes because the direct response is not removed even if the surface temperature is returned to that of an unperturbed climate.
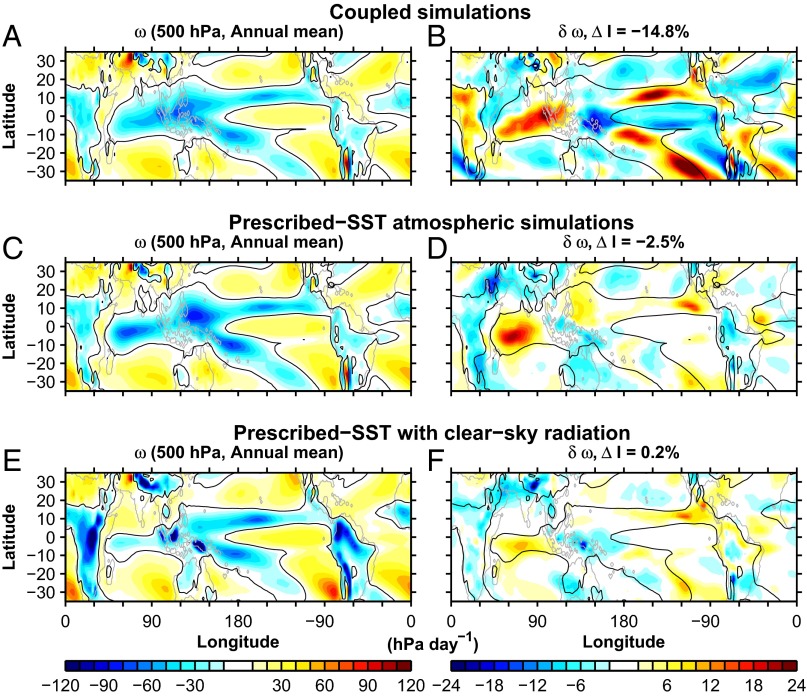
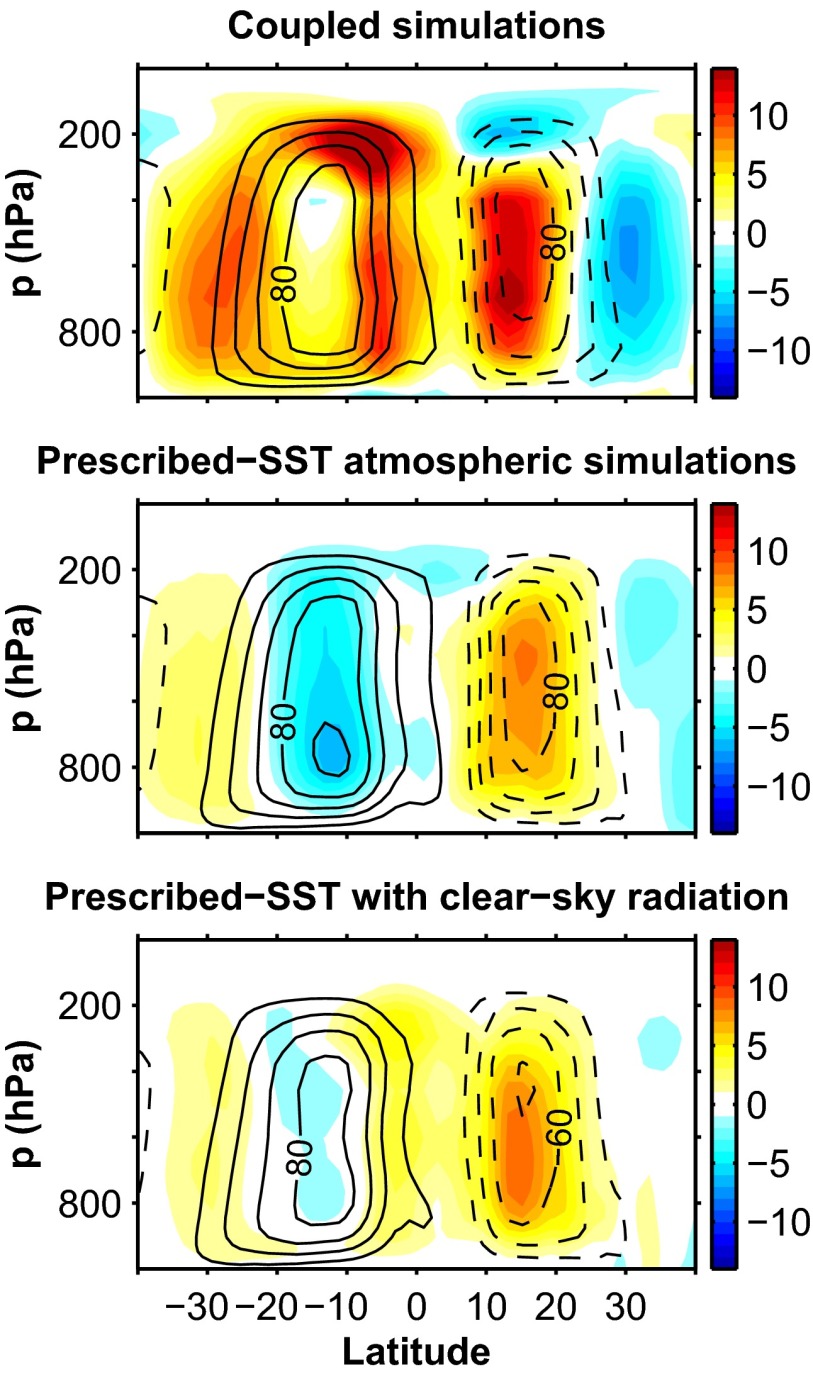
The mean circulation of the tropical atmosphere is projected to weaken in general circulation model (GCM) simulations of future climate change (8, 9). Fig. 1 shows the 100-y pressure velocity response to abruptly quadrupled concentration in a coupled ocean–atmosphere GCM simulation is a ∼15% weakening, whereas a ∼2.5% weakening occurs in corresponding atmospheric GCM simulations with sea surface temperature (SST) held fixed (Fig. 1D). Therefore, about of the century-scale weakening is a direct response to in this GCM, and the spatial distribution of the changes is also similar, apart from the circulation response over tropical land regions (Table S1). The transient land–sea circulation response has been argued to arise from transient increases in near-surface equivalent potential temperature gradients, which are offset in the long-term response as the ocean gradually warms (10). Consistent with the strengthened land–sea circulation, the direct circulation weakening has a larger expression in the zonal-mean Hadley circulation (Fig. S1) than in measures that depend on zonally asymmetric tropical circulations (Table S1). This GCM’s direct response of the annual-mean Hadley circulation is of the same order as the temperature-dependent response, although changes differ between the hemispheres (Fig. S1).
Fig. 1.
An important fraction of the weakening of the tropical circulation in climate change simulations occurs as a direct response to increased concentration in the absence of changes in SST, and this results from masked radiative forcing. (A, C, and E) Annual-mean pressure velocity ω at 500 hPa for preindustrial () simulations and (B, D, and F) the change in pressure velocity at 500 hPa between and simulations for (A and B) a coupled ocean–atmosphere GCM (GFDL’s ESM2M), (C and D) the atmospheric component of the GCM (GFDL’s AM2.1) with prescribed climatological SST and sea ice, and (E and F) the atmospheric component of the GCM with clear-sky radiative transfer (Materials and Methods). The percent change in the tropical circulation strength index (; Materials and Methods) between and simulations is shown in the title (B, D, and F).
Table S1.
Summary of regional circulation changes in comprehensive GCM simulations
| Model | Radiation | Ocean, % | Land, % | Total, % | ||
| ESM2M | Comprehensive | −10.4 | −19.9 | −16.7 | −9.9 | −14.8 |
| AM2.1 | Comprehensive | −9.2 | −0.1 | 20.6 | −15.4 | −2.5 |
| AM2.1 | Clear sky | −5.5 | 0.9 | 4.6 | −7.0 | 0.2 |
The percent change in the time-mean ascending and subsiding vertical velocity at 500-hPa pressure level for land and ocean regions and the tropical-mean circulation index between and simulations. All quantities are annual means evaluated on the 500-hPa pressure level and averaged from to in latitude.
Fig. S1.
Annual-mean Eulerian-mean mass streamfunction for 1 × CO2 (black contours with negative dashed, contour interval 20 × 109 kg⋅s−1) and the change in the Eulerian-mean streamfunction (contour interval 1 × 10⁹ kg⋅s−1) between 4 × CO2 and 1 × CO2 simulations. The rows show simulations that correspond to those in Fig. 1: (Top) a coupled ocean–atmosphere GCM (Geophysical Fluid Dynamical Laboratory's ESM2M), (Middle) the atmospheric component of the GCM (Geophysical Fluid Dynamical Laboratory's AM2.1) with prescribed climatological SST and sea ice, and (Bottom) the atmospheric component of the GCM with clear-sky radiative transfer (Materials and Methods). Positive streamfunction values are counterclockwise circulation, and negative streamfunction values are clockwise circulation.
Although the direct circulation change does not dominate the long-term response in these simulations, recent research has connected temperature-dependent circulation changes to the spatial structure of radiative feedbacks (11–13). As these feedbacks are uncertain, the partition between the long-term response and the direct circulation response is model dependent. The robustness of the direct circulation weakening across climate models (8), together with the dominance of the direct circulation response in determining global tropical cyclone frequency in high-resolution simulations (7), calls for the physical mechanism underlying the direct circulation response to be elucidated.
Previous discussions of the direct- forced weakening of tropical circulations have focused on the dry thermodynamic budget of the atmosphere. Increased warms the upper troposphere more than the lower troposphere in fixed-SST simulations, which increases the dry static stability and tends to weaken the circulation (8). Increased also weakens the radiative cooling in subsiding regions, which tends to reduce the magnitude of subsidence needed for adiabatic warming to balance the radiative cooling (7). A known difficulty with dry thermodynamic arguments for circulation changes is that latent heating is an important component of the budget with regional structure in its response to climate changes, and this structure depends on the circulation (14, 15). Similar difficulties occur if changes in the water vapor budget are invoked to explain local circulation changes (16, 17). Finally, the direct response—as defined by simulations with unchanged SST—precludes arguments for tropical circulation changes based on the SST distribution.
Here, I consider the moist energetics of tropical circulations (18–20). The energy transport by the atmosphere and ocean balances the spatial gradients in the top-of-atmosphere (TOA) net radiation: the radiation surplus in the tropics in the climatology is balanced by energy transport to higher latitudes where there is a radiation deficit (21). The mean circulation of the tropical atmosphere is generally energetically direct (19). Thus, regions of net energy gain by the atmospheric column are regions of climatological ascent, with the circulation exporting energy, and regions of net energy loss by the atmospheric column are regions of climatological subsidence, with the circulation importing energy. Moist energetics directly relate the overturning circulation to the energy sources and sinks of the atmosphere: radiation and turbulent surface fluxes. In contrast to the dry thermodynamic budget, latent heat release does not explicitly affect the energy transport, as it is a conversion from one form of energy to another. The moist energetics constrain the magnitude of circulation energy transport, although the mass transport additionally depends on the efficiency with which the overturning circulation transports energy (18, 20, 22, 23).
The TOA radiative forcing of perturbs the TOA net radiation. The direct change in the overturning mass flux under radiative forcing is then related to the spatial variations of the radiative forcing that induce changes in energy transport (where is the deviation of the forcing from spatially uniform, as a uniform forcing does not change the atmospheric energy transport). Under a scenario, the expectation is that a ∼2 W⋅m−2 spatial variation in forcing (24, 25) opposing the ∼75 W⋅m−2 climatological net radiation variation across tropical latitudes (21) will lead to a ∼3% reduction in the energy and mass transport. This estimate is consistent with the magnitude of the direct weakening in the simulations of the fifth phase of the Coupled Model Intercomparison Project (CMIP5) (8).
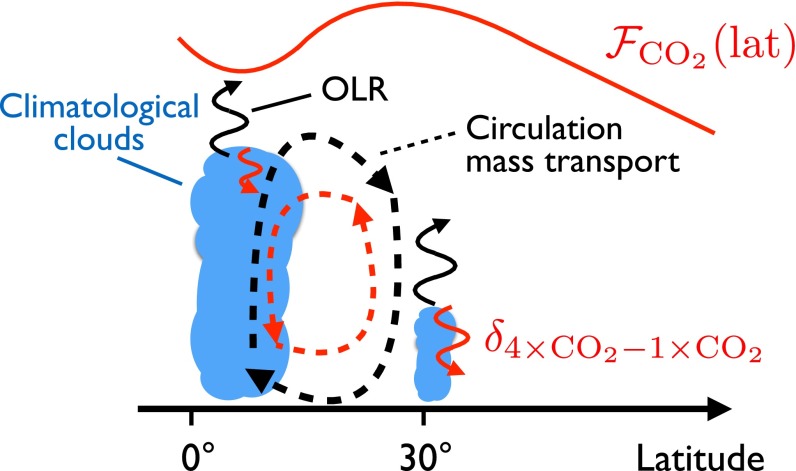
The radiative forcing has spatial structure that arises from (i) the climatological temperature distribution (larger forcing for higher T and greater lapse rate) and (ii) the masking effect of high clouds and water vapor (24, 25). Masking occurs in regions of high clouds and large upper-tropospheric humidity because these are effective long-wave absorbers, so additional absorption below cloud top or below a moist upper troposphere has a limited impact on the outgoing longwave radiation. Shallow clouds are not effective at masking because the cloud top temperature from which they reemit long-wave radiation is close to the surface temperature. For Earth’s climate, the radiative forcing’s spatial structure is manifest on both the planetary scale, over which the mean temperature and its vertical structure varies from equator to pole, and within the tropics, where climatologically moist regions with frequent deep-convective clouds are distinct from climatological dry regions with infrequent deep-convective clouds. This spatial structure of the radiative forcing (red line in Fig. 2) and its connection to the climatological cloud distribution is illustrated in Fig. 2. The spatial structure of the radiative forcing on the planetary scale tends to increase the atmospheric energy transport (26); in isolation, this would increase the tropical circulation energy and mass transport. In contrast, the cloud and water vapor masking within the tropics tends to reduce the atmospheric energy transport; this decreases the tropical circulation’s energy and mass transport (Fig. 2). Because the spatial structure of ’s radiative forcing arises from the connection between the climatological circulation and clouds and humidity, it can act to oppose both the zonally symmetric Hadley circulation and zonally asymmetric circulations like the Walker circulation of the tropical Pacific. The results of GCM simulations and a simple model of the Hadley circulation that remove the masking of the radiative forcing by altering the radiative transfer calculation confirm the importance of this physical mechanism.
Fig. 2.
Schematic of masked radiative forcing mechanism for direct weakening of tropical circulations. The overturning circulation is shown in dashed lines, and the outgoing longwave radiation (OLR) is shown in curved lines, where black lines are climatological values and red lines are anomalies under increased concentration. The climatological clouds (blue) are deep in areas of climatological ascent, such as the intertropical convergence or west Pacific, and are shallow in regions of climatological subsidence, such as the subtropics or equatorial East Pacific. The spatial structure of the climatological cloud and water vapor distribution leads to weaker radiative forcing (top red line) in regions of mean ascent than in regions of mean subsidence. This spatial structure offsets the net radiation gradient at the TOA and implies a reduced need for atmospheric energy transport and mass transport by the mean circulation. The same relationship between the cloud masking of the radiative forcing and overturning circulation can also apply to zonally asymmetric circulations like the Walker circulation.
Results
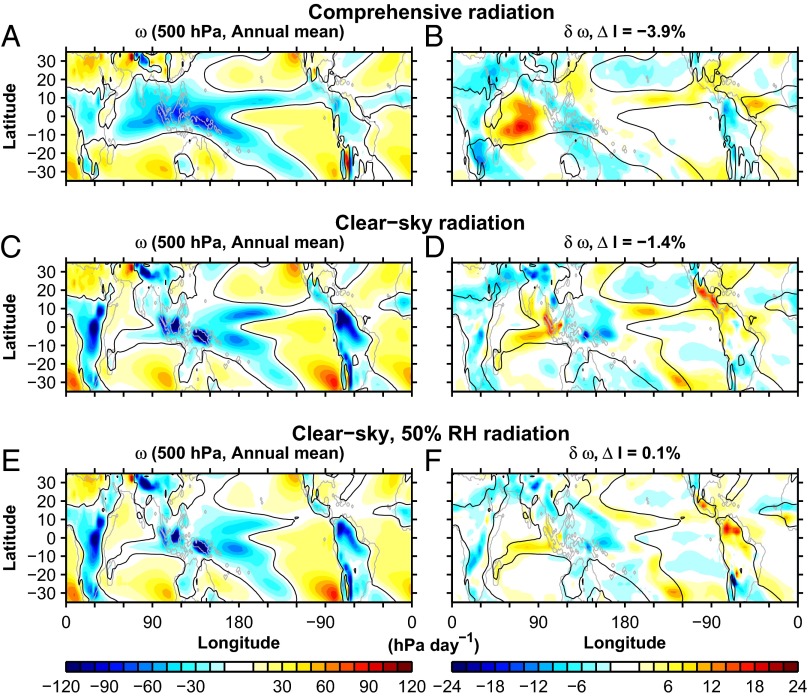
Fig. 1 shows the results of atmospheric GCM simulations in which the dependence of the radiative transfer on clouds is deactivated (bottom row). When the radiative effect of clouds is deactivated in the GCM’s radiative transfer calculation, the climatological circulation is altered (Fig. 1E), as is expected because the radiative energy sources and sinks to the atmospheric column differ (27). Deactivating the radiative effect of clouds reduces the spatial variation in radiative forcing and, although there are regional circulation changes, the tropical-mean circulation weakening is eliminated (Fig. 1F). In simulations with the prescribed SST from observations rather than the coupled GCM, there is a larger direct weakening (∼4%) and deactivating cloud radiative effects reduces the direct circulation weakening to ∼1.5%, with the remainder of the direct weakening associated with water vapor masking (Fig. S2). Thus, both clouds and water vapor can contribute to the spatial structure of the radiative forcing and their climatological distributions (perturbed here through changing the SST distribution) influence the magnitude of the direct response of the circulation to .
Fig. S2.
AM2.1 GCM simulations using the climatological SST over the period 1981–2005 from the Hadley Centre HadISST dataset (32), rather than from the coupled GCM (ESM2M) as shown in Fig. 1 and Fig. S1. (A, C, and E) Annual-mean pressure velocity ω at 500 hPa for 1 × CO2, climatological SST, and sea ice simulations, and (B, D, and F) the change in pressure velocity δω at 500 hPa between 4 × CO2 and 1 × CO2 simulations (unchanged SST and sea ice) for the (A and B) standard radiative transfer, (C and D) the clear-sky radiative transfer calculation, and (E and F) the clear-sky, 50% relative humidity (RH) radiative transfer calculation. This additional simulation type uses radiative transfer calculations that assume clear-sky conditions and 50% RH at all atmospheric levels. The time-dependent, GCM-simulated temperature and pressure fields are used to determine the water vapor distribution. Thus, radiative transfer calculation uses 50% RH in both the ascending and subsiding branches of the tropical circulation. Specifying constant RH for radiative transfer rather than specific humidity has the virtue that the humidity stratification arising from the climatological temperature stratification preserved and regions of unphysical subsaturation or supersaturation are avoided. The percent change in the tropical circulation strength index (ΔI) between 4 × CO2 and 1 × CO2 simulations is shown in the title (B, D, and F).
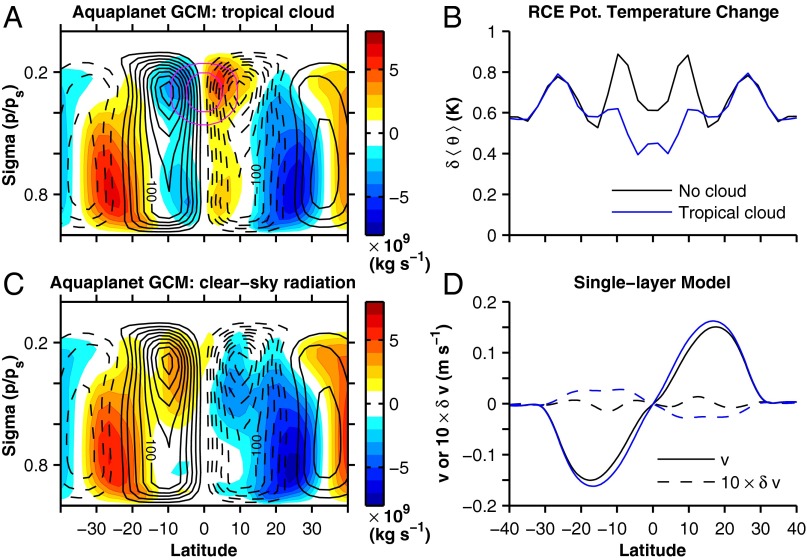
To demonstrate that the masked radiative forcing mechanism operates independent of the surface boundary conditions, idealized aquaplanet GCM simulations are presented. When an upper-tropospheric cloud is prescribed in the deep tropics in the idealized GCM, there is a ∼1.8% weakening of the overturning circulation in the region with the cloud (Fig. 3A). This is consistent with the results of CMIP5 simulations, which feature a direct weakening of the tropical circulation in simulations with both aquaplanet and comprehensive lower boundary conditions (8). With clear-sky radiative transfer, the direct circulation change in the deep tropics is near zero in the lower troposphere and is a strengthening in the upper troposphere (Fig. 3C). In regions away from the prescribed cloud, the circulation change is similar between the two simulations (Fig. 3 A and C).
Fig. 3.
Demonstration of the masked radiative forcing mechanism for direct weakening of tropical circulation in idealized aquaplanet atmospheric GCM simulations and a single-layer model of the Hadley circulation. (A and C) Eulerian-mean mass streamfunction (black contours with negative dashed, contour interval 20 × 109 kg⋅s−1), change in streamfunction between and (colors with contour interval 1 × 10⁹ kg⋅s−1), and cloud fraction (magenta contours of and ) for simulations with (A) prescribed tropical cloud and with (C) clear-sky radiation. Positive streamfunction values are counterclockwise circulation, and negative streamfunction values are clockwise circulation. (B) Vertically integrated potential temperature change between and radiative convective equilibrium (RCE) simulations with a tropical cloud (as in A) and with clear-sky radiation (as in C). (D) Meridional velocity and its changes in a single-layer model of the Hadley circulation driven by the RCE potential temperature shown in B.
As the essence of the mechanism introduced here depends on the radiative effect of climatological clouds and water vapor, I perform radiative convective equilibrium (RCE) simulations using the aquaplanet GCM (Fig. 3B). The vertically integrated RCE potential temperature is then used to drive a theoretical, single-layer model that represents the upper-tropospheric, poleward branch of the Hadley circulation (28). The single-layer model simulations presented here do not include a representation of momentum transport by extratropical eddies; thus, they simulate the classical angular momentum-conserving Hadley circulation (18) where the circulation strength is determined by energy transport requirements. This combination of simplified simulations allows the cloud and water vapor masking mechanism to be demonstrated in a setting where the processes essential to it are included, while some of the complexity of GCMs is removed. When the tropical cloud is prescribed and is quadrupled, there is a relative minimum in the change in RCE potential temperature from the cloud masking of the (Fig. 3B, blue line) and this drives a ∼1.6% weakening of the meridional velocity in the single-layer model (Fig. 3D, blue lines). In contrast, the vertically integrated RCE potential temperature has an approximately uniform increase in the tropics when no cloud is prescribed (Fig. 3B, black line), and there is a concomitantly small change in the meridional velocity in the single-layer model of the Hadley circulation (Fig. 3D, black lines).
Discussion
The direct weakening of tropical circulations in response increased concentration results from cloud and water vapor masking of its radiative forcing. The climatological regions of frequent deep convection, with associated high upper-tropospheric humidity and cloudiness, form the ascending regions of the overturning tropical circulation and have weaker radiative forcing than the subsiding branches of the circulation (Fig. 2). The spatial structure of radiative forcing offsets the climatological gradients in energy sources to the atmosphere (e.g., the meridional solar radiation gradient), which reduces the need for the atmosphere to transport energy. The mass circulation then weakens to achieve the reduction in energy transport.
I demonstrated this previously unidentified mechanism in a hierarchy of GCM simulations. As it depends on the masking associated with the presence of high clouds, the radiative transfer calculation was altered to remove the effect of these on the radiative forcing. When the radiative forcing is made more spatially uniform, the magnitude of the direct weakening of the tropical circulations decreases or can be eliminated entirely (Fig. 1 E and F). This mechanism does not depend on the presence of land–sea contrasts at the surface, and there is consistent behavior across the idealized aquaplanet and comprehensive GCM simulations (Figs. 1 and 3). A theoretical model of the Hadley circulation driven by RCE potential temperature further establishes the mechanism in a minimal framework (Fig. 3).
The fundamental features of the climatological cloud and water vapor distribution and their connection to the mean tropical circulation are present in all comprehensive climate models; together with the well-known physics of radiative transfer, the mechanism exposes the reason that the direct circulation weakening is robustly simulated—it does not depend on uncertain aspects of climate models. This mechanism is complementary to and distinct from research that connects the spatially varying radiative feedbacks, which do depend on uncertain aspects of climate model formulation, and tropical circulation changes (11–13).
Because the masked radiative forcing mechanism introduced here results from the dependence of ’s radiative forcing on the climatology of clouds and humidity, GCM behavior can be constrained using observations. For example, if a GCM has a bias in its climatological cloud distribution such that its radiative forcing has stronger gradients than the forcing computed using Earth’s observed distribution, it may have an exaggerated direct weakening of the circulation. Comparison of the spatial structure of the radiative forcing of to other radiative forcing agents, such as solar and volcanic forcing, is a promising avenue for interpreting differences in the strength of tropical circulation changes (29) and constraining circulation changes under geoengineering schemes.
Materials and Methods
Comprehensive GCM Simulations.
The Geophysical Fluid Dynamics Laboratory’s (GFDL) ESM2M is a coupled ocean–atmosphere GCM capable of interactive carbon cycle simulations (30). The CMIP5 simulations shown in Fig. 1 use the prescribed concentration preindustrial and abrupt scenarios. The results of these simulations were obtained from GFDL’s Data Portal, data1.gfdl.noaa.gov/. Fig. 1 shows 40-y time means taken from the end of the preindustrial simulation and from years 81–120 in the abrupt simulation.
The GFDL’s AM2.1 is a comprehensive atmospheric GCM (31), which is the atmospheric component of ESM2M (30). The AM2.1 simulations presented here use the climatological SST and sea ice concentration from the ESM2M SST climatology. A corresponding set of AM2.1 simulations using the 1981–2005 climatology from the Hadley Centre HadISST dataset (32) are shown in Fig. S2. The simulation uses preindustrial concentrations of greenhouse gases and other radiative forcing agents, and only the concentration is changed in the simulation. All AM2.1 simulation results are 40-y time means following a 20-y spin-up period.
In the clear-sky radiative transfer simulations, the prognostic cloud variables are set to zero for the radiative transfer calculation, so the radiative temperature tendency is that of clear-sky conditions. This methodology has been used to examine the dependence of the climatological tropical (27) and extratropical (33) circulation on cloud radiative effects. The sole modification to the hydrological cycle of the GCM is to omit clouds from the radiative transfer calculation; all other diabatic processes, such as the latent heat release of condensation, are unchanged.
The strength of the tropical overturning circulations is assessed using the difference between the time-mean (indicated by ) subsiding and ascending pressure velocity, , averaged from to at the 500-hPa pressure level, following the analysis of CMIP5 simulations presented in Bony et al. (8).
Idealized Simulations.
The idealized moist GCM follows Merlis et al. (20): it has an interactive hydrological cycle with a simplified quasiequilibrium convection scheme (34) and a comprehensive clear-sky radiative transfer with a prescribed cloud distribution. The idealized simulations use the aquaplanet “Qobs” surface temperature distribution (35). The simulations presented here use perpetual annual-mean insolation, and similar results are obtained using perpetual equinox insolation. The concentration is , the concentration is . Other parameters follow Merlis et al. (20), except the surface albedo is 0.2 and the prescribed cloud distribution.
The prescribed cloud distribution is a time independent and zonally symmetric in the upper troposphere of the deep tropics designed to mimic the aspects of deep-convective clouds that are relevant to masking ’s radiative forcing. The cloud ice concentration and cloud fraction have the same structure: and , with latitude ϕ and the GCM vertical coordinate . The cloud variables decay meridionally with a half-width of and are set to zero poleward of . The vertical structure function is a half sine between and with maximum amplitude unity. The maximum cloud ice concentration and cloud fraction are and , respectively. There is no cloud liquid water prescribed. The maximum cloud fraction is low to compensate for the lack of temporal variability in the cloud fields. The idealized GCM simulation results are 40-y time means following a 20-y spin-up period.
The idealized GCM’s representation of the physical processes with the same boundary conditions and parameters are used to simulate states of RCE (36). The RCE results are 7.5-y means following a 300-d spin-up period. In addition, clear-sky () RCE simulations are performed. The RCE potential temperature is vertically integrated from the surface to , above which the increase in leads to stratospheric cooling, and this is used as the equilibrium potential temperature in the single-layer model of the Hadley circulation’s Newtonian relaxation formulation (28). Integrating the RCE potential temperature over the entire atmospheric column does not change the sensitivity of the single-layer model to increased . The single-layer model parameters are the same as in Sobel and Schneider (28), except the eddy velocity is set to zero to simulate the energetically controlled circulation regime.
Acknowledgments
Comments by Paul O’Gorman, Jaime Palter, Daniel Kirshbaum, Xavier Levine, Tim Cronin, and two anonymous reviewers improved the presentation of the results. I thank Paul O’Gorman for providing the RCE version of the idealized GCM, Tim Cronin for providing the single-layer model of the Hadley circulation, and GFDL for performing and providing the ESM2M simulations. I acknowledge the support of Natural Science and Engineering Research Council Grant RGPIN-2014-05416.
Footnotes
The author declares no conflict of interest.
This article is a PNAS Direct Submission.
This article contains supporting information online at www.pnas.org/lookup/suppl/doi:10.1073/pnas.1508268112/-/DCSupplemental.
References
- 1.Bala G, Caldeira K, Nemani R. Fast versus slow response in climate change: Implications for the global hydrological cycle. Clim Dyn. 2010;35(2-3):423–434. [Google Scholar]
- 2.O’Gorman PA, Allan RP, Byrne MP, Previdi M. Energetic constraints on precipitation under climate change. Surv Geophys. 2012;33(3-4):1–24. [Google Scholar]
- 3.Andrews T, Gregory JM, Forster PM, Webb MJ. Cloud adjustment and its role in CO2 radiative forcing and climate sensitivity: A review. Surv Geophys. 2012;33(3-4):619–635. [Google Scholar]
- 4.Zelinka MD, et al. Contributions of different cloud types to feedbacks and rapid adjustments in CMIP5. J Climate. 2013;26(14):5007–5027. [Google Scholar]
- 5.Yoshimura J, Sugi M. Tropical cyclone climatology in a high-resolution AGCM—impacts of SST warming and CO2 increase. SOLA. 2005;1:133–136. [Google Scholar]
- 6.Held IM, Zhao M. The response of tropical cyclone statistics to an increase in CO2 with fixed sea surface temperatures. J Climate. 2011;24(20):5353–5364. [Google Scholar]
- 7.Zhao M, et al. Robust direct effect of increasing atmospheric CO2 concentration on global tropical cyclone frequency: A multimodel inter-comparison. US CLIVAR Variations. 2013;11:17–24. [Google Scholar]
- 8.Bony S, et al. Robust direct effect of carbon dioxide on tropical circulation and regional precipitation. Nat Geosci. 2013;6(6):447–451. [Google Scholar]
- 9.Held IM, Soden BJ. Robust responses of the hydrological cycle to global warming. J Climate. 2006;19(21):5686–5699. [Google Scholar]
- 10.Shaw TA, Voigt A. Tug of war on summertime circulation between radiative forcing and sea surface warming. Nat Geosci. 2015;8(7):560–566. [Google Scholar]
- 11.Feldl N, Frierson DMW, Roe GH. The influence of regional feedbacks on circulation sensitivity. Geophys Res Lett. 2014;41(6):2212–2220. [Google Scholar]
- 12.Su H, et al. Weakening and strengthening structures in the Hadley circulation change under global warming and implications for cloud response and climate sensitivity. J Geophys Res. 2014;119(10):5787–5805. [Google Scholar]
- 13.Voigt A, Shaw TA. Circulation response to warming shaped by radiative changes of clouds and water vapour. Nat Geosci. 2015;8(2):102–106. [Google Scholar]
- 14.Emanuel KA, Neelin JD, Bretherton CS. On large-scale circulations in convecting atmospheres. Q J Roy Meteor Soc. 1994;120(519):1111–1143. [Google Scholar]
- 15.Muller CJ, O’Gorman PA. An energetic perspective on the regional response of precipitation to climate change. Nat Clim Change. 2011;1(5):266–271. [Google Scholar]
- 16.Schneider T, O’Gorman PA, Levine XJ. Water vapor and the dynamics of climate changes. Rev Geophys. 2010;48(3):RG3001. [Google Scholar]
- 17.Merlis TM, Schneider T. Changes in zonal surface temperature gradients and Walker circulations in a wide range of climates. J Climate. 2011;24(17):4757–4768. [Google Scholar]
- 18.Held IM, Hou AY. Nonlinear axially symmetric circulations in a nearly inviscid atmosphere. J Atmos Sci. 1980;37(3):515–533. [Google Scholar]
- 19.Neelin JD, Held IM. Modeling tropical convergence based on the moist static energy budget. Mon Weather Rev. 1987;115(1):3–12. [Google Scholar]
- 20.Merlis TM, Schneider T, Bordoni S, Eisenman I. Hadley circulation response to orbital precession. Part I: Aquaplanets. J Climate. 2013;26(3):740–753. [Google Scholar]
- 21.Peixoto JP, Oort AH. Physics of Climate. American Institute of Physics; New York: 1992. [Google Scholar]
- 22.Merlis TM, Schneider T, Bordoni S, Eisenman I. Hadley circulation response to orbital precession. Part II: Subtropical continent. J Climate. 2013;26(3):754–771. [Google Scholar]
- 23.Hill S, Ming Y, Held IM. Mechanisms of forced tropical meridional energy flux change. J Climate. 2015;28(5):1725–1742. [Google Scholar]
- 24.Govindasamy B, Caldeira K. Geoengineering Earth’s radiation balance to mitigate CO2-induced climate change. Geophys Res Lett. 2000;27(14):2141–2144. [Google Scholar]
- 25.Zhang M, Huang Y. Radiative forcing of quadrupling CO2. J Climate. 2014;27(7):2496–2508. [Google Scholar]
- 26.Huang Y, Zhang M. The implication of radiative forcing for poleward energy transport. Geophys Res Lett. 2014;41(5):1665–1672. [Google Scholar]
- 27.Randall DA, Harshvardhan, Dazlich DA, Corsetti TG. Interactions among radiation, convection, and large-scale dynamics in a general circulation model. J Atmos Sci. 1989;46(13):1943–1970. [Google Scholar]
- 28.Sobel AH, Schneider T. Single-layer axisymmetric model for a Hadley circulation with parameterized eddy momentum forcing. JAMES. 2009;1(10) [Google Scholar]
- 29.Liu J, Wang B, Cane MA, Yim S-Y, Lee J-Y. Divergent global precipitation changes induced by natural versus anthropogenic forcing. Nature. 2013;493(7434):656–659. doi: 10.1038/nature11784. [DOI] [PubMed] [Google Scholar]
- 30.Dunne JP, et al. GFDL’s ESM2 global coupled climate-carbon Earth System Models. Part I: Physical formulation and baseline simulation characteristics. J Climate. 2012;25(19):6646–6665. [Google Scholar]
- 31.Anderson JL, et al. The new GFDL global atmosphere and land model AM2-LM2: Evaluation with prescribed SST simulations. J Climate. 2004;17(24):4641–4673. [Google Scholar]
- 32.Rayner NA, et al. Global analyses of sea surface temperature, sea ice, and night marine air temperature since the late nineteenth century. J Geophys Res. 2003;108(D14):4407. [Google Scholar]
- 33.Li Y, Thompson DWJ, Bony S. The influence of atmospheric cloud radiative effects on the large-scale atmospheric circulation. J Climate. 2015;28(18):7263–7278. [Google Scholar]
- 34.Frierson DMW. The dynamics of idealized convection schemes and their effect on the zonally averaged tropical circulation. J Atmos Sci. 2007;64(6):1959–1976. [Google Scholar]
- 35.Neale RB, Hoskins BJ. A standard test for AGCMs including their physical parametrizations: I: The proposal. Atmos Sci Lett. 2000;1(2):101–107. [Google Scholar]
- 36.O’Gorman PA, Schneider T. The hydrological cycle over a wide range of climates simulated with an idealized GCM. J Climate. 2008;21(15):3815–3832. [Google Scholar]


