Significance
Despite the extensive attentions paid to phosphatase and tensin homolog (Pten) or SH2-containing tyrosine phosphatase (Shp2) functions in cell signaling, how their regulated pathways are intertwined has never been investigated. By creating a compound mutant mouse line with both genes deleted in blood cells, we have found that Pten and Shp2 can work antagonistically in myelopoiesis, while acting cooperatively in erythropoiesis. Consistently, pharmacological inhibition of Shp2 suppressed myeloproliferative neoplasm induced by Pten loss but induced severe anemia. These data explain why some pharmaceuticals designed to target a specific pathway can suppress one pathogenic process but trigger another.
Keywords: Pten, Shp2, myeloproliferative neoplasm, erythropoiesis, anemia
Abstract
Previous data suggested a negative role of phosphatase and tensin homolog (Pten) and a positive function of SH2-containing tyrosine phosphatase (Shp2)/Ptpn11 in myelopoiesis and leukemogenesis. Herein we demonstrate that ablating Shp2 indeed suppressed the myeloproliferative effect of Pten loss, indicating directly opposing functions between pathways regulated by these two enzymes. Surprisingly, the Shp2 and Pten double-knockout mice suffered lethal anemia, a phenotype that reveals previously unappreciated cooperative roles of Pten and Shp2 in erythropoiesis. The lethal anemia was caused collectively by skewed progenitor differentiation and shortened erythrocyte lifespan. Consistently, treatment of Pten-deficient mice with a specific Shp2 inhibitor suppressed myeloproliferative neoplasm while causing anemia. These results identify concerted actions of Pten and Shp2 in promoting erythropoiesis, while acting antagonistically in myeloproliferative neoplasm development. This study illustrates cell type-specific signal cross-talk in blood cell lineages, and will guide better design of pharmaceuticals for leukemia and other types of cancer in the era of precision medicine.
Delineating molecular signaling cascades has guided the design of many therapeutic chemicals that target specific signaling molecules for treatment of various diseases, including cancer. However, the cross-talk between signaling pathways may confound patients’ responses to pharmaceuticals designed to disrupt a specific pathway. For example, AXL kinase activation leads to resistance to erlotinib that targets EGFR in treatment of non-small cell lung cancer (1). This issue can be even more complicated by the possibility that parallel pathways may work cooperatively or antagonistically, depending on cellular context. Thus, elucidating cell type-specific signal intersections will be instrumental for predicting and alleviating side effects and also for designing optimal drug mixtures.
Pten (phosphatase and tensin homolog) is a tumor suppressor that negatively regulates the phosphoinositide 3-kinase (PI3K) and Akt pathway and is frequently mutated in hematopoietic malignancies, especially in T-cell lymphoblastic leukemia, and acute myeloid leukemia (2–7). Consistently, selective deletion of Pten in blood cells resulted in short-term expansion and long-term decline of hematopoietic stem cells (HSC), as well as development of myeloproliferative neoplasm (MPN), defining a preventive role of Pten in myeloproliferative disorders (8, 9). In contrast, Shp2 is an SH2-containing tyrosine phosphatase that plays a positive role in hematopoiesis, and ablating Shp2 suppressed HSC and progenitor cell self-renewal and differentiation in mice (10–12). Dominantly activating mutations were detected in Ptpn11/Shp2 in nearly 50% of Noonan syndrome patients (13–16), who have higher risk of juvenile myelomonocytic leukemia (13, 17, 18). Somatic gain-of-function mutations in Ptpn11/Shp2 have been detected in sporadic juvenile myelomonocytic leukemia, acute myeloid leukemia, B-cell lymphoblastic leukemia, and myelodysplastic syndromes (19–21). Furthermore, hematopoietic disorders, mainly MPN, were detected in transgenic or knockin mouse lines expressing the dominant-active Shp2 mutants (22, 23). In aggregate, these data suggest opposite roles of Pten and Shp2 in myelopoiesis.
The present study is designed to determine functional interactions between Pten- and Shp2-modulated signaling cascades in hematopoietic cell lineages.
Results
Additional Deletion of Shp2 Suppresses MPN Induced by Pten Loss.
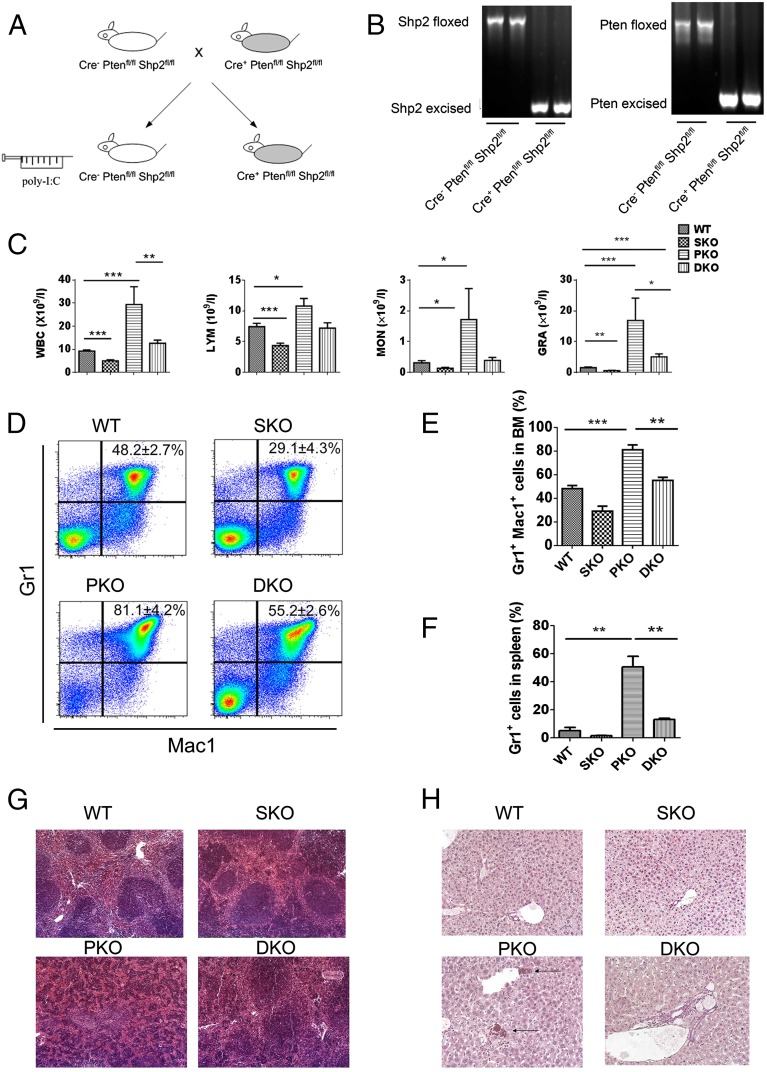
We generated a new mouse line with conditional deletion of both Pten and Shp2 in the hematopoietic compartment [Cre+:Ptenfl/fl:Shp2fl/fl, double knockout (DKO)], by crossing Ptenfl/fl and Shp2fl/fl mice with Mx1-Cre transgenic mice. Polyinosine-polycytidine (poly-I:C) injection induced efficiently Cre-mediated DNA excision at both Pten and Shp2 loci in bone marrow (BM) cells (Fig. 1 A and B). In agreement with previous data (8, 9), the conditional Pten KO (PKO) (Cre+:Ptenfl/fl) animals displayed significantly elevated counts of total white blood cells (WBC), lymphocytes, monocytes, and granulocytes, with the latter exhibiting the most drastic increase (Fig. 1C). However, the inducible Shp2 KO (SKO) (Cre+:Shp2fl/fl) mice exhibited opposite phenotypes of lowering blood cell counts, reinforcing a positive role for Shp2 in promoting hematopoiesis (Fig. 1C). Notably, dual deletion of Pten and Shp2 restored overall and specific WBC counts to nearly WT levels (Fig. 1C), indicating opposing roles for Shp2 and Pten in myelopoiesis. In particular, additional removal of Shp2 normalized the expansion of Pten-deficient Mac1+Gr1+ myeloid progenitors (Fig. 1 D and E), and suppressed excessive proliferation of Pten−/− Gr1+ cells in the spleen (Fig. 1F). Extramedullary hematopoiesis in PKO spleen disrupted the normal red-pulp/white-pulp structure, which was also partially rescued in DKO mice (Fig. 1G). Chloroacetate esterase staining showed apparent myeloid cell infiltration in the liver of PKO but not DKO animals (Fig. 1H).
Fig. 1.
Shp2 ablation neutralizes development of myeloid proliferative neoplasm induced by Pten loss. (A) A Pten and Shp2 DKO mouse line was generated by breeding Mx1-Cre+:Ptenfl/fl:Shp2fl/fl with Mx1-Cre−:Ptenfl/fl:Shp2fl/fl mice and injection of poly-I:C. (B) Excision of the floxed DNA sequences was detected by PCR analysis of BM cells isolated 1 wk after final poly-I:C injection. (C) WBC, lymphocyte (LYM), monocyte (MON), and granulocyte (GRA) count in the peripheral blood was performed 1 wk after final poly-I:C injection (n = 5–8). (D) Representative FACS plots for Mac1 and Gr1 staining of BM cells. (E) Shp2 ablation suppresses Pten deletion-mediated accumulation of Mac1+Gr1+ BM cells (n = 3–5). (F) Shp2 removal restrains overproliferation of splenic Gr1+ cells induced by Pten deficiency (n = 3–4). (G) Representative H&E staining of spleen sections. Images were scanned by ScanScope Digital Slide Scanners with 100× magnification. (H) Representative chloroacetate esterase staining of liver sections shows myeloid infiltration in PKO but not DKO liver. Arrows point to the myeloid cells. Images were scanned by ScanScope Digital Slide Scanners with 100× magnification. (***P < 0.001, **P < 0.01, *P < 0.05; data are presented as means ± SEM.)
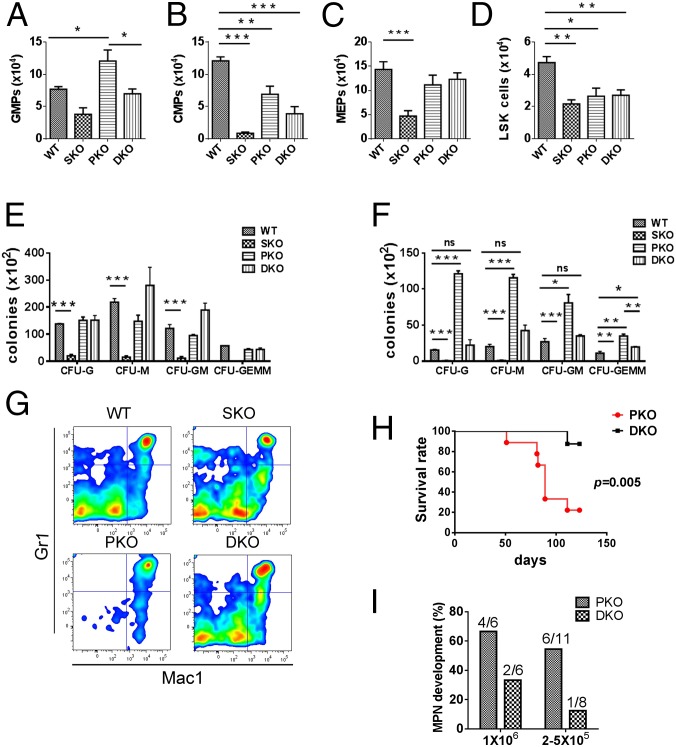
To pinpoint the intersection of Shp2- and Pten-regulated signals in myelopoiesis, we evaluated common myeloid progenitors (CMPs), granulocyte/monocyte progenitors (GMPs), and megakaryocyte/erythrocyte progenitors (MEPs) (Fig. 2 A–C). GMP number was significantly increased in PKO BM, and additional deletion of Shp2 reduced the expansion of GMPs to WT levels (Fig. 2A). Moderate reduction of CMPs was seen in DKO BM, with more severe decrease in SKO (Fig. 2B). MEPs were reduced in SKO, with no significant changes in PKO and DKO mice (Fig. 2C). The LSK cell population enriched for HSCs were similarly decreased in mutants, with the most severe decrease seen in SKO mice at 2 wk after the final poly-I:C injection (Fig. 2D). Consistent with previous reports by other groups (8, 9), we found that Pten deficiency led to extramedullary hematopoiesis manifested by substantial increase in spleen-derived myeloid colonies but unchanged BM-derived myeloid colonies using in vitro CFU-C assays (Fig. 2 E and F and Fig. S1). Additional Shp2 removal abolished the increase and restored spleen- or BM-derived myeloid colonies to almost WT levels in general (Fig. 2 E and F and Fig. S1). Taken together, these data suggest a role of Shp2 in promoting myeloid proliferation at an early developmental stage.
Fig. 2.
Inhibition of Pten−/− myeloid progenitor expansion and MPN engraftment by additional Shp2 ablation. (A–D) The frequency of GMPs (A), CMPs (B), MEPs (C), and LSK cells (D) was determined in the BM. GMPs were gated as Lin−Sca-1−Kit+FcgRhiCD34+, CMPs as Lin−Sca-1−Kit+FcgRloCD34+, MEPs as Lin−Sca-1−Kit+FcgRloCD34−, and LSK cells as Lin−Sca-1+Kit+ (n = 4–5). (E and F) In vitro CFU assays were performed for nucleated BM (E) or splenic cells (F), by seeding 20,000 BM or 100,000 splenic cells in MethoCultGF M3434 medium (StemCell Technologies) with cytokines for 14 d before colony enumeration (n = 3–4). (G) Myeloid progenitors accumulate and MPN develops in recipients engrafted with PKO but not DKO BM cells. The representative flow cytometric plots denote the Gr1 and Mac1 staining of BM cells. In the reconstitution experiments, 5 × 10⁵ BMNCs were injected to recipients that received lethal irradiation. BMNCs from control or mutant animals (CD45.2) were mixed with 2 × 10⁵ BMNCs from CD45.1 mice for radioprotection in the transplantation assay. (H) Mice that received DKO BM cells survived longer than those transplanted with PKO BM cells. (I) MPN development was examined in recipients as shown, with 1 × 10⁶ or 2.5 × 10⁵ to 5 × 10⁵ BMNCs used for transplantation. BMNCs from control or mutant animals (CD45.2) were mixed with 2 × 10⁵ BMNCs from CD45.1 mice for radioprotection in the transplantation assays. (***P < 0.001, **P < 0.01,*P < 0.05; ns, not significant; data are presented as means ± SEM).
Fig. S1.

Shp2 removal abolishes the increase of G-CSF, M-CSF, or GM-CSF responsive colony-forming cells. In vitro CFU-G, CFU-M, or CFU-GM assays for BMNCs (A) or splenic cells (B) were performed, by seeding 10,000 BM (A) or 100,000 spleen (B) cells in MethoCultGF M3234 medium (StemCell Technologies) containing 10 ng/mL G-CSF, M-CSF, or GM-CSF, respectively, for 7 d before colony enumeration (n = 4). Data are presented as means ± SEM (***P < 0.001, **P < 0.01,*P < 0.05; ns, not significant).
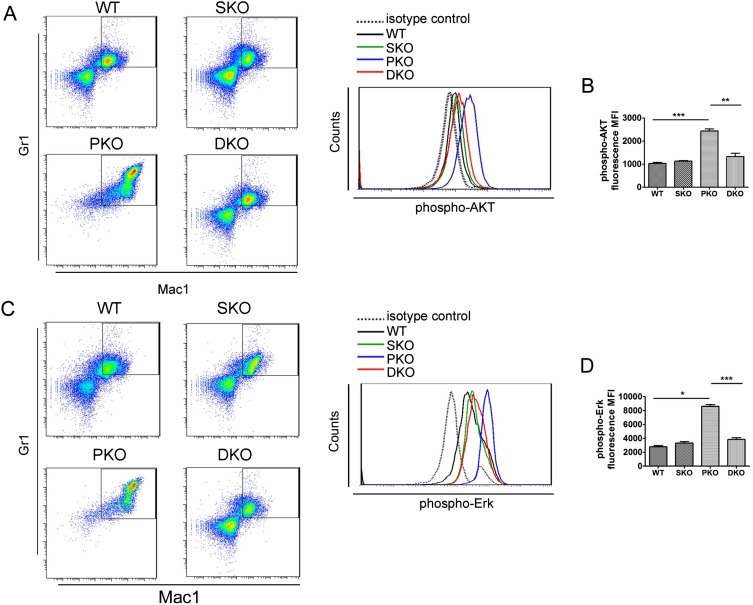
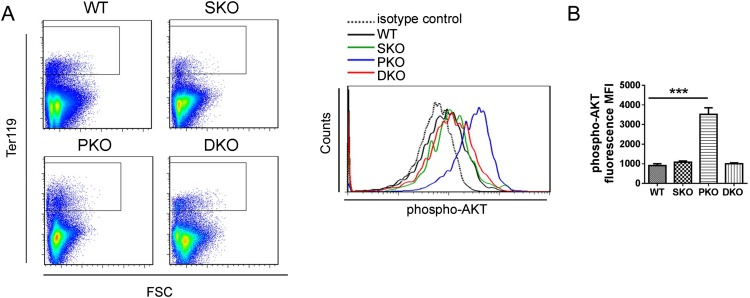
We monitored MPN engraftment in lethally irradiated recipients reconstituted with PKO or DKO BM cells. When 1 × 10⁶ BM nucleated cells (BMNCs) were transplanted, 67% recipients with PKO BM donor cells developed MPN within 3 mo, but only 33% mice engrafted with DKO BM showed MPN. When 2.5–5 × 10⁵ BMNCs were engrafted, 55% PKO recipients developed MPN, in contrast to only 12.5% in recipients receiving DKO cells (Fig. 2 G–I). These data suggest a putative therapeutic approach of targeting Shp2 for MPN induced by Pten deficiency. We have investigated the molecular mechanism for the antagonistic effects between Shp2 and Pten in Gr1+Mac1+ myeloid cell signaling. Flow cytometric analysis detected elevated p-Akt signals in PKO cells, which was compromised by additional Shp2 ablation in DKO cells (Fig. S2 A and B). In addition, p-Erk levels were significantly up-regulated in PKO myeloid progenitors but alleviated in DKO cells (Fig. S2 C and D). These data suggest that Pten and Shp2 regulate the PI3K-Akt pathway bidirectionally.
Fig. S2.
Additional Shp2 deletion alleviates the hyperphosphorylation of AKT and Erk in PKO myeloid progenitors. (A) Representative flow cytometry plots of phospho-AKT(S473) staining in Gr1+Mac1+ myeloid progenitors. (B) Statistical analysis of median phospho-AKT staining fluorescence intensity (n = 3–4). (C) Representative flow cytometry plots of phospho-Erk1/2(T202/Y204) staining in Gr1+Mac1+ myeloid progenitors. (D) Statistical analysis of median phospho-Erk1/2(T202/Y204) staining fluorescence intensity (n = 3–4). Data are presented as means ± SEM (***P < 0.001, **P < 0.01, *P < 0.05).
Dual Deletion of Shp2 and Pten Triggers Lethal Anemia and Skewed Erythroid Cell Differentiation.
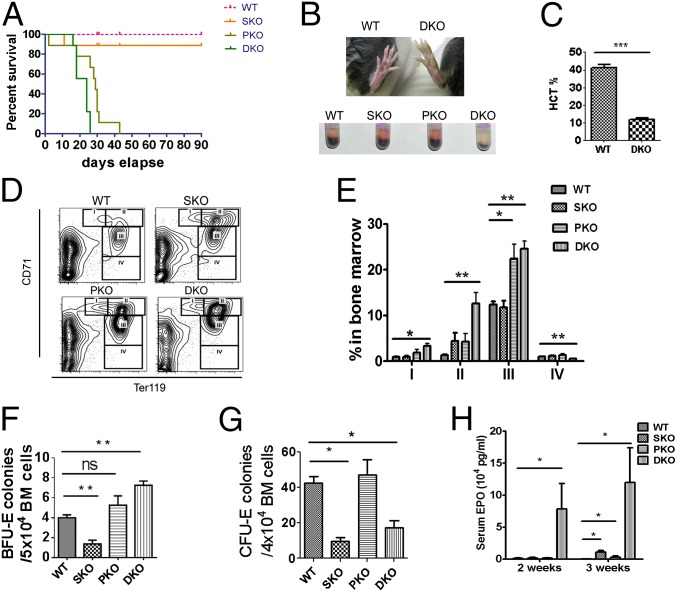
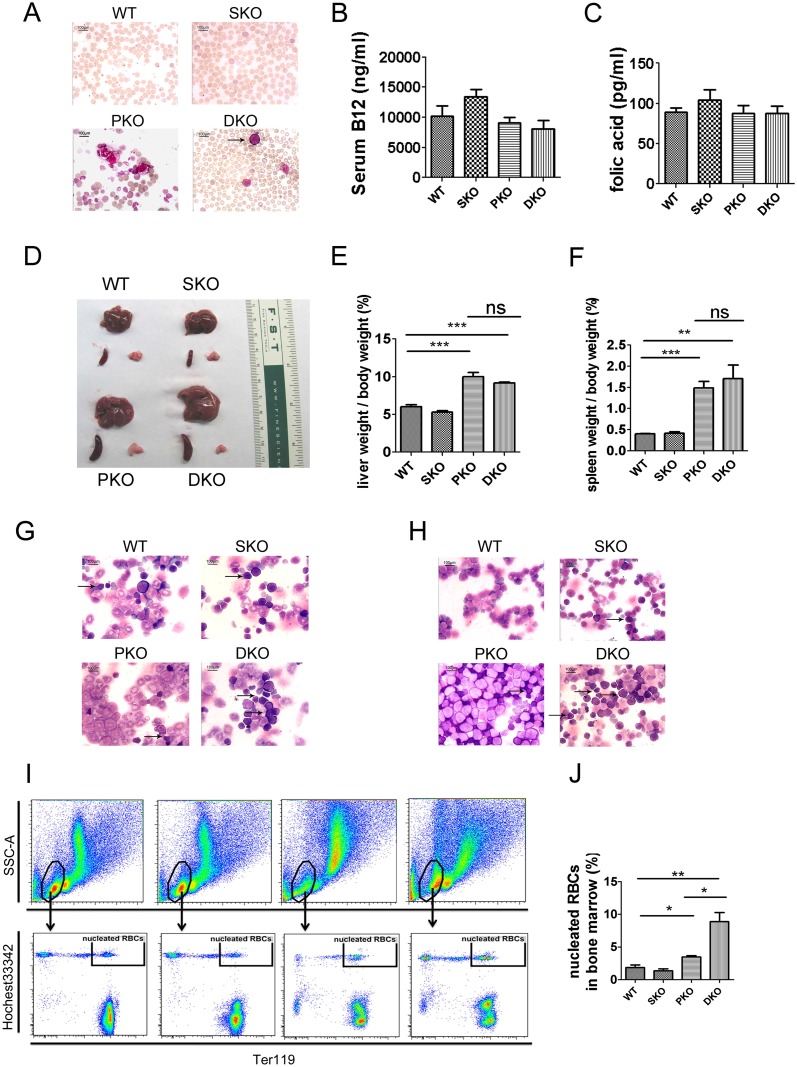
Surprisingly, despite the inhibitory effect of additional Shp2 deletion on MPN driven by Pten loss, the DKO mice had shorter lifespan than PKO mice and died within 30 d after poly-I:C induction of gene deletion (Fig. 3A). The shortened lifespan was not detected in the DKO BM transplantation recipients (Fig. 2H) because of cotransplantation of CD45.1+ WT BM cells. We found that concurrent ablation of Pten and Shp2 induced lethal anemia, and the DKO animals showed anemic signs, like pale toes and much smaller red blood cell (RBC) pellets shortly after the induced gene excision (Fig. 3B). We observed nearly 50% reduction of RBC count, hemoglobin concentration, and hematocrit in DKO mice, compared with controls, at 1 wk after final injection of poly-I:C (Table S1). In moribund DKO animals, hematocrit was as low as 25% of normal counts (Fig. 3C). Moderate anemia was observed in mice with either Pten or Shp2 ablated as shown by the parameters of erythroid compartment (Table S1). However, combined deletion of both genes dramatically aggravated the phenotype, indicating concerted action of Shp2 and Pten in erythropoiesis and maintenance of RBC homeostasis. Increased immature RBC frequency associated with higher mean corpuscular volume (MCV) (Table S1) was detected in peripheral blood of DKO mice (Fig. S3A). Macrocytic anemia (high MCV) is often associated with deficiency of vitamin B12 and folic acid, but neither vitamin B12 nor folic acid was decreased in DKO sera, compared with controls (Fig. S3 B and C). Although infiltration of myeloid cells was not detected in the spleen or liver of DKO mice, these organs were equally enlarged as in PKO animals, most likely because of compensatory extramedullary hematopoiesis (Fig. S3 D–F). Wright–Giemsa staining showed increased erythroblasts in BM and spleen cytospin specimens from DKO animals (Fig. S3 G and H). The number of nucleated erythrocytes (double-positive for the DNA dye Hochest33342 and Ter119) was significantly increased in DKO BM, compared with WT, SKO, and PKO mice (Fig. S3 I and J). We also detected erythroblasts occasionally in the peripheral blood of DKO but not in WT, SKO, or PKO mice (Fig. S3A).
Fig. 3.
Dual deletion of Pten and Shp2 causes lethal anemia, expansion of erythroid progenitors and abortive differentiation of RBCs. (A) Survival curve of WT, PKO, SKO, and DKO mice after final injection of poly-I:C (*P = 0.028 between PKO and DKO, **P = 0.0029 between SKO and DKO, n = 9). (B) DKO mouse shows pale toe and tiny RBC pellet after centrifugation of whole peripheral blood. (C) Severe anemic DKO mice show hematocrit as low as 25% of normal count (n = 3–4). (D) Representative FACS plots for CD71 and Ter119 staining of BM cells. (E) Quantification of CD71highTER119low (gate I), CD71highTER119+ (gate II), CD71medTER119+ (gate III), and CD71lowTER119+ (gate IV) frequency in BM shows expansion of CD71highTER119low, CD71highTER119+, and CD71medTER119+ erythroid progenitors in DKO mice. In contrast, CD71lowTER119+ erythroid cells were significantly reduced in DKO BM (n = 3–5). (F) In vitro BFU-E assay shows much higher BFU-E for nucleated BM cells of DKO animals (n = 3–4). BFU-E assays were performed by seeding 20,000 BM cells in MethoCultGF M3434 medium (StemCell Technologies) for 14 d (n = 3–4). (G) In vitro CFU-E assay indicates dramatically reduced CFU-E for nucleated BM cells of DKO mice. CFU-E was assayed for nucleated BM cells in MethoCultGF M3234 medium supplemented by 6 units per milliliter recombinant human Epo (n = 3–4). (H) Serum EPO concentrations were measured by an ELISA Kit (R&D). (n = 3–5). (***P < 0.001, **P < 0.01, *P < 0.05, data are presented as means ± SEM.)
Table S1.
Peripheral RBC parameters show severe anemia in DKO animals
| WT | SKO | PKO | DKO | |
| RBC (x1012/L) | 8.67 ± 0.18 | 7.37 ± 0.32** | 7.54 ± 0.51*** | 3.92 ± 0.31*** |
| HGB(g/dL) | 14.90 ± 0.35 | 13.49 ± 0.48* | 14.26 ± 0.59* | 9.46 ± 0.74*** |
| HCT (%) | 40.73 ± 0.85 | 36.95 ± 1.29* | 37.94 ± 0.69* | 25.31 ± 1.85*** |
| MCV (fl) | 47.67 ± 0.67 | 51.33 ± 0.33 | 51.20 ± 2.96 | 63.00 ± 2.08** |
| MCH (pg) | 17.63 ± 0.27 | 18.77 ± 0.18* | 19.12 ± 0.68 | 23.30 ± 1.08** |
| MCHC (g/dL) | 36.97 ± 0.62 | 36.30 ± 0.15** | 36.95 ± 0.8 | 36.93 ± 1.09** |
| RDWC (%) | 17.67 ± 0.35 | 20.80 ± 0.30** | 21.66 ± 0.87* | 26.50 ± 0.29*** |
HCT, hematocrit; HGB, hemoglobin; MCH, mean corpuscular hemoglobin; MCHC, mean corpuscular hemoglobin concentration; MCV, mean corpuscular volume; RDWC, RBC width distribution. Data are presented as means ± SEM, (n = 3–8, ***P < 0.001, **P < 0.01,*P < 0.05; P value was calculated between each group to WT).
Fig. S3.
Accumulation of erythroblasts in DKO hematopoietic organs. (A) Erythroblasts were detected in the DKO peripheral blood. Representative pictures were shown for Wright–Giemsa staining of blood smears. At least four animals in each group were examined in the experiment, and arrows point to the erythroblasts. (B and C) Comparable B12 (B) and folic acid (C) concentrations in WT, SKO, PKO, and DKO sera (n = 3–5). (D–F) Enlarged spleen and liver in DKO and PKO mice (n = 3–4). (G and H) Accumulation of erythroblasts in DKO BM and spleen. Wright–Giemsa staining of BM (G) and spleen cytospin specimens (H) was performed. At least four animals in each group were examined, with representative pictures shown. Arrows point to the erythroblasts. A, G, and H were captured with 1,000× magnification using a Nikon light microscope. (I) Representative FACS plots for nucleated RBCs in BM samples. (J) Statistical data of nucleated RBCs in BM samples (n = 3–4). Data are presented as means ± SEM (**P < 0.01, *P < 0.05).
The RBC maturation process can be divided into stages I–IV, based on expression of transferrin receptor CD71 and Ter119 (24). The BM of DKO mice was characterized by expansion of early stage CD71highTer119low, CD71highTer119+, and CD71midTer119+ erythroblasts, accompanied by decrease of late stage CD71lowTer119+ erythroid cells (Fig. 3 D and E), indicating abortive differentiation from erythroblasts to mature RBCs. In vitro erythroid colony forming unit (CFU-E) assay showed that erythroid burst forming unit (BFU-E) was elevated in the BM of DKO animals (Fig. 3F), whereas more mature CFU-E was significantly reduced in the DKO BM (Fig. 3G). These data indicate a blockage from early erythroid progenitors to CFU-E stage. A dramatic increase of serum erythropoietin (Epo) levels was detected in DKO mice 2 or 3 wk after poly-I:C injection, with only moderate elevation of serum Epo observed in PKO or SKO mice (Fig. 3H). Evidently, the severe anemia in DKO mice was not caused by Epo deficiency, but rather the anemia triggered compensatory production of excessive Epo and consequently the erythroid progenitor expansion.
Removal of Shp2 and Pten Leads to Enhanced Reactive Oxygen Species Accumulation and Shortened RBC Lifespan.
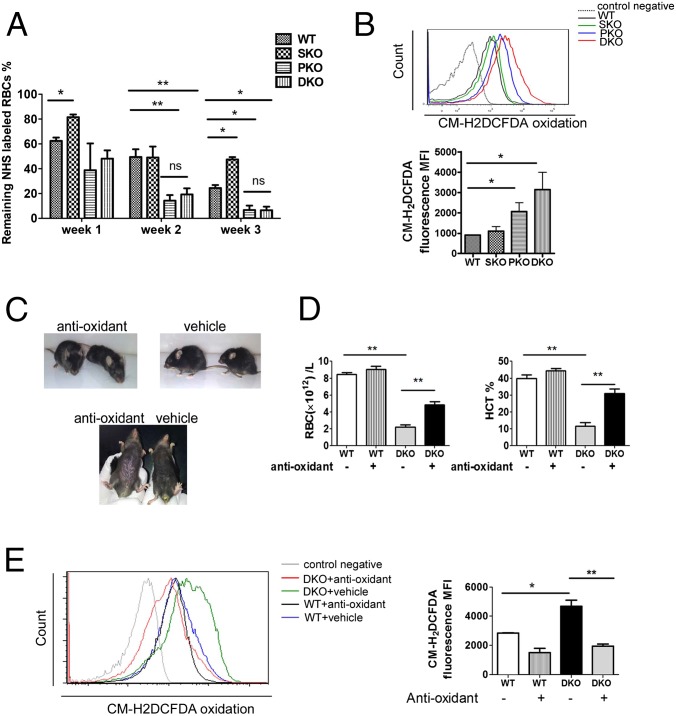
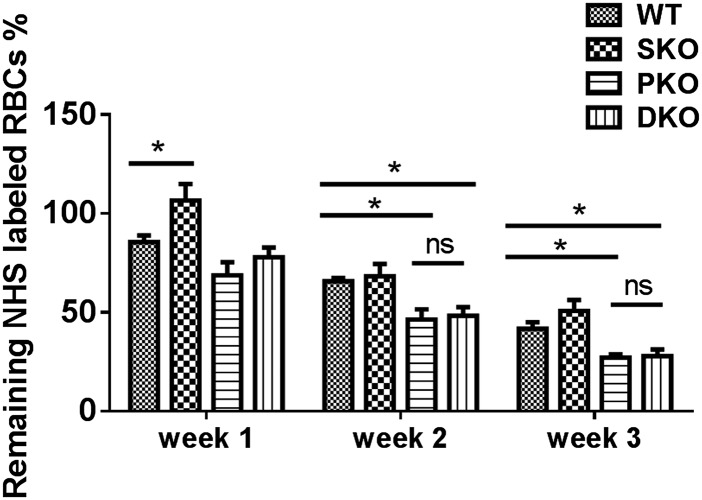
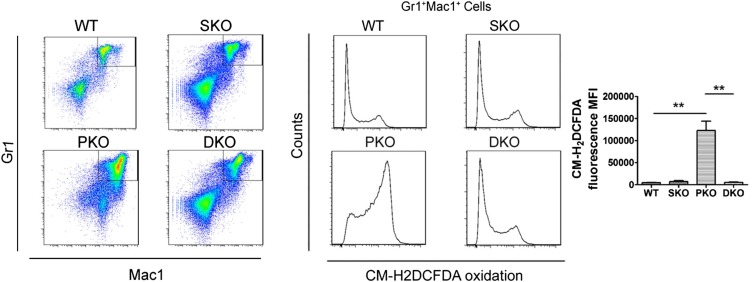
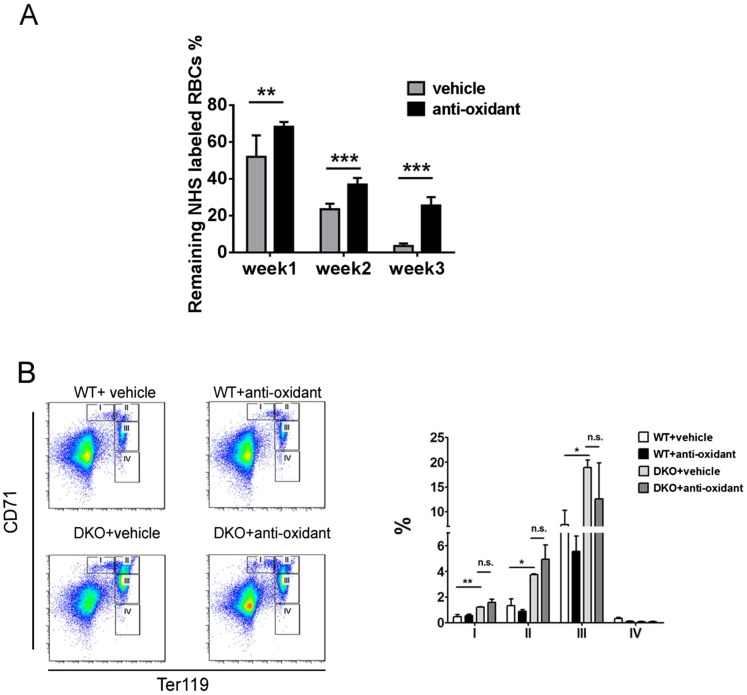
Using sulfo-NHS-biotin labeling, we measured RBC survival rates in vivo for consecutive 3 wk, and detected significantly shortened lifespan of DKO erythrocytes, compared with WT (Fig. 4A). To determine if the decreased lifespan is intrinsic to erythrocytes, we measured survival of sulfo-NHS-biotin–labeled donor RBCs in recipient mice. Untreated Mx1-Cre+:Ptenfl/fl:Shp2fl/fl and Mx1-Cre−:Ptenfl/fl:Shp2fl/fl BM cells were transplanted into lethally irradiated WT mice, and poly-I:C was given to the recipients 1 mo later to delete the engineered target genes in donor cells. We observed significantly shortened lifespan of DKO erythrocytes in recipients (Fig. S4), indicating a cell-autonomous effect. Considering that oxidative stress is a critical determinant of erythrocyte lifespan, we used a probe 5-(and-6)-chloromethyl-2′,7′-dichlorodihydrofluorescein diacetate, acetyl ester (CM-H2DCFDA) as a general oxidative stress indicator to measure reactive oxygen species (ROS) levels in different hematopoietic compartments. Pten deletion caused significantly elevated ROS levels in erythrocytes, which was further aggravated in RBCs of DKO origin (Fig. 4B). In contrast, increased ROS level was detected in BM Gr1+Mac1+ myeloid progenitors of PKO but not DKO animals (Fig. S5). Akt-mediated signaling was previously demonstrated to be an important regulator in defense against oxidative stress (25). Interestingly, phospho-Akt level of erythroblasts was excessively up-regulated in PKOs but not DKOs (Fig. S6), suggesting other mechanisms were involved in the elevation of ROS in DKO erythrocytes. To determine a possible effect of ROS accumulation, we investigated if antioxidant treatment can ameliorate the anemic phenotype of DKO mice. Animals were fed with 1 g/L N-acetyl cysteine and 4 g/L vitamin C drinking water and were injected intraperitoneally with 2 mg N-acetyl cysteine every other day for a month. Twenty days after the initial treatment, poly-I:C was injected to delete the target genes. As shown in Fig. 4C, antioxidant administration greatly improved the gross appearance of DKO animals manifested by hunched posture and rough hair coats. When peripheral blood was collected for complete blood cell counting, we found significantly increased RBC counts and hematocrit in DKO mice treated with antioxidants (Fig. 4D). However, antioxidants did not result in a full rescue of DKO anemia, even though down-regulation of ROS and significant elongation of life span in DKO RBCs were detected (Fig. 4E and Fig. S7A). Furthermore, antioxidant treatment did not fully correct abnormal accumulation of erythroid progenitors (Fig. S7B). Taken together, these results argue that the elevated ROS level and shortened RBC lifespan are not fully responsible for the lethal anemia phenotype in DKO mice. Combined defects in the erythroid differentiation and survival contribute to the severe anemia in DKOs.
Fig. 4.
Accumulation of ROS and reduced RBC lifespan contributes to the severe anemia in DKO mice. (A) RBC lifespan was measured by sulfo-NHS-biotin labeling (n = 3–4). Significantly shortened lifespan was observed for PKO and DKO RBCs. (B) ROS staining was done on freshly collected peripheral blood cells by staining with 25 μm CM-H2DCFDA (Life Technologies) for 30 min at 37 °C, and analyzed by flow cytometry. (Upper) Representative FACS plots for CM-H2DCFDA staining. (Lower) Median fluorescence intensity (MFI) for CM-H2DCFDA staining of erythrocytes. (C) Antioxidant treatment greatly improved the gross appearance and pale toes of DKO animals. (D) Partial but significant restoration of RBC number and hematocrit in DKO mice subjected to the antioxidant administration (n = 3). (E) Suppression of ROS accumulation in DKO erythroblasts by the antioxidant treatment. MFI for CM-H2DCFDA staining of erythrocytes is shown (Right) (n = 3). (**P < 0.01, *P < 0.05, data are presented as means ± SEM.)
Fig. S4.
Shortened lifespan of DKO RBCs was not a result of destructive environment. Untreated BMNCs from different donors were transplanted into lethally irradiated mice. One month after transplantation, three doses of poly-I:C were administered to induce gene deletion. The RBC lifespan was then measured by sulfo-NHS-biotin labeling in transplanted recipient mice. Significantly decreased lifespan of Shp2/Pten-deficient RBCs was detected as in primary DKO animals (comparing Fig. 4A to Fig. S4) (*P < 0.05, data are presented as mean ± SEM, n = 3–5).
Fig. S5.
Unaltered ROS levels in DKO myeloid progenitors. Elevated ROS concentration was observed in PKO but not DKO Gr1+Mac1+ myeloid progenitors (three to four animals in each group were examined and representative FACS plots are shown). Statistical analysis is shown (Right) (**P < 0.01, data are presented as mean ± SEM).
Fig. S6.
Hyperphosphorylation of AKT is detected in PKO erythroblasts. (A) Representative flow cytometry plots of phospho-AKT(S473) staining in Ter119+ BMNCs. (B) Statistical analysis of median phospho-AKT staining fluorescence intensity (n = 3–4). (***P < 0.001, data are presented as mean ± SEM.)
Fig. S7.
Antioxidant treatment leads to elongated life span of DKO erythrocytes but does not affect the skewed differentiation of DKO erythroblasts. (A) Antioxidant treatment increases the life span of DKO erythrocytes (n = 6). (B) Representative FACS plots for CD71 and Ter119 staining of BM cells from vehicle and antioxidant-treated WT or DKO mice (three animals in each group were examined in the experiment and representative FACS plots are shown). Statistical analysis is shown in the right panel (***P < 0.001, **P < 0.01, *P < 0.05, data are presented as mean ± SEM).
Shp2 Inhibitor Suppresses MPN While Inducing Anemia in PKO Mice.
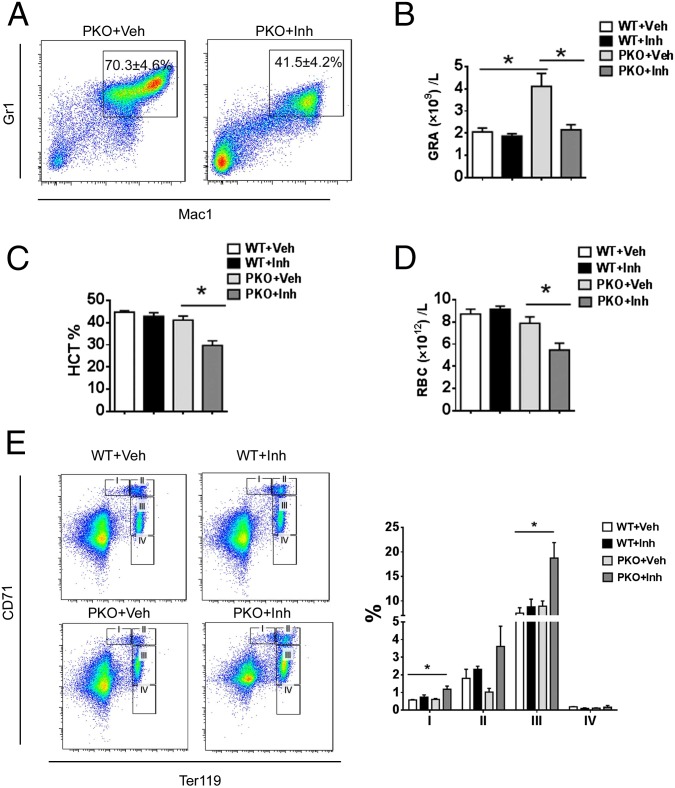
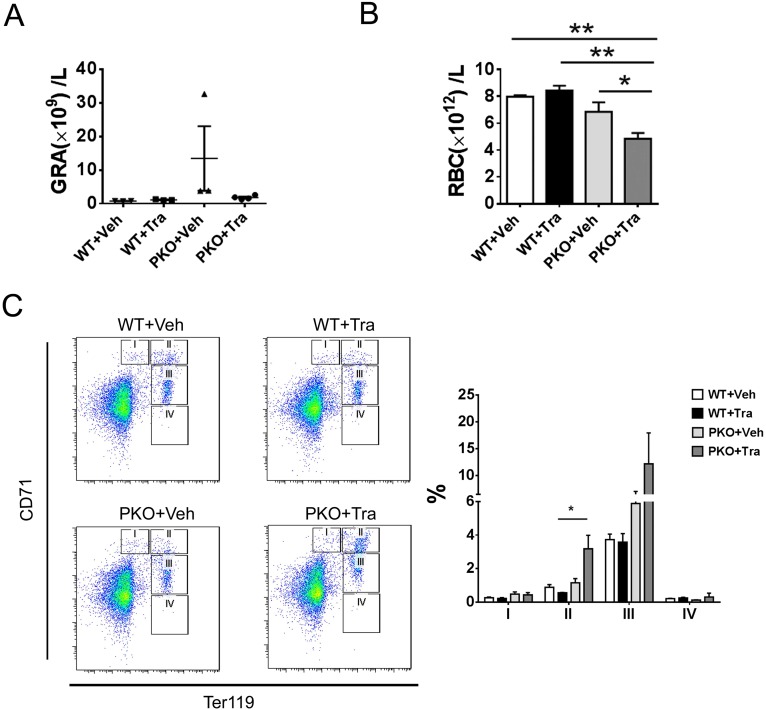
Given the inhibitory role of additional Shp2 deletion on MPN induced by Pten loss, we further determined if chemical inhibition of Shp2 has a similar effect, by testing a novel Shp2 inhibitor 11a-1 in PKO mice. 11a-1 was recently demonstrated to specifically inhibit Shp2 phosphatase activity and attenuate Shp2-dependent signaling, and antiproliferative effect of 11a-1 treatment was seen in leukemia, lung, and breast cancer cell lines (26). As shown in Fig. 5 A and B, consecutive intraperitoneal injection of 11a-1 significantly suppressed the excessive myeloproliferation caused by loss of Pten, as indicated by the decrease of Gr1+Mac1+ cells in the BM and decreased granulocytes in the peripheral blood of 11a-1-treated PKOs, with no detectable effect in WT mice. Of note, similar to the phenotype of DKO mice, injection of Shp2 inhibitor 11a-1 also triggered anemia development in PKO mice, as evaluated by RBC counts and hematocrit value (Fig. 5 C and D). However, the compound did not have significant impact on hematocrit or the peripheral RBC counts in WT mice (Fig. 5 C and D). Furthermore, 11a-1 treatment caused accumulation of CD71high and CD71mid erythroblast in the BM of PKO mice, reminiscent of the DKO phenotype, but not in WT mice (Fig. 5E). As a primary role of Shp2 is to promote the Ras-Erk pathway in cell signaling, we also tested the effect of Trametinib, a potent Mek inhibitor recently approved by the Food and Drug Administration for cancer treatment. Similar to the Shp2 inhibitor, injection of the Mek inhibitor Trametinib also induced anemia in PKO mice, with no effect in WT mice (Fig. S8). As expected, the anemia induced by the chemical compounds 11a-1 or Traminib in PKO mice was less severe than the phenotype of DKO mice with homozygous deletion of both Shp2 and Pten genes. Together, the genetic and pharmaceutical data argue that concurrent inhibition of Pten- and Shp2-regulated signals can cause severe anemia.
Fig. 5.
A Shp2 inhibitor suppresses myeloproliferation while inducing anemia in PKO mice. (A) Shp2 inhibitor 11a-1 ameliorated excessive myeloproliferation in the BM driven by homozygous deletion of Pten (Veh, vehicle; Inh, inhibitor; n = 3–4, representative FACS plots are shown). (B) Shp2 inhibitor treatment suppressed accumulation of granulocytes in the peripheral blood of PKO mice (n = 3–4). (C and D) PKO mice developed anemia upon treatment of the Shp2 inhibitor. Reduced hematocrit and RBC count in PKO mice treated with 11a-1 (n = 3–4). (E) Accumulation of erythroblasts in the BM of Shp2 inhibitor-treated PKO mice. Representative FACS plots for CD71 and Ter119 staining of BM cells are shown (three to four mice in each group were examined in the experiment). (*P < 0.05, data are presented as means ± SEM.)
Fig. S8.
MEK inhibitor Trametinib, a new anticancer drug, suppresses myeloproliferation but induces anemia in PKO mice. (A) Trametinib treatment ameliorated the accumulation of granulocytes in the peripheral blood of PKO mice (n = 3–4). Veh, Vehicle; Tra, Trametinib. (B) Decreased RBC count in PKO mice treated with Trametinib (n = 3–4). (C) Increased early erythroblasts in the BM from Trametinb-treated PKO mice. Representative FACS plots for CD71 and Ter119 staining of BM cells are shown (three to four animals in each group were examined in the experiment). Statistical analysis is shown in the right panel (**P < 0.01, *P < 0.05, data are presented as mean ± SEM).
Discussion
Pten is known to down-regulate the PI3K/Akt signaling by dephosphorylating phosphatidylinositol (3–5)-trisphosphate (PIP3), but its role as a phospho-tyrosine phosphatase remains elusive thus far (27–29). Shp2 acts to promote the Erk pathway and it may regulate the PI3K-Akt pathway positively or negatively in different cell types (30, 31). Several groups generated mutant mouse lines with conditional deletion of Shp2 or Pten in the hematopoietic compartment, which confirmed a negative role of Pten and a positive role of Shp2 in hematopoiesis (8, 9, 11, 12). Given the apparently opposite phenotypes of PKO and SKO mice in several aspects, we have interrogated a possible antagonizing effect between Pten and Shp2, by creating a new compound mutant mouse line (DKO) with both Shp2 and Pten removed in hematopoietic cells.
Phenotypic analysis of the DKO mice indeed revealed opposing roles of Pten and Shp2 in myelopoiesis, characterized by almost normalized counts of WBCs, lymphocytes, monocytes, and granulocytes in DKO mice (Fig. 1C). In particular, ablating Shp2 largely compromised the excessive expansion of Mac1+Gr1+ myeloid progenitor cells induced by Pten deficiency (Fig. 1 D–F). CFU assays in vitro also indicated mutually neutralizing effect of Shp2 and Pten deletion on most of the common and lineage-committed progenitors examined (Fig. 2 E and F and Fig. S1). Furthermore, BM transplantation demonstrated an inhibitory effect of Shp2 loss on MPN development induced by Pten loss (Fig. 2 G–I). In aggregate, these data indicate antagonistic roles of Pten and Shp2 in MPN development.
The molecular mechanism underlying the opposing effects of Shp2 and Pten is not fully understood. Evidently, Shp2 and Pten do not have direct physical interaction, nor do these two enzymes share common substrates. Dramatic increase in phospho-Akt signals was detected in PKO cells, which was compromised by additional Shp2 ablation (Fig. S2). On the other hand, the defective expression of Kit observed in Shp2-deficient myeloid cells was also alleviated by dual deletion of Pten and Shp2 (11), suggesting a cross-talk of their regulated downstream signals in hematopoietic cells. In addition, impaired Erk signaling resulting from Shp2 deficiency may also counteract the effect of Akt hyperactivation induced by Pten loss, resulting in “normalized” myeloproliferation.
The unanticipated and most interesting data obtained in this study is the development of lethal anemia in DKO mice, as concerted actions of Pten and Shp2 in erythropoiesis were not predicted based on the previous knowledge of their functions. The severe anemia is clearly not because of Epo deficiency. In fact, the serum Epo level was drastically elevated in DKO mice, compared with WT, SKO, and PKO animals (Fig. 3H). Consistent with the high circulating Epo levels, the DKO mice had dramatically increased number of progenitor cells and increased BFU-E (Fig. 3F). However, the more mature CFU-E numbers were significantly reduced (Fig. 3G), suggesting a cooperating role of Pten- and Shp2-regulated signals in promoting progenitor differentiation of erythroid lineage. Relative increase of CD71medTer119+, together with a decrease of CD71lowTer119+ cells, was also detected in DKO mice (Fig. 3 D and E).
In addition to defective progenitor differentiation, a survival problem of Shp2- and Pten-deficient RBCs also contributed to the lethal anemic phenotype. An in vivo labeling experiment showed significantly shortened lifespan for RBCs in DKO mice (Fig. 4A). Elevated ROS levels were detected in DKO mice (Fig. 4B), suggesting a role of oxidative stress in lowering RBC survival. Indeed, treating DKO mice with antioxidant alleviated partially the anemic phenotype, as evidence by the increase of RBC number and hematocrit value (Fig. 4 C–E). Therefore, we believe that combined defects in erythrocyte differentiation and survival contribute to the lethal anemic phenotype in DKO mice.
This story clearly illustrates a cell type-specific signal cross-talk in various blood cell lineages. Shp2 and Pten can work either antagonistically or cooperatively in myelopoiesis and erythropoiesis, respectively. In a similar analysis of two PIP3 phosphatases, PTEN and SHIP, Moody et al. generated Pten+/−SHIP−/− mice and found that the compound mutant developed leukocytosis, anemia, and thrombocytopenia (32). This finding was contrary to the prediction that exaggerated myeloproliferation and leukemogenesis phenotype might be detected in Pten+/−SHIP−/− mice compared with SHIP-deficient mice as a result of excessive PIP3 production. Therefore, one cannot simply predict the outcome of signal cross-talk based on previous knowledge on each molecule. Given the leukemogenic effect of activating PTPN11/Shp2 mutations or Shp2 overexpression in different types of human leukemia (30, 33, 34), Shp2 has emerged as an attractive therapeutic target for mechanism-based treatment of leukemia (30, 35). It was demonstrated recently that a Shp2-inhibitory compound corrected oncogenic Kit-triggered MPN in mouse models (36). However, the multifaceted roles of Shp2 and Pten in hematopoietic cells revealed in this study raise caution for clinical use of specific Shp2 inhibitors for patients with Pten mutation or deficiency. Despite its potent antimyeloproliferative effect, the Shp2 inhibitor caused anemia in PKO mice. Similarly, treatment of PKO mice with the Mek inhibitor Trametinib also triggered anemia while suppressing myeloproliferation. Importantly, Trametinib is being widely used in clinical treatment of melanoma and other types of cancer, with anemia reported as a frequently seen side effect. Given the high frequency of Pten gene mutation, inactivation, or defective expression in various types of cancer, it will be interesting to determine the correlation between patients’ anemia development and Pten deficiency in blood cells. Thus, genetic screening of Pten loss or inactivation may be necessary before administering Trametinib to leukemia or cancer patients.
In conclusion, despite a wealth of knowledge on functions of individual signaling molecules, design of most effective therapeutic strategies will require full understanding of cell type-specific cross-talks of different pathways.
Materials and Methods
Mutant Mouse Generation and Analyses.
All mice were housed in the Undergraduate Research Center facility of University of California, San Diego or in the animal facility at Ren Ji Hospital, Shanghai Jiao Tong University in pathogen-free environment with controlled temperature and humidity. The animal experiment protocols were approved by the Animal Care Committee at University of California, San Diego or Ren Ji hospital. Mx1-Cre+:Shp2flox/flox (SKO) mice were generated in this laboratory, as previously described (22, 23). Ptenflox/flox mice were purchased from Jackson Laboratory, which were originally deposited by H. Wu at the University of California, Los Angeles (37). Ptenflox/flox mice were bred with Mx1-Cre+ mice to generate PKO mice and crossed with Shp2flox/flox to produce Shp2 and Pten DKO animals. Poly-I:C was reconstituted according to manufacturer’s (GE Amersham) instructions. Five doses of Poly:I-C (10 mg/kg) were given to control and experimental groups by intraperitoneal injection every other day. Peripheral blood was collected through cheek bleeding. Complete blood cell counts were performed with the VetScan HMII Hematology System (Abaxis). Flow cytometric staining and sorting were performed as described previously (11). Detailed experimental materials and methods are available in SI Materials and Methods.
PCR Genotyping.
DNA was extracted from peripheral blood using DNeasyBlood & Tissue Kit (Qiagen). Primers for Shp2 genotyping were 5′-AAG AGG AAA TAG GAA GCA TTG AGG A-3′ and 5′-TAG GGA ATG TGA CAA GAA AGC AGT C-3′. PCR products for Shp2flox and Shp2− alleles were 1,000 bp and 400 bp, respectively. Primers for Pten genotyping were 5′-ACT CAA GGC AGG GAT GAG C-3′, 5′-AAT CTA GGG CCT CTT GTG CC-3′, and 5′-GCT TGA TAT CGA ATT CCT GCA GC-3′. PCR products for Ptenflox and Pten− alleles were 1,000 bp and 400 bp, respectively.
BM Transplantation.
BM cells were harvested from mouse femur and tibia, and RBCs were lysed by the NH4Cl RBC lysis buffer. In the reconstitution experiment, 2 × 10⁵, 5 × 10⁵, or 1 × 10⁶ BMNCs from control or mutant animals (CD45.2) were mixed with 2 × 10⁵ BMNCs from CD45.1 mice and transplanted to recipient mice that received lethal irradiation at a dosage of 1,000 rads.
Histopathology.
Spleen and liver samples were fixed in 4% (wt/vol) paraformaldehyde and paraffin-embedded. Sections were cut at 5 μm, and slides were stained with H&E following standard protocols. Chloroacetate esterase staining was performed using Naphthol AS-D Chloroacetate kit from Sigma. Blood smear films were stained in Wright–Giemsa staining solution (Sigma) for 1 min followed by wash with deionized water. Cytospin slides were prepared using 5 × 10⁵ BM or spleen cells. Giemsa staining was then performed for histological examination.
Erythrocyte Lifespan Measurement.
Sulfo-NHS-Biotin (50 mg; Thermo Scientific) was dissolved in 16.6 mL saline. To determine the lifespan of erythrocytes in primary mice, freshly reconstituted Sulfo-NHS-Biotin solution was injected into mice at dosage of 30 mg/kg through tail vein at 1 wk after final injection of poly-I:C. After 2 h, peripheral blood was collected for APC-efluo780 conjugated streptavidin staining to confirm the labeling efficiency above 90%. The survived Sulfo-NHS-Biotin labeled RBCs were analyzed at 1, 2, and 3 wk after labeling. To measure the lifespan of erythrocytes in transplanted recipients, recipient mice were first engrafted with untreated Mx1-Cre+:Ptenfl/fl:Shp2fl/fl; Mx1-Cre−:Ptenfl/fl:Shp2fl/fl; Mx1-Cre+:Ptenfl/fl, and Mx1-Cre+:Shp2fl/fl BMNCs. Five doses of poly-I:C were administrated to the recipients as described above to induce gene deletion at 1 mo after transplantation. RBCs were labeled at 1 wk after the final poly-I:C injection and lifespan was determined.
Antioxidant Treatment.
Experimental mice were treated with 1 g/L N-acetyl cysteine and 4 g/L l-Ascorbic acid (Sigma) in drinking water and intraperitoneally injected with 2 mg N-acetyl cysteine every other day for 30 d. Twenty days after the initial day of antioxidant treatment, poly-I:C was administered for Cre recombinase induction following standard procedure.
Statistical Analysis.
Statistical analysis was performed using GraphPad Prism 5 software. Survival analysis was performed using log-rank test. All of the other statistical analyses were performed with Student's t test.
More information is available in SI Materials and Methods.
SI Materials and Methods
Flow Cytometric Analysis and Sorting.
Lineage-positive hematopoietic cells were stained using mouse hematopoietic lineage flow panel from eBioscience [biotin-conjugated antibodies against CD3 (145-2C11), CD45R/B220 (RA3-6B2), CD11b (M1/70), TER-119, Ly-6G (RB6-8C5)] supplemented with biotin-conjugated antibodies against mouse CD4 (L3T4), mouse CD8 (CD8b, Ly-3) (eBioscience). Streptavidin-conjugated with APC-efluo780 (eBioscience) was used as secondary staining. For myeloid and erythroid progenitor cell staining, additional antibodies against mouse IL-7Ra-PE-CY5 (A7R34), mouse CD16/32-PE(93), and mouse CD71 (R17217) (eBioscience) were used. CMPs were gated as Lin−Sca-1−c-Kit+FcgRloCD34+. GMPs were gated as Lin−Sca-1−c-Kit+ FcgRhiCD34+. MEPs were gated as Lin−Sca-1−c-Kit+FcgRloCD34−. Correspondent isotype controls (eBioscience) were used for proper gating. Hochest33342 (Sigma) was used for DNA staining. For phosphorylated protein staining, antiphospho-AKT(S473) and antiphospho-Erk1/2(T202/Y204) (BD Biosciences) were used following the BD phospho-flow protocol.
In Vitro CFU Assay.
For in vitro CFU assay, 50,000 BMNCs or 100,000 spleen cells were seeded in MethoCultGF M3434 medium (StemCell Technologies) according to the manufacturer’s recommendations. Colonies were visualized and counted under microscope at day 14. The experiment was performed in duplicate for each sample. To assess the CFU-E forming capacity of BM cells, 40,000 BMNCs were seeded into MethoCultGF M3234 medium (StemCell Technologies) supplemented with 6 units per milliliter recombinant human Epo (eBioscience). Colonies were visualized and counted under microscope at day 3. The G-CSF, M-CSF, or GM-CSF responsive colony-forming cells were assessed by seeding 10,000 BM or 100,000 spleen cells in MethoCultGF M3234 medium (StemCell Technologies) containing 10 ng/mL G-CSF, M-CSF, or GM-CSF, respectively. CFU-G, CFU-M, or CFU-GM was enumerated at day 7.
Treatment of Mice with Chemical Compounds.
The Shp2 inhibitor 11a-1 was dissolved in DMSO and injected into mice intraperitoneally (20 mg/kg) every day for 20 consecutive days. MEK inhibitor Trametinib (Santa Cruz Biotechnology) was first dissolved in DMSO, then diluted in 0.5% hydroxylproxyl methylcellulose, 0.2% tween 80 (pH 8.0). Mice were treated with Trametinib via oral gavage at a dosage of 1 mg/kg daily for 20 d. Poly-I:C was administrated for Cre recombinase induction on the first day of inhibitor treatment following standard procedure. Cre+:Ptenfl/fl:Shp2fl/+ mice were used as PKO mice in most of these small compound treatment experiments. We did not observe significant differences between the Cre+:Ptenfl/fl:Shp2+/+ and Cre+:Ptenfl/fl:Shp2fl/+ mice.
Acknowledgments
This work was supported by National Institutes of Health Grants R01HL129763, CA176012, and CA188506 (to G.-S.F.), and R01CA69202 (to Z.-Y.Z.); funds (81270627) from the National Natural Science Foundation of China (to H.H.Z.); Science and Technology Commission of Shanghai Municipality Pujiang program 12PJ1406100 (to H.H.Z.); and the Shanghai Education Committee (Chenguang program12CG16, 13YZ030, and young investigator fellowship), Shanghai Institutions of Higher Learning [The Program for Professor of Special Appointment (Young Eastern Scholar)] (to H.H.Z.).
Footnotes
The authors declare no conflict of interest.
This article is a PNAS Direct Submission.
This article contains supporting information online at www.pnas.org/lookup/suppl/doi:10.1073/pnas.1507599112/-/DCSupplemental.
References
- 1.Zhang Z, et al. Activation of the AXL kinase causes resistance to EGFR-targeted therapy in lung cancer. Nat Genet. 2012;44(8):852–860. doi: 10.1038/ng.2330. [DOI] [PMC free article] [PubMed] [Google Scholar]
- 2.Song MS, Salmena L, Pandolfi PP. The functions and regulation of the PTEN tumour suppressor. Nat Rev Mol Cell Biol. 2012;13(5):283–296. doi: 10.1038/nrm3330. [DOI] [PubMed] [Google Scholar]
- 3.Hollander MC, Blumenthal GM, Dennis PA. PTEN loss in the continuum of common cancers, rare syndromes and mouse models. Nat Rev Cancer. 2011;11(4):289–301. doi: 10.1038/nrc3037. [DOI] [PMC free article] [PubMed] [Google Scholar]
- 4.Gutierrez A, et al. High frequency of PTEN, PI3K, and AKT abnormalities in T-cell acute lymphoblastic leukemia. Blood. 2009;114(3):647–650. doi: 10.1182/blood-2009-02-206722. [DOI] [PMC free article] [PubMed] [Google Scholar]
- 5.Larson Gedman A, et al. The impact of NOTCH1, FBW7 and PTEN mutations on prognosis and downstream signaling in pediatric T-cell acute lymphoblastic leukemia: A report from the Children’s Oncology Group. Leukemia. 2009;23(8):1417–1425. doi: 10.1038/leu.2009.64. [DOI] [PMC free article] [PubMed] [Google Scholar]
- 6.Grønbaek K, Zeuthen J, Guldberg P, Ralfkiaer E, Hou-Jensen K. Alterations of the MMAC1/PTEN gene in lymphoid malignancies. Blood. 1998;91(11):4388–4390. [PubMed] [Google Scholar]
- 7.Sakai A, Thieblemont C, Wellmann A, Jaffe ES, Raffeld M. PTEN gene alterations in lymphoid neoplasms. Blood. 1998;92(9):3410–3415. [PubMed] [Google Scholar]
- 8.Zhang J, et al. PTEN maintains haematopoietic stem cells and acts in lineage choice and leukaemia prevention. Nature. 2006;441(7092):518–522. doi: 10.1038/nature04747. [DOI] [PubMed] [Google Scholar]
- 9.Yilmaz OH, et al. Pten dependence distinguishes haematopoietic stem cells from leukaemia-initiating cells. Nature. 2006;441(7092):475–482. doi: 10.1038/nature04703. [DOI] [PubMed] [Google Scholar]
- 10.Zhu HH, Feng GS. The dynamic interplay between a PTK (Kit) and a PTP (Shp2) in hematopoietic stem and progenitor cells. Cell Cycle. 2011;10(14):2241–2242. doi: 10.4161/cc.10.14.15861. [DOI] [PMC free article] [PubMed] [Google Scholar]
- 11.Zhu HH, et al. Kit-Shp2-Kit signaling acts to maintain a functional hematopoietic stem and progenitor cell pool. Blood. 2011;117(20):5350–5361. doi: 10.1182/blood-2011-01-333476. [DOI] [PMC free article] [PubMed] [Google Scholar]
- 12.Chan G, et al. Essential role for Ptpn11 in survival of hematopoietic stem and progenitor cells. Blood. 2011;117(16):4253–4261. doi: 10.1182/blood-2010-11-319517. [DOI] [PMC free article] [PubMed] [Google Scholar]
- 13.Tartaglia M, et al. Mutations in PTPN11, encoding the protein tyrosine phosphatase SHP-2, cause Noonan syndrome. Nat Genet. 2001;29(4):465–468. doi: 10.1038/ng772. [DOI] [PubMed] [Google Scholar]
- 14.Takahashi K, et al. A novel mutation in the PTPN11 gene in a patient with Noonan syndrome and rapidly progressive hypertrophic cardiomyopathy. Eur J Pediatr. 2005;164(8):497–500. doi: 10.1007/s00431-005-1679-y. [DOI] [PubMed] [Google Scholar]
- 15.Tartaglia M, Gelb BD. Noonan syndrome and related disorders: Genetics and pathogenesis. Annu Rev Genomics Hum Genet. 2005;6:45–68. doi: 10.1146/annurev.genom.6.080604.162305. [DOI] [PubMed] [Google Scholar]
- 16.Lee JS, et al. Phenotypic and genotypic characterisation of Noonan-like/multiple giant cell lesion syndrome. J Med Genet. 2005;42(2):e11. doi: 10.1136/jmg.2004.024091. [DOI] [PMC free article] [PubMed] [Google Scholar]
- 17.Bader-Meunier B, et al. Occurrence of myeloproliferative disorder in patients with Noonan syndrome. J Pediatr. 1997;130(6):885–889. doi: 10.1016/s0022-3476(97)70273-7. [DOI] [PubMed] [Google Scholar]
- 18.Choong K, et al. Juvenile myelomonocytic leukemia and Noonan syndrome. J Pediatr Hematol Oncol. 1999;21(6):523–527. [PubMed] [Google Scholar]
- 19.Tartaglia M, et al. Somatic mutations in PTPN11 in juvenile myelomonocytic leukemia, myelodysplastic syndromes and acute myeloid leukemia. Nat Genet. 2003;34(2):148–150. doi: 10.1038/ng1156. [DOI] [PubMed] [Google Scholar]
- 20.Tartaglia M, et al. Genetic evidence for lineage-related and differentiation stage-related contribution of somatic PTPN11 mutations to leukemogenesis in childhood acute leukemia. Blood. 2004;104(2):307–313. doi: 10.1182/blood-2003-11-3876. [DOI] [PubMed] [Google Scholar]
- 21.Loh ML, et al. Children’s Cancer Group PTPN11 mutations in pediatric patients with acute myeloid leukemia: Results from the Children’s Cancer Group. Leukemia. 2004;18(11):1831–1834. doi: 10.1038/sj.leu.2403492. [DOI] [PubMed] [Google Scholar]
- 22.Mohi MG, et al. Prognostic, therapeutic, and mechanistic implications of a mouse model of leukemia evoked by Shp2 (PTPN11) mutations. Cancer Cell. 2005;7(2):179–191. doi: 10.1016/j.ccr.2005.01.010. [DOI] [PubMed] [Google Scholar]
- 23.Chan G, et al. Leukemogenic Ptpn11 causes fatal myeloproliferative disorder via cell-autonomous effects on multiple stages of hematopoiesis. Blood. 2009;113(18):4414–4424. doi: 10.1182/blood-2008-10-182626. [DOI] [PMC free article] [PubMed] [Google Scholar]
- 24.Zhang J, Socolovsky M, Gross AW, Lodish HF. Role of Ras signaling in erythroid differentiation of mouse fetal liver cells: Functional analysis by a flow cytometry-based novel culture system. Blood. 2003;102(12):3938–3946. doi: 10.1182/blood-2003-05-1479. [DOI] [PubMed] [Google Scholar]
- 25.Marinkovic D, et al. Foxo3 is required for the regulation of oxidative stress in erythropoiesis. J Clin Invest. 2007;117(8):2133–2144. doi: 10.1172/JCI31807. [DOI] [PMC free article] [PubMed] [Google Scholar]
- 26.Zeng LF, et al. Therapeutic potential of targeting the oncogenic SHP2 phosphatase. J Med Chem. 2014;57(15):6594–6609. doi: 10.1021/jm5006176. [DOI] [PMC free article] [PubMed] [Google Scholar]
- 27.Wishart MJ, Dixon JE. PTEN and myotubularin phosphatases: From 3-phosphoinositide dephosphorylation to disease. Trends Cell Biol. 2002;12(12):579–585. doi: 10.1016/s0962-8924(02)02412-1. [DOI] [PubMed] [Google Scholar]
- 28.Cantley LC. The phosphoinositide 3-kinase pathway. Science. 2002;296(5573):1655–1657. doi: 10.1126/science.296.5573.1655. [DOI] [PubMed] [Google Scholar]
- 29.Salmena L, Carracedo A, Pandolfi PP. Tenets of PTEN tumor suppression. Cell. 2008;133(3):403–414. doi: 10.1016/j.cell.2008.04.013. [DOI] [PubMed] [Google Scholar]
- 30.Chan RJ, Feng GS. PTPN11 is the first identified proto-oncogene that encodes a tyrosine phosphatase. Blood. 2007;109(3):862–867. doi: 10.1182/blood-2006-07-028829. [DOI] [PMC free article] [PubMed] [Google Scholar]
- 31.Neel BG, Gu H, Pao L. The ‘Shp’ing news: SH2 domain-containing tyrosine phosphatases in cell signaling. Trends Biochem Sci. 2003;28(6):284–293. doi: 10.1016/S0968-0004(03)00091-4. [DOI] [PubMed] [Google Scholar]
- 32.Moody JL, Xu L, Helgason CD, Jirik FR. Anemia, thrombocytopenia, leukocytosis, extramedullary hematopoiesis, and impaired progenitor function in Pten+/−SHIP−/− mice: A novel model of myelodysplasia. Blood. 2004;103(12):4503–4510. doi: 10.1182/blood-2003-09-3262. [DOI] [PubMed] [Google Scholar]
- 33.Xu R, et al. Overexpression of Shp2 tyrosine phosphatase is implicated in leukemogenesis in adult human leukemia. Blood. 2005;106(9):3142–3149. doi: 10.1182/blood-2004-10-4057. [DOI] [PMC free article] [PubMed] [Google Scholar]
- 34.Tartaglia M, et al. Diversity and functional consequences of germline and somatic PTPN11 mutations in human disease. Am J Hum Genet. 2006;78(2):279–290. doi: 10.1086/499925. [DOI] [PMC free article] [PubMed] [Google Scholar]
- 35.Yu B, et al. Targeting protein tyrosine phosphatase SHP2 for the treatment of PTPN11-associated malignancies. Mol Cancer Ther. 2013;12(9):1738–1748. doi: 10.1158/1535-7163.MCT-13-0049-T. [DOI] [PMC free article] [PubMed] [Google Scholar]
- 36.Mali RS, et al. Role of SHP2 phosphatase in KIT-induced transformation: Identification of SHP2 as a druggable target in diseases involving oncogenic KIT. Blood. 2012;120(13):2669–2678. doi: 10.1182/blood-2011-08-375873. [DOI] [PMC free article] [PubMed] [Google Scholar]
- 37.Lesche R, et al. Cre/loxP-mediated inactivation of the murine Pten tumor suppressor gene. Genesis. 2002;32(2):148–149. doi: 10.1002/gene.10036. [DOI] [PubMed] [Google Scholar]


